The Earth is warming which is driving the ongoing thermal expansion of sea water and the melt of land-based ice. Both processes are raising sea level, but superimposed upon this long-term sea level rise are what scientists at NASA JPL (Jet Propulsion Lab) have coined, "potholes and speed bumps on the road to higher seas". (See their follow-up paper - The 2011 La Niña: So strong, the oceans fell, Boening [2012]).
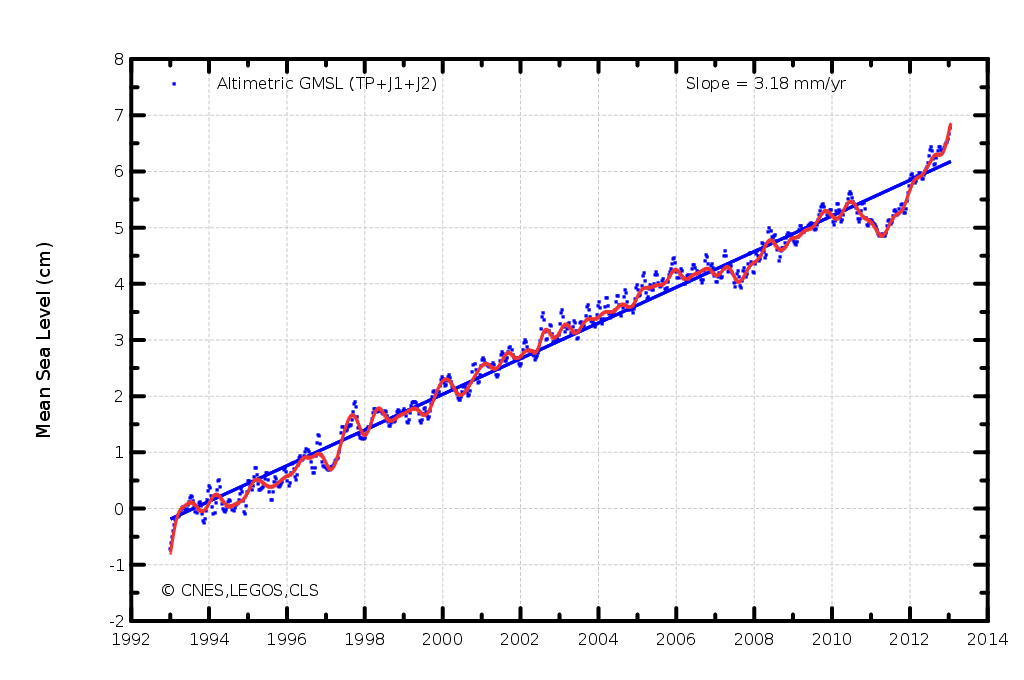
Since mid-2011 a giant "speed bump" has been encountered. In roughly the last two years the global oceans have risen approximately 20 millimetres (mm), or 10 mm per year. This is over three times the rate of sea level rise during the time of satellite-based observations (currently 3.18 mm per year), from 1993 to the present.
Figure 1 - mean sea level (in centimetres) since 1993 obtained by satellite altimetry observations. Annual and semi-annual signals have been removed to reveal the long-term trend. The glacial isostatic adjustment (GIA) of 0.3mm per year is added to account for the slumping of ocean basins. Image from the AVISO website.
So does this mean land-based ice is undergoing a remarkably abrupt period of disintegration? While possible, it's probably not the reason for the giant speed bump.
The largest contributor to the year-to-year (short-term) fluctuation in sea level is the temporary exchange of water mass between the land and ocean. This land-ocean exchange of water is coupled to the natural Pacific Ocean phenomenon called the El Niño Southern Oscillation (ENSO) - which affects weather on a global scale. (See Ngo-Duc [2005], Nerem [2010], Llovel [2011], Cazenave [2012] & Boening [2012] - linked to above)
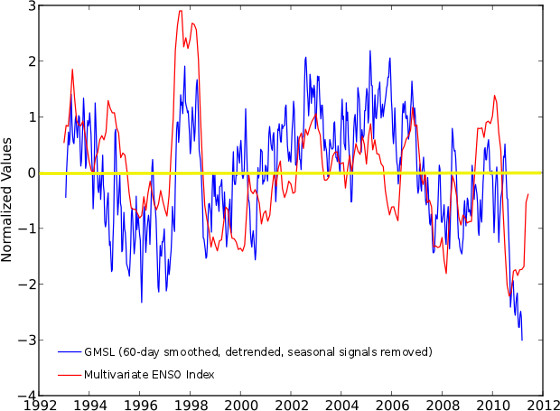
Figure 2 - Global sea level with the long-term rise (trend) removed. Sea level (blue line), compared to the Multivariate ENSO Index (a measure of the state and scale of ENSO) in red. Negative values represent the La Niña (cold) phase, and positive values the El Niño (warm) phase. Image adapted from the University of Colorado (CU) Sea Level Research Group.
The ocean, through strong evaporation in the tropics, is the source of the water that is being exchanged. Each occurrence of ENSO has its own unique set of characteristics, but La Niña is typically (although not always) associated with greater-than-normal rainfall and snow over land, and a consequent sharp, but temporary, fall in global sea level (pot holes) as the continents soak up the extra water. With El Niño we often see greater-than-normal rainfall and snow concentrated over the oceans. Combined with the drainage of water back into the oceans, this causes an abrupt, but temporary, rise in sea level (speed bumps).
Even though El Niño has not developed over the last two years, it appears that a lot of water has drained from the major continental basins over the last (almost) two years - which has created this giant speed bump. This seems to be supported by the latest Multivariate ENSO Index data which shows a progression from strongly negative values (La Niña) in 2011, to mildly positive ones in 2013. Despite current conditions not being classified as El Niño in a technical sense, this change should have led to drying of the continents - as is usual when the weather moves away from a La Niña phase. But that's not the whole story either.
The loss of land-based ice is not a smooth progression. It's a common misconception that the great ice sheets of Greenland and Antarctica are losing more ice year-upon-year, but this isn't quite correct. Ice mass loss is indeed accelerating if we look at say a 10-20 year period, however the ice mass balance is obtained by weighing the snowfall gain on the top of the ice sheet, against the ice loss, through glacier calving, at sea level. This tells us whether the ice sheets have gained ice (mass), or lost it, in any given year. Even though the ice sheets are losing ice at a greater rate over time, there is a great deal of variation from year-to-year (see Van den Broeke [2011]). This mass balance variability is illustrated in Figure 3 below.
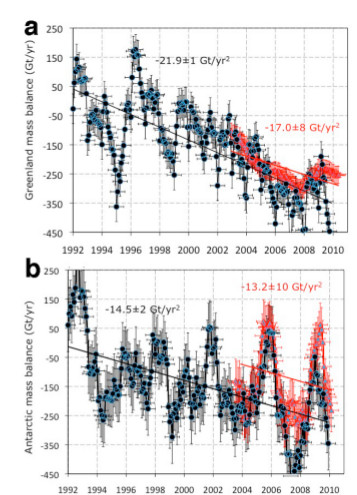
Fig 3 - Mass balance estimate of: a) the Greenland ice sheet, and b): the Antarctic ice sheet. While these estimates have been refined in the intervening period since this paper was published, note the very substantial year-to-year variation in ice sheet mass. Image from Rignot (2011).
Although small in absolute sea level terms, relative to the short-lived land-ocean water exchange, this fluctuation in ice mass balance can either add to, or diminish, the multi-year variability. For a scale comparison; meltwater from the ice sheets of Greenland and Antarctica have added an estimated 11 mm of total sea level rise to the oceans between 1992-2011 (Shepherd [2012]) - about the same amount of sea level rise experienced in the last year alone.
As sea level was going through its dramatic plunge in 2010-2011 we saw a number of contrarians demonstrate their utter lack of understanding of the processes that influence sea level. For instance WUWT, the popular contrarian blog, featured a post by John Kehr on this topic where he wrote:
"...a significant drop in the global sea level highlights serious flaws in the IPCC projections."
and:
"The fact that CO2 levels have been higher in the last 5 years that have the lowest rate of rise than the years with lower CO2 levels is a strong indicator that the claims of CO2 are grossly exaggerated."
Neither of these claims is true. Sea level rise is currently at the upper bound of projections made by the Intergovernmental Panel on Climate Change (IPCC), and increased CO2 concentrations in the atmosphere don't magically make La Niña and El Niño disappear - pot holes and speed bumps will continue.
As with all things in life actual expertise matters.
Examining Figure 1 it is very clear that the last pothole and speed bump are quite unlike anything else in the observational record. The sheer size of the two stand out like a sore thumb. Whether this is just some blip or a sign of things to come is not yet known.
It is, however, useful to point out that, as the oceans and Earth become warmer, the atmosphere is able to hold and redistribute more water vapour. Because this increased capacity rises at a rate faster than the warming itself (the Clausius-Clapeyron relation), we expect to see greater rainfall or snow at times when moisture is converged, and less rainfall or snow when moisture diverges.
This suggests that we are likely, for a time, to observe larger La Niña potholes - when more intense rainfall and snow is dumped over the continents, and larger El Niño speed bumps - when more intense rainfall and snow is focused over the oceans, and the continents become drier.
This enhanced capacity to move water from ocean to land (and vice-versa) via atmospheric warming may be a piece of the puzzle, but it doesn't explain the dramatic change in variability over the last few years. It may be connected to an inferred global brightening (increased solar radiation reaching the Earth's surface) in the last 5-6 years (Klimont [2013]) - a phenomenon which would accelerate the global water cycle (Wild [2011]) - or it could be something else entirely. No doubt it's a subject currently under scientific investigation.
While it is likely that the record 2012 summer melt season on the Greenland ice sheet has shed more ice into the ocean, there's no evidence yet to suggest that either that, or ice loss from Antarctica, has added to this giant speed bump in any significant manner.
Sea level is already committed to rise many metres over the coming centuries because of the concentration of greenhouse gases humans have put into the atmosphere. The warming from this will enforce the continued disintegration of land-based ice, and the thermal expansion of seawater (Meehl [2012], Foster & Rohling [2013]). This uphill road to higher sea level is bound to be long and lumpy one - with many potholes and speed bumps along the way.
Related SkS rebuttals/posts: Why did Sea Level Fall in 2010?, and Global Sea Level Rise: Pothole to Speed Bump.
Posted by Rob Painting on Friday, 29 March, 2013
 |
The Skeptical Science website by Skeptical Science is licensed under a Creative Commons Attribution 3.0 Unported License. |