
The apparent lack of warming in Earth's surface temperature measurements since 1998 is not yet significant from climatic perspective. Surface temperature also seems to be changing according to IPCC projections. Climate model simulations show similar warming breaks, and have done so even before current break started, even if they include the effect of carbon dioxide. Models also can re-create the current break and the cause for the break seems to be known: warming has gone to the oceans instead of warming the surface. The ocean warming has been observed. Also the continuing warming effect of greenhouse gases has been observed. Global warming as a whole seems to continue despite the apparent break in surface measurements.
Several decades of long-term warming is evident in recent surface temperature measurements. However, since 1998 surface temperature records don't show clear warming. This is not very clear because the time period is not very long and the possible trends might not be statistically significant. Skeptical Science trend calculator shows warming trends since 1998 but they are not statistically significant. Santer and others (2011) estimated that it takes 17 years of satellite measurements, before effect of mankind to lower atmosphere can be detected. In some cases, 15 years has been mentioned for the limit of statistical significance, so the situation seems to be quite borderline. For example, from 1983 and 1998, which was time of rapid warming, SkS trend calculator still shows a trend that is not statistically significant. Trend is significant from 1982 to 1998. (Even if statistically enough time would pass without warming, it still wouldn't mean that increases in greenhouse gases wouldn't have a warming effect. This we will see below in more detail.)
Climate is usually considered as average weather over longer period of time. Standard length for the climatic time period is 30 years. Let us see what this means for the surface temperature. Following figure shows Earth's surface temperature as a running 30 year mean (this means that the value of each point in the graph is the average of the surrounding 30 years of temperature values, for example, the running 30 year mean value for year 1990 is the average of temperatures of 30 years between 1975 and 2004):
As we can see from the graph, there are no signs of global warming stopping or even slowing down in this kind of inspection. From climatic perspective global warming still continues. Those with sharp eyes notice that the time shown in X axis stops in the graph before 2000. This is because in 30 year running mean the year 1998 is currently last one that can be shown. However, the temperature evolution after 1998 is included and is affecting the graph starting from 1983. The fact that graph stops at 1998 means that we have to wait 15 years before we know how climate has evolved since 1998.
Although global surface temperature evolution since 1998 is not yet climatically important, there has been quite a lot of research on the issue. One question appearing in public has been that does the temperature follow earlier projections. Rahmstorf and others (2012) have analyzed how IPCC projections match the surface temperature measurements. Here is a graph of their results:

The evolution of Earth's surface temperature and IPCC projections. Surface temperature without corrections is shown in pink (one year running mean averaged from all surface temperature analyses) and corrected surface temperature is shown in red (corrections are explained in text). Blue area and blue lines are IPCC third assessment report projections. Green area and green lines are IPCC fourth assessment report (AR4) projections.
As we can see from the graph, surface temperature changes shown in pink sometimes go outside the projections. This is because some factors are not included in IPCC projections. Such factors are solar activity changes and eruptions of volcanoes. Additionally, the variation of El Niño/La Niña is random and therefore it doesn't change in simulations at the same time it does in real life. IPCC projections are combined results from many simulations, so the El Niño/La Niña variations of different simulations tend to cancel out when simulation results are combined. This means that the projections don't actually include El Niño/La Niña variation either. It should be noted that even if surface temperature shown in pink doesn't stay within limits of projections, it does stay within limits of all individual simulations (not shown in the Figure above).
The effects of the Sun, volcanoes, and El Niño/La Niña variation have been corrected for in the temperature evolution shown in red. This graph stays quite well within limits of projections especially during last few years. It sometimes goes outside the projections in the beginning of the time period. There still might be some factors which would need to be corrected for. On the average it does seem to follow the projections even in the beginning of the time period (at least it doesn't deviate permanently to one direction).
Already happened temperature evolution can be recreated with models also so that internal variability of climate system and changes in solar activity and in volcanoes are included (afterwards we have knowledge for example when a volcanic eruption has happened). Lean & Rind (2009) have done this and the following Figure shows their results:
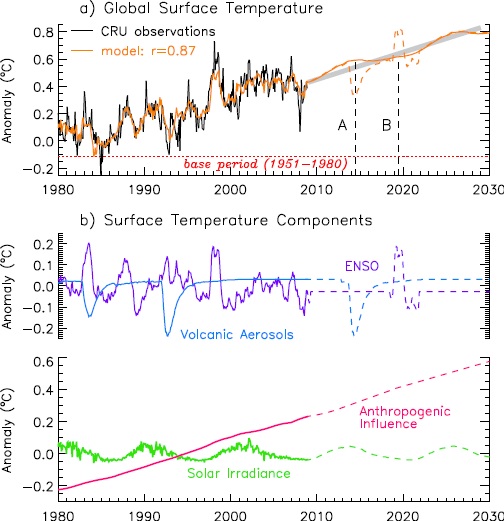 a) The observed surface temperature (black) and simulation of surface temperature from a simple model (orange). b) The factors affecting surface temperature. Graphs are from Lean & Rind (2009).
The result of the simple model shown in the graph is so close to observed surface temperature evolution that we have good reason to suspect this study might be able to answer us why surface temperature has not apparently increased since 1998. Lower part of the Figure shows the factors affecting surface temperature, and from there we can see that ENSO (that is, the variation of El Niño and La Niña) seems to have varied in quite a similar manner than surface temperature in the period in question. Also the cause of the longer-term temperature rise seems to be clear: the effect of mankind is the only one of the factors, which shows long-term increase.
Also the future projections of climate models show periods where surface temperature doesn't increase, even if models have the effect of greenhouse gases included. Here are some examples of such simulations:
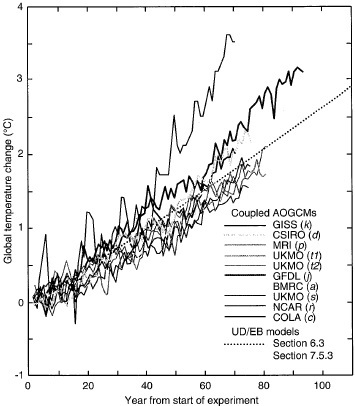
 Projections of climate models show periods of slowed/paused warming similar to that in the observations since 1998. On the left: simulations with three different emission scenarios from IPCC AR4. Upper right: simulation example from Easterling & Wehner (2009). Lower right: simulation example from Meehl and others (2011).
All shown simulation examples show periods where long-term warming trend is paused even for decades, and warming continues after that. The Figure also shows simulation examples from model runs for IPCC AR4 projections. These show similar pauses. AR4 discusses the expected temperature evolution rather carelessly. From the texts of the report one might get an impression that surface temperature should rise certain amount in each decade. They of course mean that on average certain rise in temperature is expected per decade, even if it doesn't occur during each decade. Some people have used the carelessly worded texts in IPCC AR4 to distort the issue, even when the same report shows the simulations presented above, where the truth in the matter can be seen.
Simulation examples shown above are all quite recent. Model simulations have shown similar features also earlier. Here we see an example from IPCC second assessment report (SAR), which was published in 1995, before current warming pause apparently started:
 Model simulations from IPCC second assessment report. Year 0 means year 1990.
One interesting detail in the SAR model simulations is that one of them shows strong spike around 1995. This is comparable to the 1998 peak in observed temperatures. Even if the post-1995 evolution is difficult to see in the graph, we can be sure that the simulation in question shows quite long pause in the warming after 1995. In principle, we could say that the simulation in question predicted the warming pause, albeit being off by few years. It's not genuine prediction of course, but just a coincidence. Nevertheless, it's a quite curious detail.
So, the simulations of climate models show clearly that while the increase of greenhouse gases in the atmosphere increases Earth's surface temperature in the long run, other factors cause pauses to the warming every now and then. Similarly, those other factors also speed up the warming in other times. This has been explicitly stated in Easterling & Wehner (2009): "We show that the climate over the 21st century can and likely will produce periods of a decade or two where the globally averaged surface air temperature shows no trend or even slight cooling in the presence of longer-term warming".
At the moment it seems that the factor causing the pause has been ENSO, which in practice means that the warming effect of greenhouse gases has gone deeper to the oceans instead of warming the surface. This has been the subject of some recent studies.
Already shown above were the results of Lean & Rind (2009) and Meehl and others (2011). Similar results have also been reported by Kaufmann and others (2011), Hunt (2011), Guemas and others (2013), and Watanabe and others (2013). According to all these studies, the primary cause for the apparent pause in the surface warming is that the warming has gone to the oceans. Solar activity has also been said to have played some role on the issue. Also, Solomon and others (2010) have suggested that changes in water vapor content in the atmosphere might have speeded up the warming during the 1990's and slowed the warming during 2000's.
The warming going into oceans has also been observed. Following Figure shows the ocean heat content in the top layer (0-700 m) of the oceans (from Lyman and others, 2010):
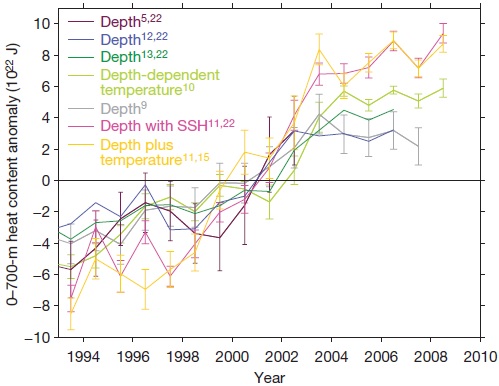
The graph shows that after 1998 the heat content in the oceans has increased substantially.
But when can we expect surface warming to continue? Surface warming continues when the sum of all factors affecting Earth's surface temperature has a warming effect. It can take decades and decades, as long as there are other factors that have large enough cooling effect to mask the warming effect from greenhouse gases. However, our current knowledge suggests that there are no such factors that could have large enough cooling effect in order to make this pause much longer.
There are reasons to think that warming might continue soon. Earth's surface temperature has been very high recently, close to record temperatures, while solar activity has been very low and La Niña has been the prevailing state of ENSO. Without the effect of greenhouse gases these factors would have cooled Earth's surface substantially. We haven't seen such cooling. When La Niña changes to El Niño, it is expected that warming will continue.
So it seems that the warming effect of greenhouse gases seems to be still there. Fortunately, we don't need to guess this, as we also have observations of the effect of greenhouse gases, as we see next.
A group of researchers have studied spectral measurements of outgoing long-wave radiation taken from satellites (Chapman and others, 2013). They found out that the warming effect of carbon dioxide has continued to increase during the 2000's. They calculated from the spectral measurements that between 2002 and 2012 the amount of outgoing long-wave radiation decreased in the characteristic absorption frequencies of greenhouse gases. This was the case at least for carbon dioxide, ozone, and methane. Largest warming effect was from carbon dioxide. Observed decreases in the outgoing long-wave radiation matched the expectation from the increased greenhouse gas concentrations during the study period. Here are their results in a graph:

It should be noted that the study of Chapman and others was presented in a conference in April 2013, and apparently official research paper has not been published yet. Information presented here is from the conference paper.
References:
IPCC AR4 simulations: Figure 10.5 with caption.
D. Chapman, P. Nguyen, M. Halem, A decade of measured greenhouse forcings from AIRS, Proc. SPIE 8743, Algorithms and Technologies for Multispectral, Hyperspectral, and Ultraspectral Imagery XIX, 874313 (May 18, 2013); doi:10.1117/12.2017019. [abstract]
John A. Church, Neil J. White, Leonard F. Konikow, Catia M. Domingues, J. Graham Cogley, Eric Rignot, Jonathan M. Gregory, Michiel R. van den Broeke, Andrew J. Monaghan, Isabella Velicogna, Revisiting the Earth's sea-level and energy budgets from 1961 to 2008, Geophysical Research Letters, Volume 38, Issue 18, 28 September 2011, DOI: 10.1029/2011GL048794. [abstract, full text]
David R. Easterling, Michael F. Wehner, 2009, Is the climate warming or cooling? Geophysical Research Letters, Volume 36, Issue 8, April 2009, DOI: 10.1029/2009GL037810. [abstract, full text]
Virginie Guemas, Francisco J. Doblas-Reyes, Isabel Andreu-Burillo & Muhammad Asif, Retrospective prediction of the global warming slowdown in the past decade, Nature Climate Change, 3, 649–653 (2013) doi:10.1038/nclimate1863. [abstract]
B. G. Hunt, The role of natural climatic variation in perturbing the observed global mean temperature trend, Climate Dynamics, February 2011, Volume 36, Issue 3-4, pp 509-521, DOI: 10.1007/s00382-010-0799-x. [abstract]
Robert K. Kaufmann, Heikki Kauppi, Michael L. Mann, and James H. Stock, Reconciling anthropogenic climate change with observed temperature 1998–2008, PNAS July 19, 2011 vol. 108 no. 29 11790-11793, doi: 10.1073/pnas.1102467108. [abstract, full text]
John M. Lyman, Simon A. Good, Viktor V. Gouretski, Masayoshi Ishii, Gregory C. Johnson, Matthew D. Palmer, Doug M. Smith, & Josh K. Willis, Robust warming of the global upper ocean, Nature 465, 334–337 (20 May 2010) doi:10.1038/nature09043. [abstract, full text]
Gerald A. Meehl, Julie M. Arblaster, John T. Fasullo, Aixue Hu & Kevin E. Trenberth, 2011, Model-based evidence of deep-ocean heat uptake during surface-temperature hiatus periods, Nature Climate Change, 1, 360–364 (2011) doi:10.1038/nclimate1229. [abstract, full text]
Stefan Rahmstorf et al 2012, Comparing climate projections to observations up to 2011, Environ. Res. Lett. 7 044035 doi:10.1088/1748-9326/7/4/044035. [abstract, full text]
B. D. Santer, C. Mears, C. Doutriaux, P. Caldwell, P. J. Gleckler, T. M. L. Wigley, S. Solomon, N. P. Gillett, D. Ivanova, T. R. Karl, J. R. Lanzante, G. A. Meehl, P. A. Stott, K. E. Taylor, P. W. Thorne, M. F. Wehner, F. J. Wentz, 2011, Separating signal and noise in atmospheric temperature changes: The importance of timescale, Journal of Geophysical Research: Atmospheres (1984–2012), Volume 116, Issue D22, November 2011, DOI: 10.1029/2011JD016263. [abstract, full text]
Susan Solomon, Karen H. Rosenlof, Robert W. Portmann, John S. Daniel, Sean M. Davis, Todd J. Sanford, Gian-Kasper Plattner, Contributions of Stratospheric Water Vapor to Decadal Changes in the Rate of Global Warming, Science 5 March 2010: Vol. 327 no. 5970 pp. 1219-1223, DOI: 10.1126/science.1182488. [abstract, full text]
Masahiro Watanabe, Youichi Kamae, Masakazu Yoshimori, Akira Oka, Makiko Sato, Masayoshi Ishii, Takashi Mochizuki, Masahide Kimoto, Strengthening of ocean heat uptake efficiency associated with the recent climate hiatus, Geophysical Research Letters, Volume 40, Issue 12, pages 3175–3179, 28 June 2013, DOI: 10.1002/grl.50541. [abstract]
Posted by Ari Jokimäki on Friday, 30 August, 2013
 |
The Skeptical Science website by Skeptical Science is licensed under a Creative Commons Attribution 3.0 Unported License. |