A new paper by several Skeptical Science contributors (Richardson et al., 2014) in Quaternary International points out that a previous study (Chen et al., 2013) made mistakes in using economics techniques to calculate how much recent global warming is man-made. Most climate science studies, such as the 8 examples here and Stone et al. (2005), Stott et al. (2011), Hegerl et al. (2011), Santer et al. (2013) and Ribes and Terray (2013), conclude that man-made greenhouse gases are responsible for recent global warming. However, Chen et al. calculated that only 50.2% of warming from 1990-2010 was man-made.
It’s important to try new and different techniques to answer difficult scientific questions, and Chen et al. brought in the concept of ‘elasticity’ from economics which measures interactions in the economy. For example Andreyeva et al. (2010) use elasticity to calculate that if the price of soft drinks goes up by 1%, then the amount that people buy tends to go down by about 1%.
Carbon dioxide (CO2) helps to heat Earth's surface, so if you have more CO2 in the atmosphere then temperatures should go up. Instead of looking at the total amount of CO2 in the air, Chen et al. look at how much is emitted in a given year. Their equation says that if the rate of emissions slows down, even though CO2 is still being added to the atmosphere, then they expect temperatures to cool down.
This is like putting a frozen pizza in the oven at 200 ºC (392 ºF), turning the heat down to 180 ºC (356 ºF) a few minutes later and expecting the pizza to re-freeze because the rate of heating has slowed down. It’s obviously not true, but this tricky detail was hidden behind equations.
There’s another major problem. If you’re measuring a physical property and doing it properly, then the result shouldn’t depend on how long you measure it for. I can use a pendulum to measure gravity for 5 minutes today, or I could do it for an hour tomorrow and I’d get the same result.
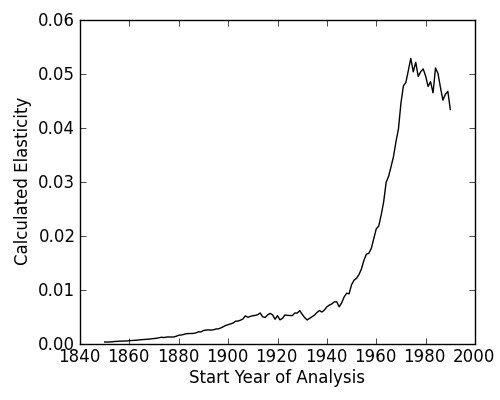
Chen et al. used data from 1960 to 1989 to calculate the ‘elasticity’ of temperature to CO2. If this is a real result then you should get about the same answer if you change the measurement period, but this isn’t what happens. If you just shift the dates by 10 years you can make the answer go down by 50%, or up by 100%. These changes are so big that it’s clear that this elasticity is not a real physical property and the result is not reliable.
Figure 1 This shows how the elasticity calculated by Chen et al. changes with the start year you choose for analysis. If it were a rigorous measurement, then the result should be a flat, horizontal line around the chosen start date. Chen et al. used the value in 1960, when the result is changing rapidly so the calculation is obviously not reliable, and small changes in which data are used can change the result greatly.
Chen et al. calculated a coefficient called r2 that tells you whether one thing is related to another, and found r2 = 0.57 for their data. However, just because two things correlate, it doesn't mean that one thing is truly related to the other. We a physics-based equation called the 'one-box model' (Held et al., 2010) to link the effects of greenhouse gases, air pollution, the Sun and volcanoes to global temperatures. We get r2 = 0.82 and our higher number means a stronger correlation. The one-box model also works over a longer period of time, uses physics and doesn’t predict crazy things like temperatures going down if you heat up Earth. We calculate that about 100% of the recent global warming is man-made although since we just looked at the correlation and don’t fully explore this we say that it’s better to rely on research that used much more complicated techniques to work this out.
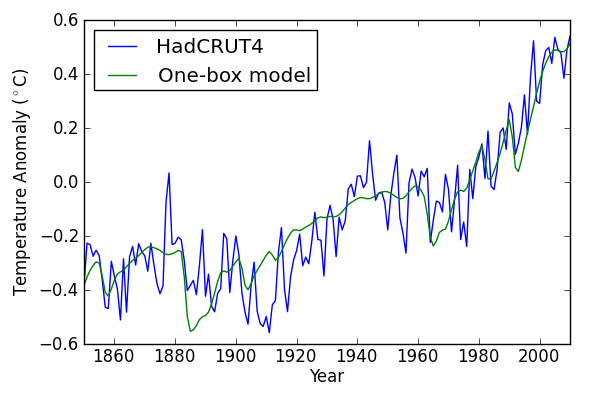
Figure 2 The green line shows the predicted temperature response to changes in heating from greenhouse gases, the effects of some types of air pollution, volcanoes and the Sun. The blue line shows the measurements from the UK's HadCRUT4 near-global temperature record. The long-term changes largely match the expectations of the physics, although there are short-term squiggles that are generally related to changing winds and ocean patterns.
Chen et al. tried a new method to estimate how much of the recent global warming is man-made. They concluded that it’s about 50%, although the consensus result from most climate science studies is around 100%.
It’s great that Chen et al. tried out a new method as this is an important part of science and if different methods give the same answer then we can be confident in our results. ‘What’s causing global warming?’ is a hard question and most studies say that the answer is that humans have caused 100% since 1950.
Chen et al. applied a method from economics to calculate what's causing global warming. This was a good idea: the question 'What is causing global warming?' is an important one and if different methods give the same answer then we can be more confident about the result. However, if they disagree then we need to ask why. It's now clear that Chen et al. didn't go far enough in understanding the physics before doing their calculations. As a result, they predict that heating can make temperatures go down, and give completely different answers depending on the years considered. Our approach is physically reasonable and reaches the same conclusion as the overwhelming majority of attribution studies: recent global warming is man-made.
Posted by MarkR on Thursday, 26 June, 2014
 |
The Skeptical Science website by Skeptical Science is licensed under a Creative Commons Attribution 3.0 Unported License. |