Figure 1: Change in Greenland Ice Sheet elevation (m/year) as measured by CryoSAT-2 over the period covering January 2011 to January 2014.
In a previous post, several years ago, I discussed the various ways that we measure changes in the Antarctic and Greenland ice sheets. Today, scientists still use these main methods for identifying ice changes but recent technological and data processing advances have improved the accuracy of these estimates. An example of this is the CryoSAT-2 satellite system which was launched 4 years ago by the European Space Agency and is now giving early results on the state of the two polar ice sheets. Before discussing the results of this study it is worthwhile to understand what CryoSAT-2 measures.
CryoSAT-2 is a radar altimeter which sends a radar signal towards the ground, this signal is then reflected back to the satellite and using information about the time, phase and geographic position of the satellite we can estimate the elevation of the surface. Repeatedly measuring the surface elevation of an ice sheet over time therefore allows us to assess whether ice is being lost (elevation decreasing) or gained (elevation increasing). The results of early radar altimetry analyses using the ERS-1 and ERS-2 platforms (e.g. Zwally et al. 2005; Wingham et al. 2006) were often misconstrued by contrarians and not provided with the appropriate context necessary to interpret the data.
The important caveats being that these early radar altimetry studies underestimated ice sheet losses due to biases in coastal areas associated with steep slopes and low sensor resolution (e.g. Thomas et al. 2008; Hurkmans et al. 2012). CryoSAT-2 by contrast has a higher resolution and a lower susceptibility to errors on high slopes making it far more suitable for measuring ice changes in the coastal areas of Antarctica and Greenland. These coastal areas, as noted in this post, are the regions most likely to encounter substantial ice losses.
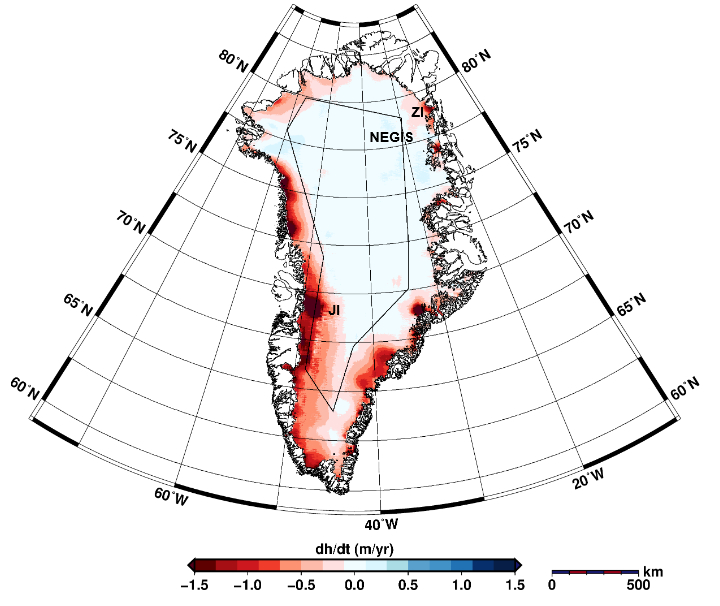
Figure 1: Change in Greenland Ice Sheet elevation (m/year) as measured by CryoSAT-2 over the period covering January 2011 to January 2014.
Using this new dataset, Helm et al (2014) show the wide-swath of ice changes all along Greenland's outer coastline from January 2011 to January 2014 (Figure 1). The ice thinning depicted on this map shows that ice changes are most rapidly occurring along the west coast of Greenland where thinning has been observed hundreds of kilometers inland at some locations. Relative to previous studies covering the period 2003 to 2009, ice losses from the Greenland Ice Sheet have more than doubled reaching -375 +/- 24 km3 per year for the whole ice sheet with much of this increasing ice loss occurring in the southwest. Ice changes across Greenland have also been described by two other recent studies using GRACE satellite data (Velicogna et al. 2014) and combined laser and radar altimetry (Hurkmans et al. 2014) pointing to a substantial, and ever increasing, contribution to sea level rise from the Greenland Ice Sheet (Figure 2).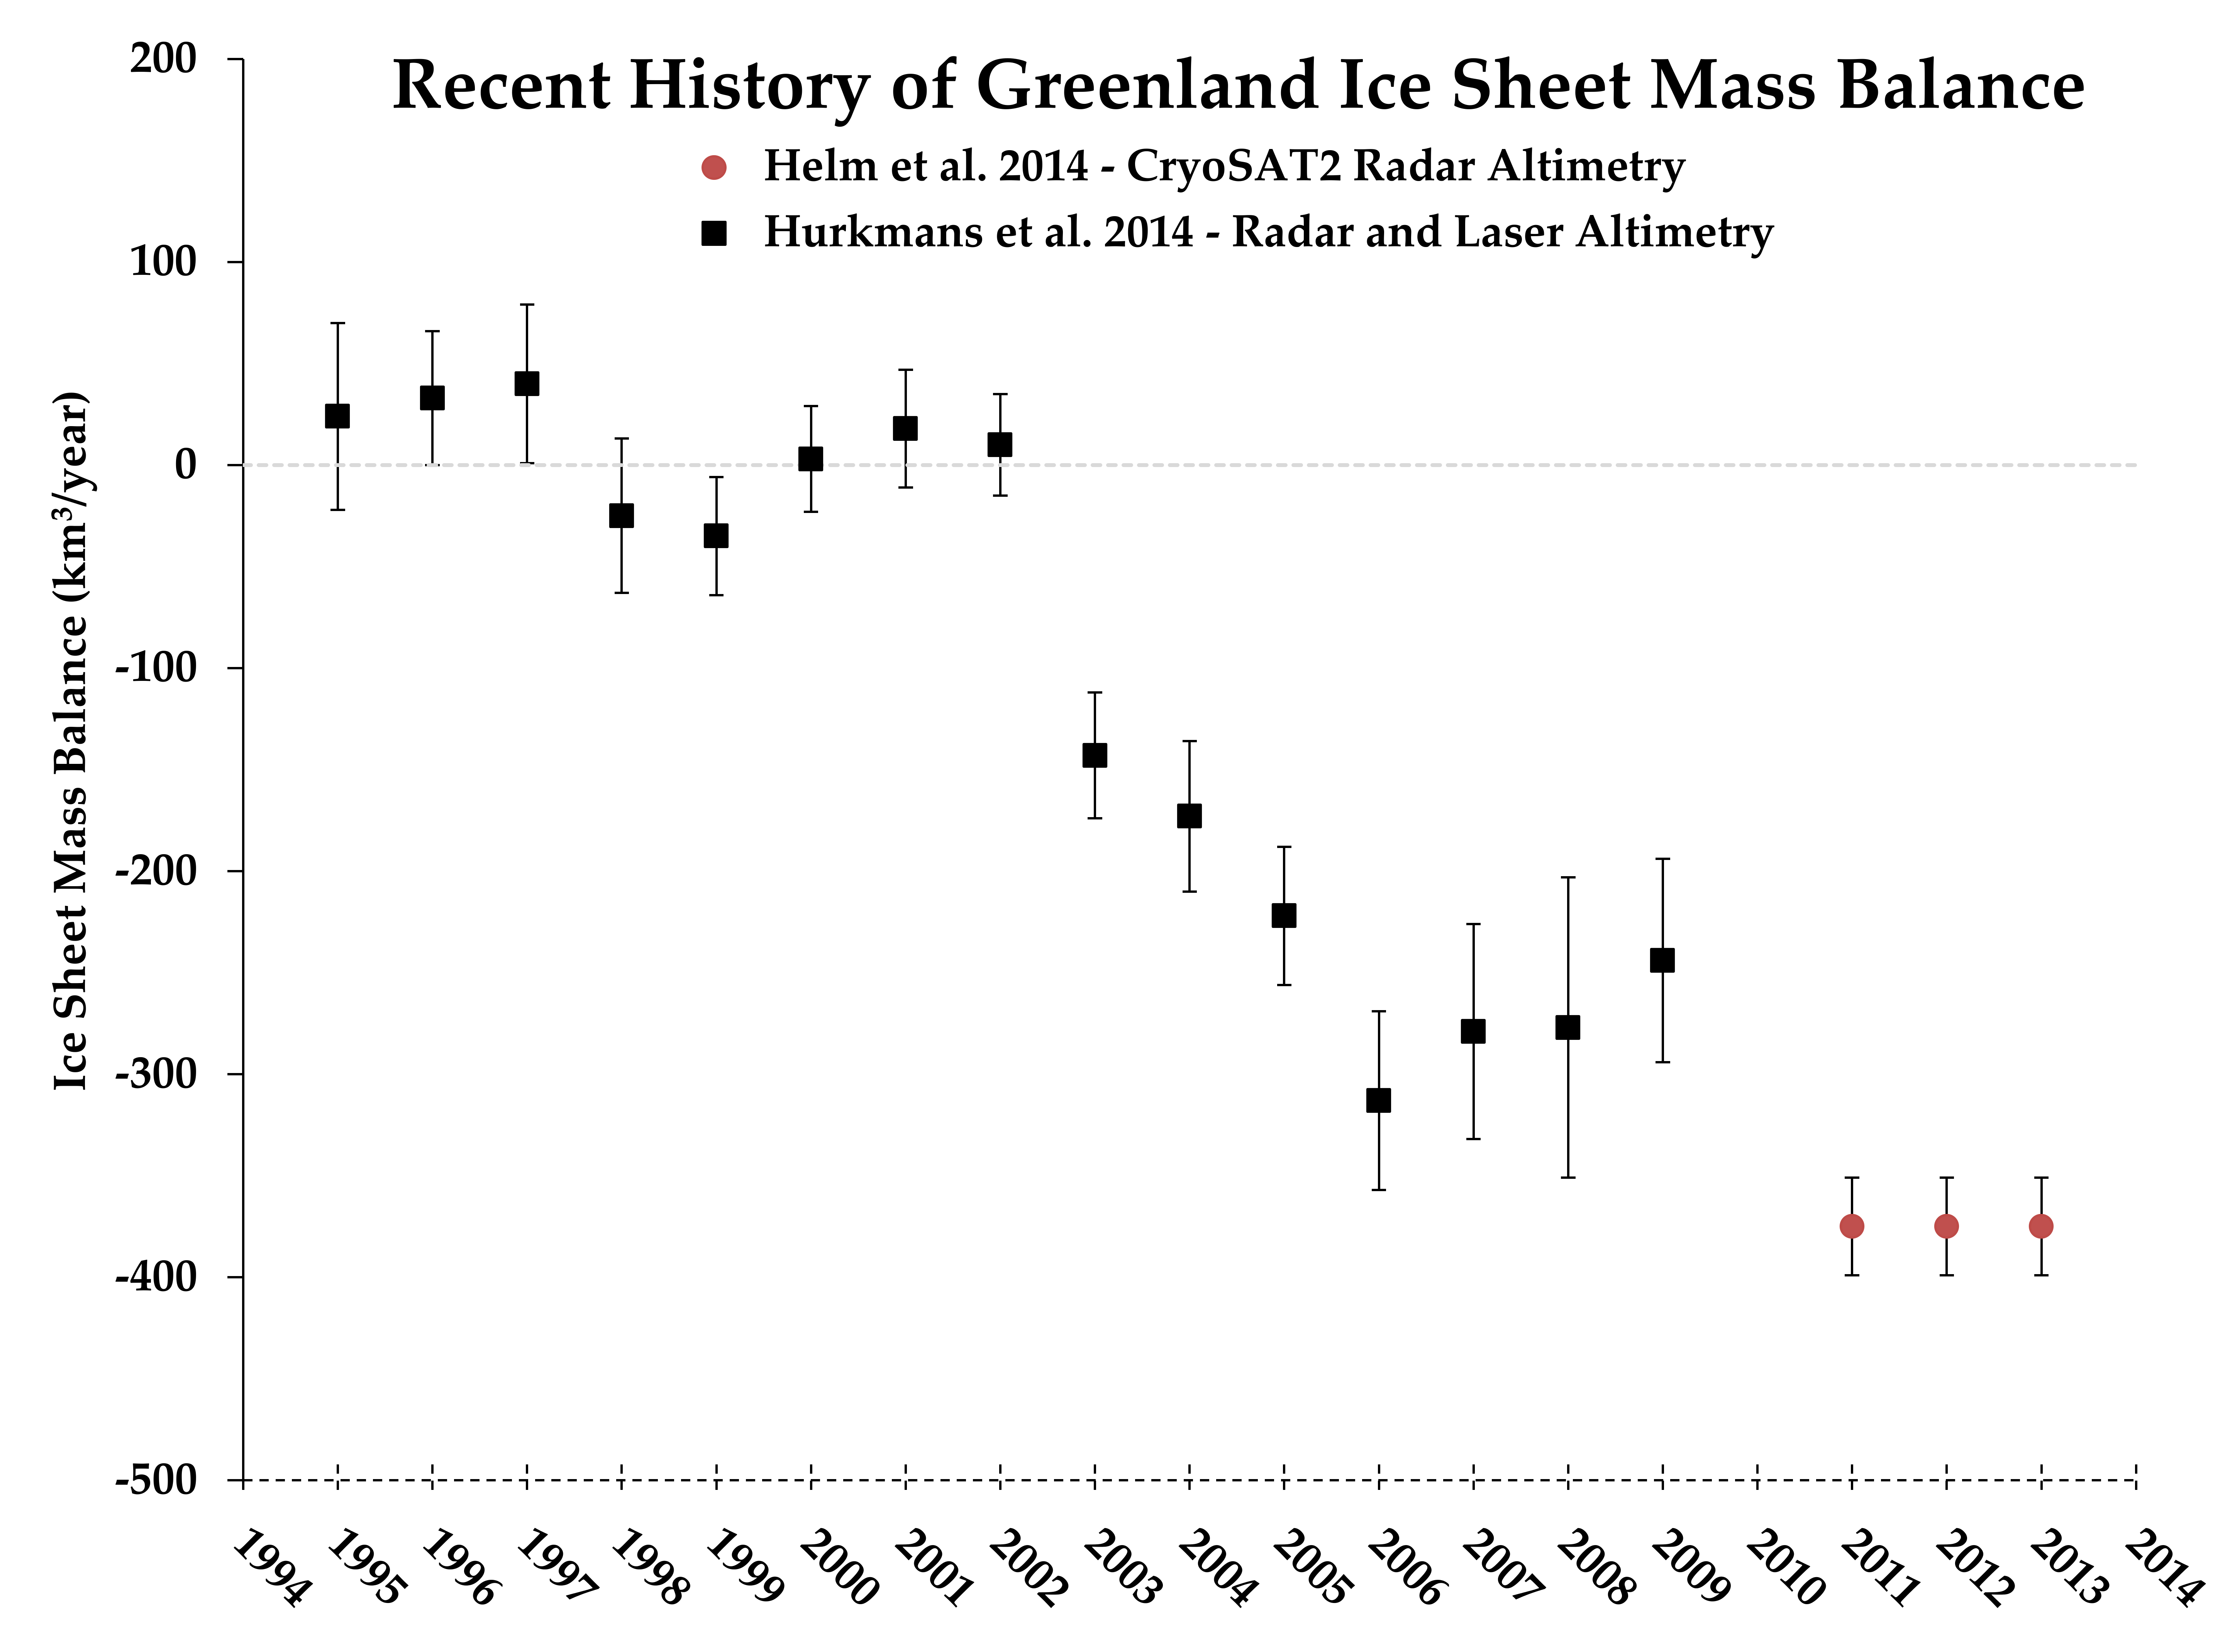
Figure 2: Recent estimates of Greenland ice sheet mass balance derived from Altimetry.
For Antarctica the picture is more complicated. Some areas such as the interior of the west Antarctic Ice Sheet and the Dronning Maud Land area appear to be undergoing some ice gain, which is likely a reflection of increased winter precipitation (Figure 3). Alternatively the most prominent feature that one sees when examining the ice change map is the large ice losses originating along the margins of the West Antarctic Ice Sheet and particularly in the Amundsen Sea Embayment where Pine Island Glacier (PIG) and Thwaites Glacier (TWG) reside.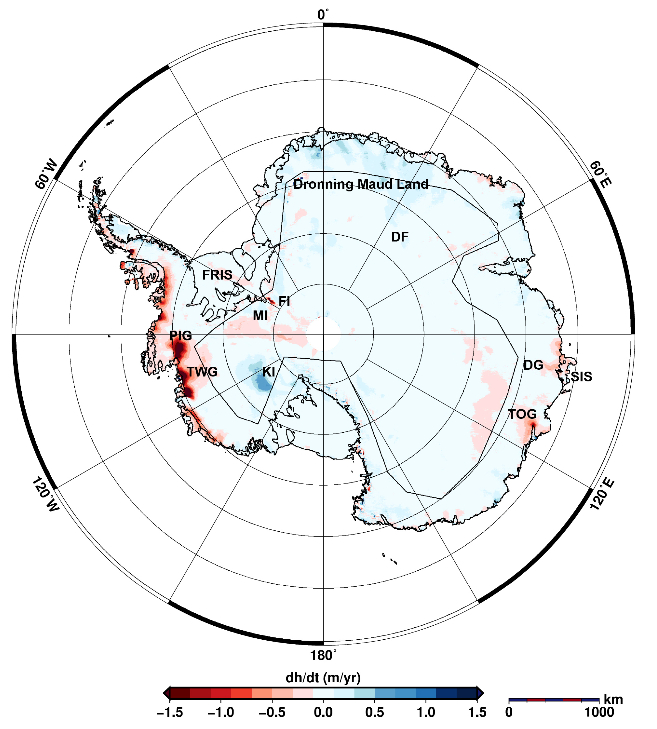
Figure 3: Change in Antarctic Ice Sheet elevation (m/year) as measured by CryoSAT-2 over the period covering January 2011 to January 2014.
Interestingly, we also are beginning to see a signal of increased ice losses along some portions of the East Antarctic Ice Sheet with Totten Glacier (TOG) being the most notable example. Totten Glacier on its own has the potential to raise global sea levels by ~7 m if it were to lose all of its ice; therefore, these new observations of ice thinning in that area are somewhat concerning.
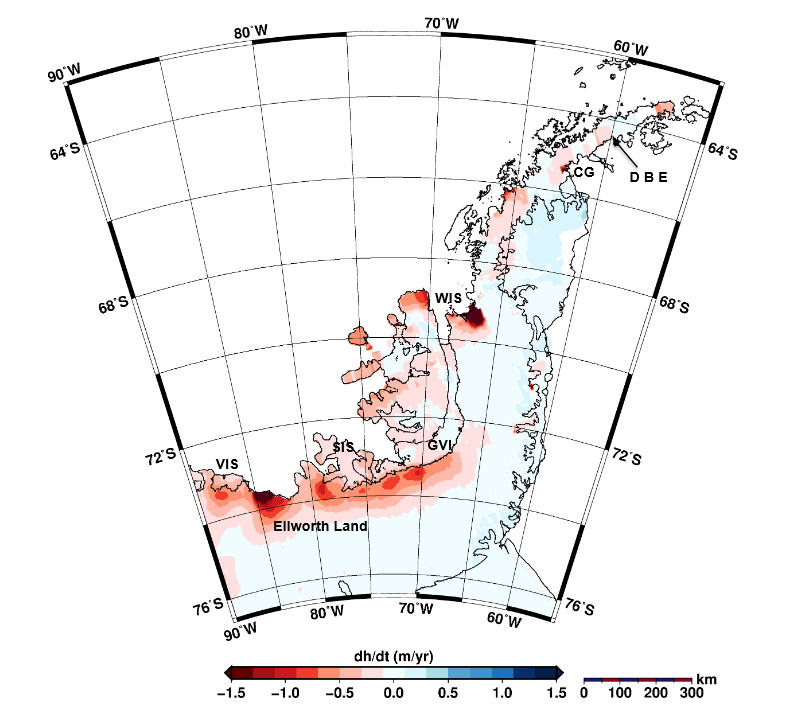
Figure 4: Change in ice elevation (m/year) along the Antarctic Peninsula as measured by CryoSAT-2 over the period covering January 2011 to January 2014.
Along the Antarctic Peninsula the impacts of rapidly rising temperatures are clearly detected from this new dataset with widespread glacier thinning in many areas, but particularly in regions where ice shelves have disintegrated or thinned such as along the Wilkins Ice Shelf (WIS) (Figure 4). As such, the Antarctic Peninsula and the Amundsen Sea Embayment are two regions where acceleration of ice losses appear to be occurring rapidly (Figure 5).
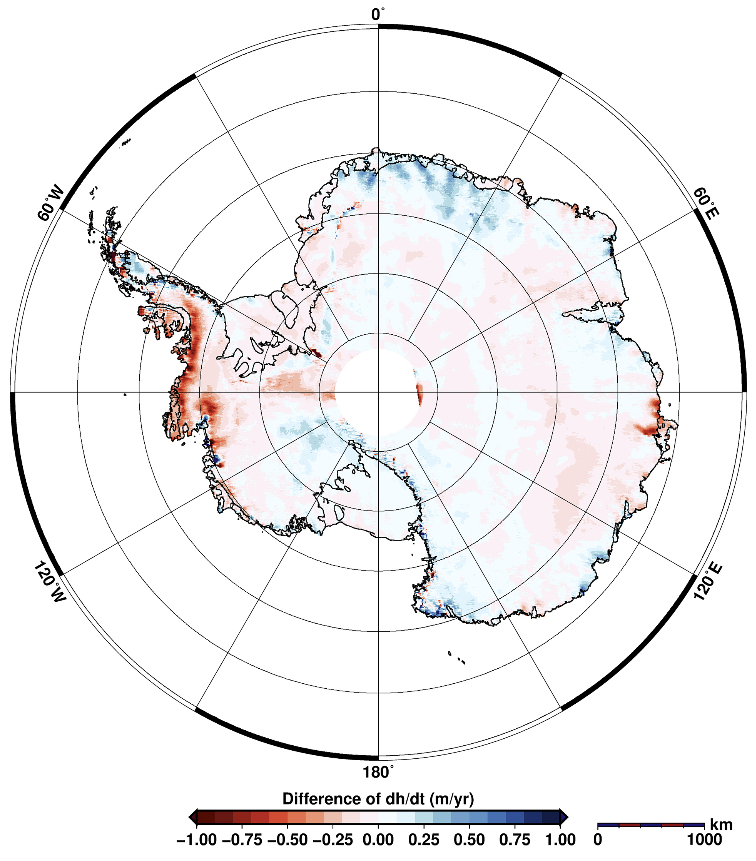
Figure 5: Difference between 2011-2014 and 2003-2009 elevation change rates for the Antarctic Ice Sheet (m/year).
Famously, glaciologist J.H Mercer once wrote in a 1978 paper to nature "One warning sign that a dangerous warming is beginning in Antarctica will be the breakup of ice shelves in the Antarctic Peninsula just south of the recent January 0°C isotherm" corresponding to the ice shelf in Prince Gustav Channel, the Wordie Ice Shelf, the George VI Sound Ice Shelf, and the Wilkins Ice Shelf.
Eerily, history has eventually begun to follow suit: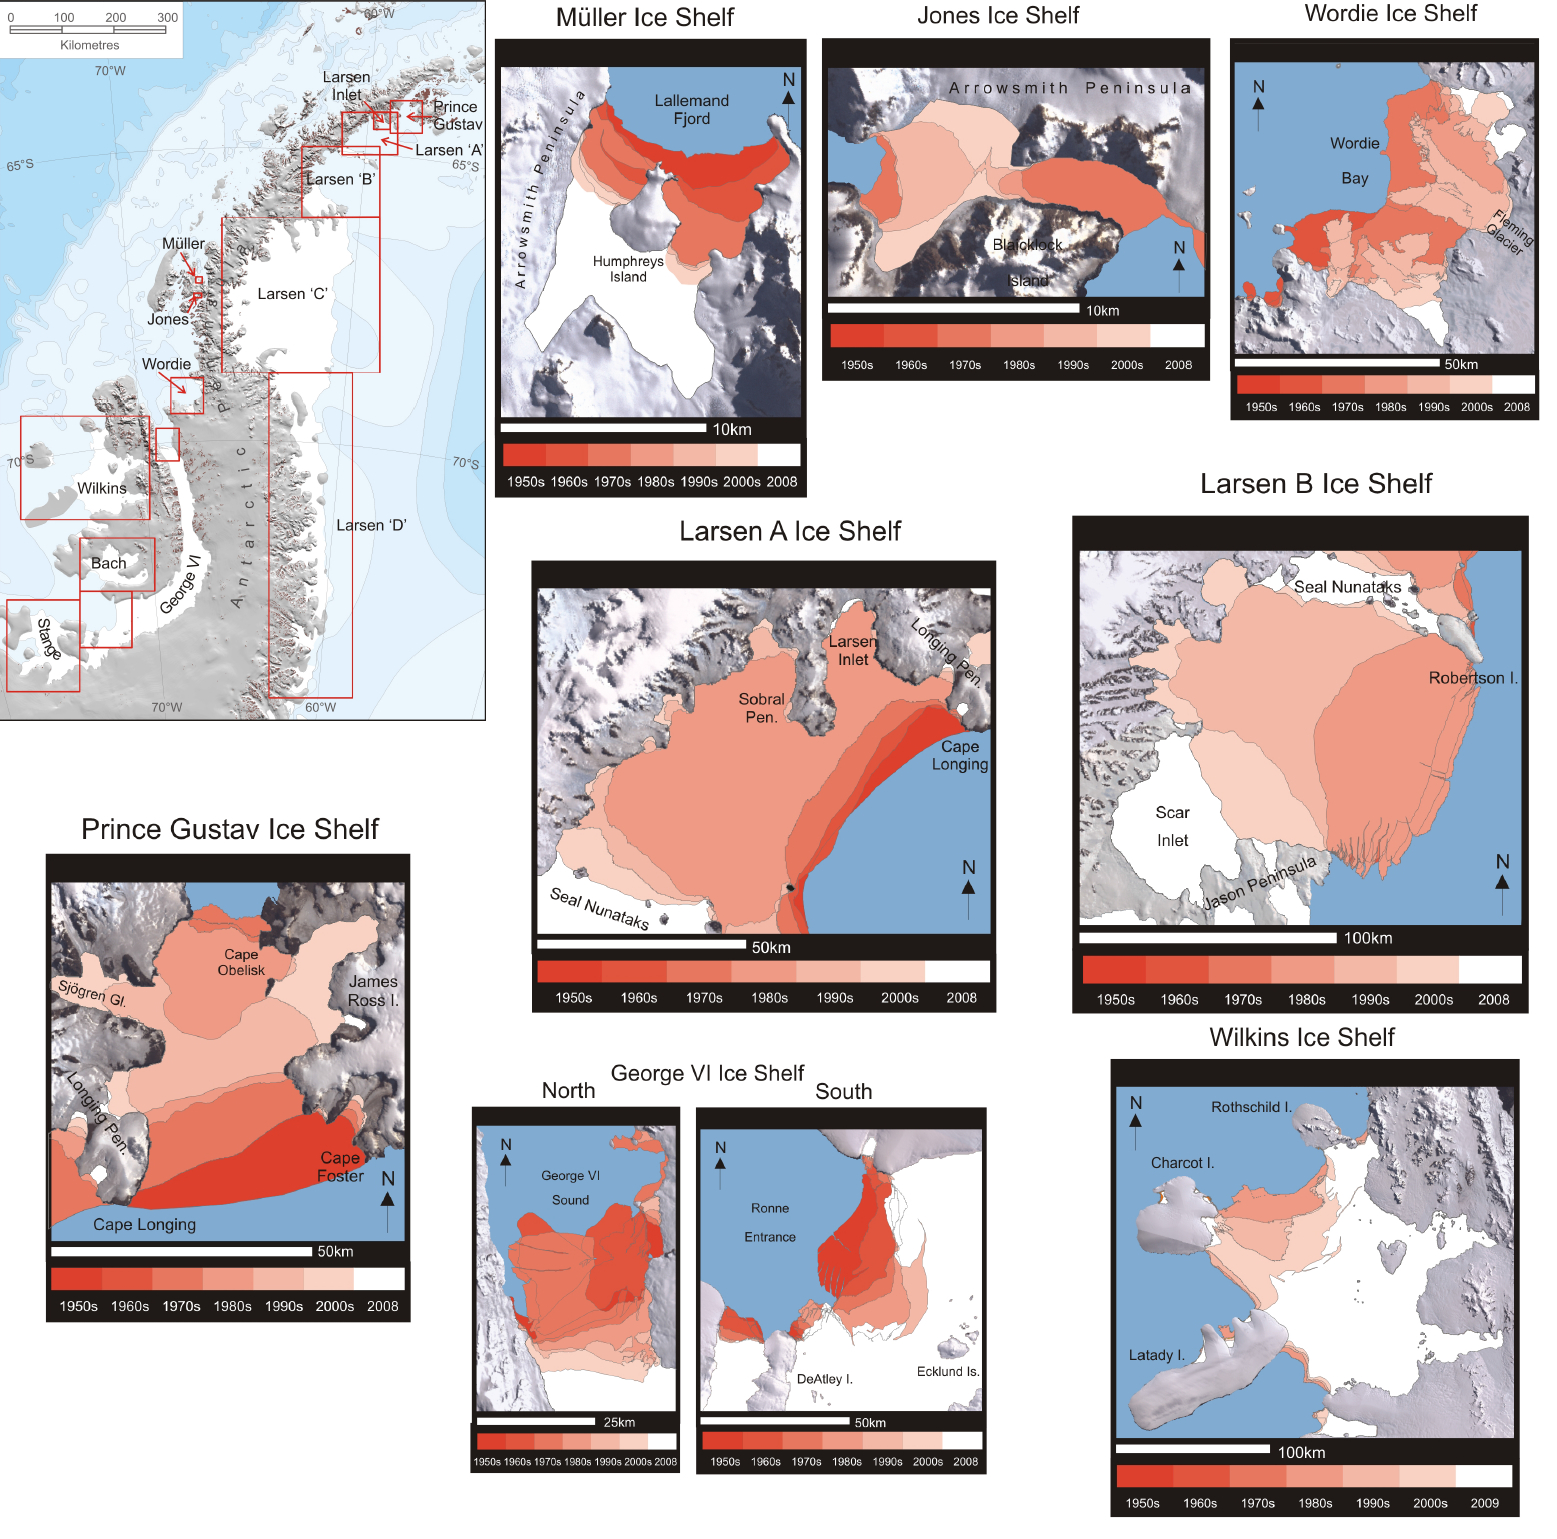
Figure 6: Historical area changes for 9 ice shelves along the Antarctic Peninsula as measured by Cook and Vaughan (2009).
Posted by robert way on Wednesday, 1 October, 2014
 |
The Skeptical Science website by Skeptical Science is licensed under a Creative Commons Attribution 3.0 Unported License. |