In a recent publication in Earth's Future, a new journal published by the American Geophysical Union (AGU) dedicated to "global change and sustainability", a German-US team of researchers showed increasing atmospheric methane abundances over two rapidly developing shale areas, the Bakken and Eagle Ford shales in North Dakota and south Texas, respectively. Their methane emissions estimate is based on the difference in atmospheric methane in these areas between the years prior said rapid development, 2006-2008, and during it, 2009-2011.
Data for the authors' analyses came from the European Space Agency (ESA) ENVISAT's instrument SCIAMACHY, and is unfortunately not available beyond early 2012, when contact with the satellite was lost. The instrument measured the total amount of methane in the atmosphere, the overwhelming amount of which is in the lower 10-12 km, the troposphere. Based on the resolution of the instrument, and the amount of time the satellite spent overhead, the authors used 3 years of data to get high enough precision for their study. They also accounted for how winds displaced the emitted methane differently between the two study periods. The result is depicted in Figure 1 below.
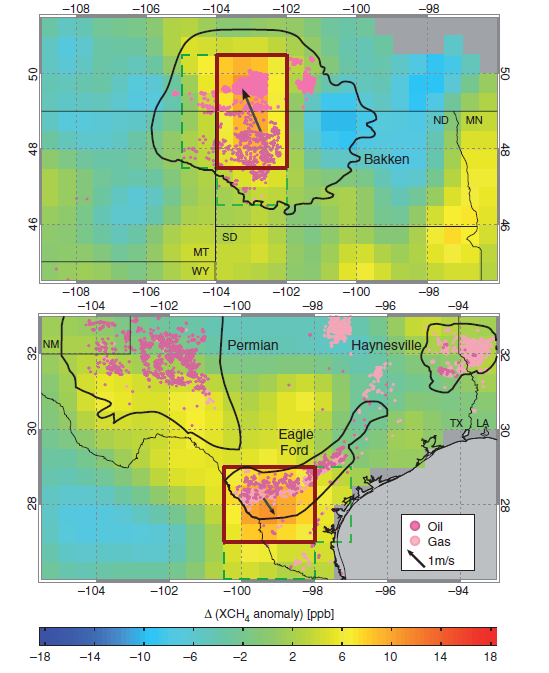
Figure 1: Shown are two latitude-longitude maps of the difference in atmospheric methane abundance (expressed as a mole fraction), or methane anomaly, for the period 2009–2011 relative to the period 2006–2008. The locations of oil and gas wells are shown in pink. The regions used to estimate shale area emissions are red-rimmed. The corresponding regions used to determine the background values are framed by the green dashed lines. Averaged near-surface wind differences between the periods are illustrated by dark grey arrows.
Yellow and orange colors indicate that methane abundance has increased between the periods. The overlap of these regions with the oil and gas wells alongside the slight displacement in accordance with the average wind differences as indicated by the arrows, is a clear sign of the industry's impact on methane. Unlike the recent studies by NOAA, comparisons to the same shale area over time avoids necessary corrections for methane sources other than oil and gas mining activities, since these other sources are not significantly changing in time. That also explains why the authors' methodology does not highlight other shale areas as prominently, since unchanging methane emissions between the compared periods, even though potentially very high, cancel by this methodology.
Not surprisingly, the nature of this type of analysis, particularly a small signal-to-noise ratio (±4 ppb in Fig. 1 is likely noise), leads to a rather large possible range for the integrated emissions estimate. The authors offer this graphic (Fig. 2) as their summary, comparing recently published methane "leakage" rates to their own analysis for the Bakken and Eagle Ford shales:
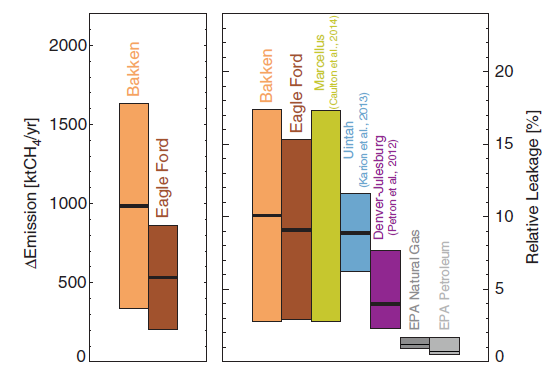
Figure 2 (original caption):Estimated methane emissions are shown for the targeted regions Bakken in light brown, and Eagle Ford in dark brown. Shown are absolute emission increase (2009–2011 relative to 2006–2008) in the left panel, and the leakage rate relative to production in the right panel, in each case together with the 1 σ-uncertainty ranges. For comparison, leakage estimates from previous studies in Marcellus (2012) [Caulton et al., 2014], Uintah (2012) [Karion et al., 2013], and Denver-Julesburg (2008) [Pétron et al., 2012] (yellow, blue, and magenta) are shown together with the EPA bottom-up inventory estimates for natural gas and petroleum systems (2011) [U.S. Environmental Protection Agency, 2014] (grey) in the right pane.
The satellite data analysis work is adding to a number of recent publications outlining that methane emissions from (unconventional) oil and gas exploration are much higher than the industry is claiming. As a result, the US federal government's standpoint that increased natural gas use has been reducing greenhouse gas emissions is becoming more and more questionable.
What is missing from this new work is one of the major differences that distinguishes the Bakken and Eagle Ford shale areas from others in the US: the large amount of continuous, uncontrolled flaring at (tight) oil wells. As recently highlighted in a series of investigative journalism at the San Antonio Express News, the flaring of co-produced ("associated") gas at oil wells is prolific, with annual gas amounts flared exceeding what all of metropolitan San Antonio consumes, according to the journalists. Flaring, and the associated billions of $$ wasted and air pollution created, used to be something visible in Russia, Nigeria, or Iran; but the US has catapulted itself into the top 5 flaring nations within a few years, with still more than one third of gas produced in the Bakken shale area wasted.
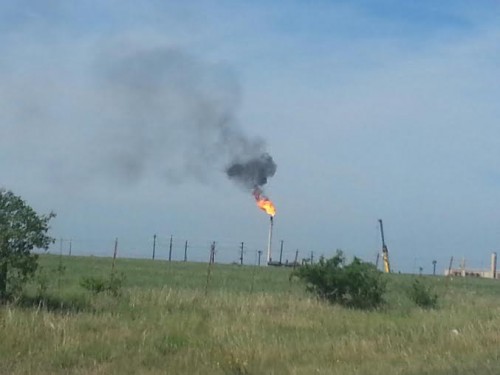
Figure 3: a typical flare in Karnes County, TX, center of the Eagle Ford shale (source).
At the same time, the industry's front group, energyindepth.org, is becoming more desperate in denying the problem. In their comment on the Earth's Future publication, the author misconstrues the study's results, e.g. by misrepresenting methane emissions with concentrations. In addition, the front group keeps reiterating EPA's industry-based methane emissions estimates, a poor argument in light of what EPA's emission inventory actually means. Equally unsurprising is the front group's repeated attack on the seminal publication by Howarth, Santoro and Ingraffea, as if the claimed refutation of its results somehow invalidates all subsequent findings of high methane emissions. The parallels to Global Warming denial are all too obvious.
Instead, science progresses. Robert Howarth himself reflected on this progress in a recent publication reviewing the findings since their 2011 paper. He concludes by asking
"Is natural gas a bridge fuel? "At best, using natural gas rather than coal to generate electricity might result in a very modest reduction in total greenhouse gas emissions, if those emissions can be kept below a range of 2.4–3.2% (based on [Alvarez et al., 2012], adjusted for the latest information on radiative forcing of methane [34]). ..."
This is especially relevant since another recent study highlights the finding that it is unlikely that increasing natural gas extraction is only used for electricity production. Instead, natural gas is going to replace all other uses of energy, including renewables, and thus its increasing exploitation is not likely to reduce overall greenhouse emissions:
"The impact on CO2 emissions [...] is found to be much smaller (from -2 per cent to +11 per cent), and a majority of the models reported a small increase in climate forcing (from -0.3 per cent to +7 per cent) associated with the increased use of abundant gas. Our results show that although market penetration of globally abundant gas may substantially change the future energy system, it is not necessarily an effective substitute for climate change mitigation policy."
Posted by gws on Tuesday, 11 November, 2014
 |
The Skeptical Science website by Skeptical Science is licensed under a Creative Commons Attribution 3.0 Unported License. |