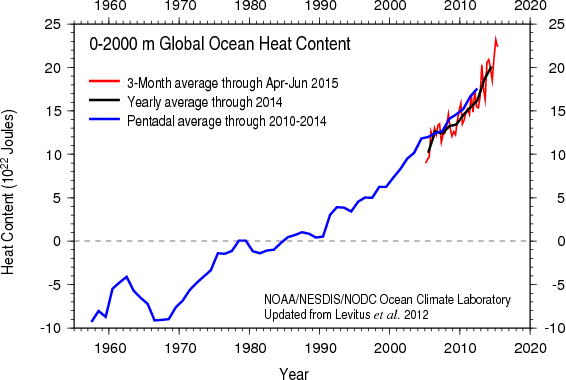
Ocean warming has made up 93% of global warming in the last 5 decades (IPCC AR5 Chapter 3) and the first six months of ocean heat data for 2015 are now available from the National Centers for Environmental Information (NCEI). Armed with the knowledge that increasing industrial greenhouse gas emissions trap ever more heat in the atmosphere and ocean, it will come as no surprise whatsoever to learn that the strong ocean heating of recent years has continued into 2015.
Figure 1 - Ocean heat content data up to June 2015 for the 0-2000 meter layer of the global ocean. Image from NOAA's National Center for Environmental Information.
In contrast to the Northern Hemisphere, the surface area of the Southern Hemisphere is dominated by the ocean and it's therefore the end of Southern Hemisphere summer, when that hemisphere is closest to the sun, that ocean heat uptake is strongest. Loeb et al (2012), however, demonstrated that outgoing longwave radiation (heat loss) from the Earth increases during El Niño, so it will be interesting to see how things pan out over the next 6-8 months given that we have a powerful El Niño still developing in the Pacific Ocean. We may see a temporary reduction in the rate of ocean warming as the El Niño discharges a greater-than-normal amount of tropical ocean heat to the atmosphere. Inevitably, much of this surplus heat will be radiated out to space.
Figure 2 - Variations in top-of-the-atmosphere radiation over 2000-2010 for the tropics (30° North-30°South. The shaded area (MEI) denotes positive (El Niño) & negative (La Niña) ENSO conditions. ASR=absorbed solar radiation, -OLR=negative outgoing longwave radiation & NET=net radiation anomaly. The feature to note is the gain in planetary energy with La Niña and loss with El Niño. Image adapted from Loeb et al (2012).
Also of interest, and directly connected with increasing ocean heat content due to the expansion of seawater as it warms, is global sea level rise - see Figure 3.
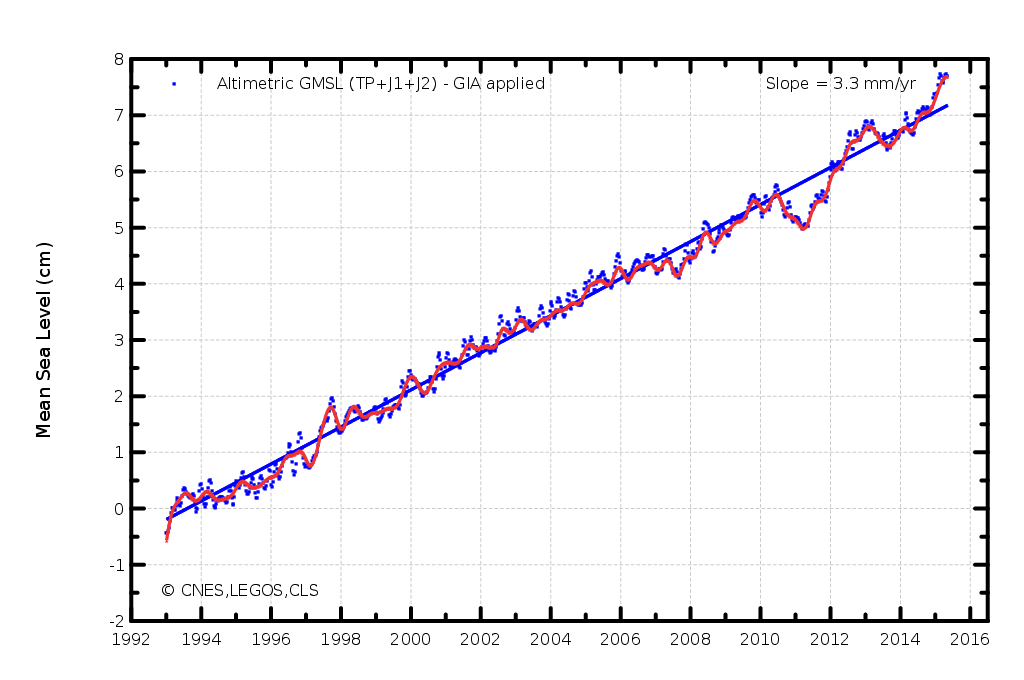
Figure 3 - Sea level rise from 1993-2015 based on satellite altimetry. Image from AVISO.
The large year-to-year fluctuations shown in the graph are caused by short-lived water mass exchanges between the land and ocean. With La Niña anomalous precipitation falls over land, therefore lowering global sea level, and with El Niño this precipitation is concentrated over the oceans, raising sea level as the continental basins dry out and water drains back into the sea.
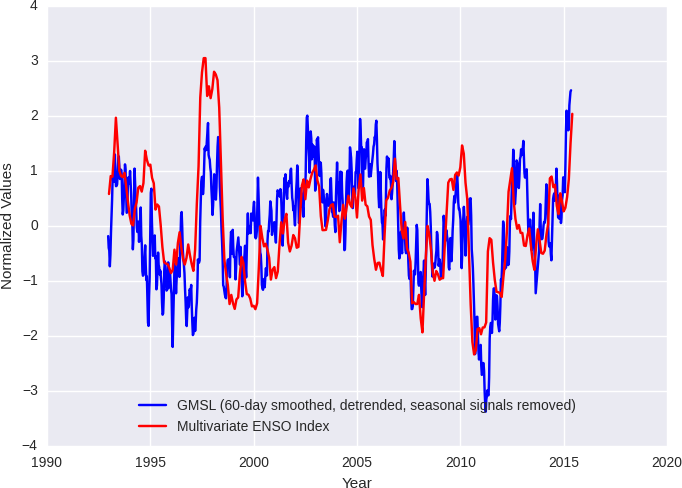
Figure 4 - Detrended global mean sea level and the multivariate ENSO index (a measure of El Niño/La Niña conditions). The short-term sea level fluctuations correlate well ENSO due to the change in spatial patterns of precipitation. Image from the University of Colorado.
Based on scientific understanding of the climate system, it is anticipated that ocean heat content and sea level rise will fluctuate from year-to-year around a long-term increasing trend. So don't expect to see any real let up in ocean warming until humanity takes serious action to drastically reduce the ongoing industrial greenhouse gas emissions that are causing it.
Posted by Rob Painting on Wednesday, 7 October, 2015
 |
The Skeptical Science website by Skeptical Science is licensed under a Creative Commons Attribution 3.0 Unported License. |