With just a month and a half left in 2015, it’s clear this year will be by far the hottest on record, easily beating the previous record set just last year. The temporary slowdown in the warming of global surface temperatures (alsomisnamed the “pause”) has ended, as each of the past four years has been hotter than the one before.
El Niño is one reason 2015 has been such an incredibly hot year. During El Niño events, hot water is transported from the deep ocean layers to the surface. Over the past 15 years, we’ve experienced more La Niñas than El Niños, which helped temporarily slow the warming of global surface temperatures.
That changed in 2015, which has seen the third-largest surface temperature warming influence from an El Niño event on record (behind 1998 and 1987). The chart below breaks down global surface temperature data into years with El Niño, La Niña, neutral, and volcanic eruption temperature influences. Click here for additional details and a larger version.
NOAA global surface temperature data (1966–2015) broken into El Niño (red), La Niña (blue), neutral (black), and volcanic eruption (orange) years with linear trends for each category. Created by Dana Nuccitelli.
As the chart shows, 2015 will be more than 0.2°C hotter than 1998, despite having a slightly weaker El Niño warming influence. That temperature difference is the result of human-caused global warming. If we look at the temperature trends just for El Niño years, for La Niña years, and for neutral years, each has a trend of 0.15–0.17°C global surface warming per decade since the 1960s. The years during the mythical “pause” fall right along the long-term trend lines for each category (e.g. the blue points are consistently near the blue trend line).
This tells us that the long-term global warming trend persists, and it was only temporarily slowed because of the prevailing La Niña conditions from 1999 to 2012. In short, La Niña years in the 2000s have been hotter than previous La Niña years because of continued global warming, but they’re cooler at the surface than recent El Niño and neutral years.
We’ve now seen a new global surface temperature record in four of the past 11 years (2005, 2010, 2014, and 2015). This is consistent with a 2011 paper by climate scientists Stefan Rahmstorf and Dim Coumou, who found that as global warming continues, we should expect to set new records about once every four years.
Indeed, if we only use the data of the past 30 y, these show an almost linear trend of 0.017°C/y, yielding an expected 2.5 new record hot temperatures in the last decade [1 per 4 years].
The oceans have continued to accumulate a tremendous amount of heat as well.According to NOAA, in 2015 the oceans have accumulated an amount of heat equivalent to about 400 million atomic bomb detonations (27 zettajoules, or 27 billion trillion Joules). That means the Earth accumulated about 14 atomic bomb detonations of energy per second, on average, throughout 2015. That’s a lot of heat, likewise reaching record levels.
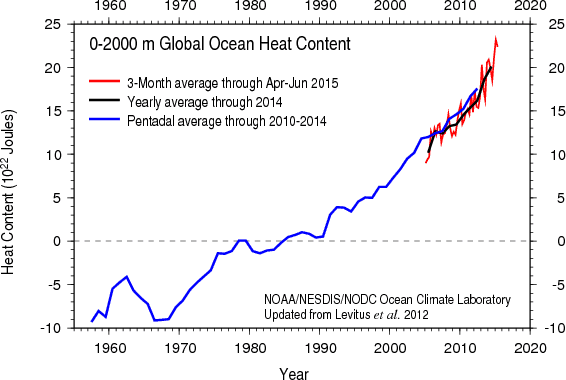
Global ocean heat content estimates from NOAA, 0–2000 meters.
Help us do science! we’ve teamed up with researcher Paige Brown Jarreau to create a survey of Skeptical Science readers. By participating, you’ll be helping me improve SkS and contributing to SCIENCE on blog readership. You will also get FREE science art from Paige's Photography for participating, as well as a chance to win a t-shirt and other perks! It should only take 10-15 minutes to complete. You can find the survey here: http://bit.ly/mysciblogreaders. For completing the survey, readers will be entered into a drawing for a $50.00 Amazon gift card, as well as for other prizes (i.e. t-shirts).
Posted by dana1981 on Wednesday, 18 November, 2015
 |
The Skeptical Science website by Skeptical Science is licensed under a Creative Commons Attribution 3.0 Unported License. |