Congressman Lamar Smith (R-TX) has embarked upon a witch-hunt against climate scientists at NOAA, accusing them of conspiring to fudge global temperature data. However, a new study has found that the adjustments NOAA makes to the raw temperature data bring them closer to measurements from a reference network of pristinely-located temperature stations.
Before delving into the new study, it’s worthwhile to revisit the temperature adjustments that Lamar Smith disputes. Volunteers have been logging measurements from weather stations around the world for over 150 years, and climate scientists use that data to estimate the Earth’s average surface temperature. But over a 150-year period, things change, as the authors of this study explain.
Stations have moved to different locations over the past 150 years, most more than once. They have changed instruments from mercury thermometers to electronic sensors, and have changed the time they take temperature measurements from afternoon to morning. Cities have grown up around stations, and some weather stations are not ideally located. All of these issues introduce inconsistencies into the temperature record.
To find out how much actual temperatures have changed, scientists have to filter out these changes in the way the measurements were taken. Those are the adjustments under attack from Lamar Smith. They’re important, scientifically justified, and documented in the peer-reviewed literature.
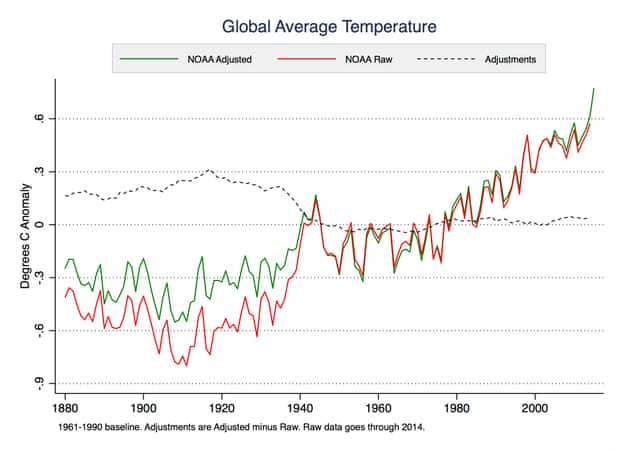
Scientists make adjustments to account for changes in the way both land and ocean temperature measurements have been made over the past 150 years. The ocean adjustments make the biggest difference, and in fact they actually reduce the measured amount of global surface warming over the past century, as compared to the raw data. Thus you would think contrarians like Lamar Smith would appreciate these adjustments; however, over the past couple of decades, they act to very slightly increase the overall global surface warming trend.
NOAA adjusted (green) and raw data (red). The dashed black line shows the difference created by the adjustments. Illustration: Zeke Hausfather
Climate contrarians who oppose taking action to slow global warming have focused their arguments on the past 18 years, during which time the warming of surface temperatures temporarily slowed down (it’s now speeding back up). The latest version of the NOAA method to adjust the temperatures made the slowdown a little smaller, and that didn’t sit well with those contrarians.
Lamar Smith soon began making conspiratorial accusations and demanding NOAA scientists’ emails. Last week, he convened a hearing in the House Science Committee and claimed, with no supporting evidence or basis in reality,
An example of how this administration promotes its suspect climate agenda can be seen at the National Oceanographic [sic] and Atmospheric Administration. Its employees altered historical climate data to get politically correct results in an attempt to disprove the eighteen year lack of global temperature increases.
NOAA conveniently issued its news release that promotes this report just as the administration announced its extensive climate change regulations.
The new study published in Geophysical Research Letters by Zeke Hausfather of Berkeley Earth, Kevin Cowtan at the University of York, and Matthew Menne and Claude Williams Jr. at NOAA, set out to test how well the adjustments are working. Contrarians’ biggest complaints focus on urban heat sources near land temperature stations, and scientists’ adjustments to remove that urban heat contamination.
To check how well those particular adjustments work, NOAA set up a network of pristinely located temperature stations across the USA that they could use as a reference. The authors of the study explain:
To help resolve uncertainties caused by reliance on the historical network, NOAA began setting up a U.S. Climate Reference Network starting in 2001. The Climate Reference Network includes 114 stations spaced throughout the U.S. that are well sited and away from cities. They have three temperature sensors that measure every two seconds and automatically send in data via satellite uplink. The reference network is intended to give us a good sense of changes in temperatures going forward, largely free from the issues that plagued the historical network.
With more than a decade’s worth of this pristine reference data available, the study authors were able to compare it to the raw and adjusted data. The US land temperature adjustments have the biggest impact on the trend from the 1950s to 1990s, because that’s when there were changes in the time of day at which the measurements were recorded, and in the technology used to take the temperatures.
The authors found the adjustments don’t have any significant effect on the average temperature or warming trend since 2004. Lead author Zeke Hausfather explained,
Over the last decade there are plenty of issues with the raw data, but they tend to roughly cancel out in their trend effects.
The study showed that the averaged raw and adjusted US land temperature data are both very close to the pristine reference data during that period of 2004–2015.
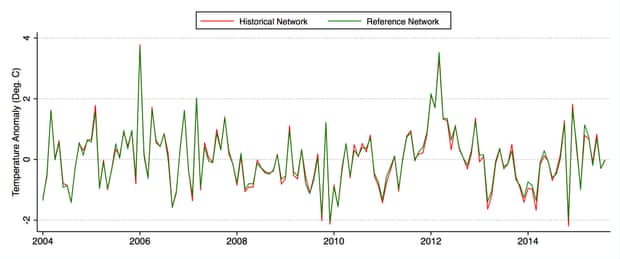
Comparison of monthly average adjusted USHCN (historical network of adjusted data) and USCRN (reference network) temperatures between January 2004 and October 2015. Illustration: Hausfather et al. (2016), Geophysical Research Letters
However, while they don’t have much effect on the average US land temperature trend since 2004, the authors found that the adjustments bring the data from individual stations closer to their nearby pristine reference measurements.
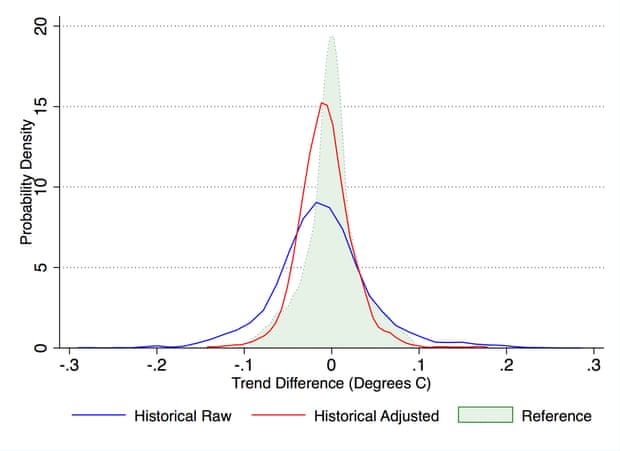
Comparison of the distribution of temperature trend differences between proximate raw (blue), adjusted (red), and reference network (green) station pairs. If the raw or adjusted data had identical trends to the reference network, they would match the green shaded area perfectly. Illustration: Hausfather et al. (2016), Geophysical Research Letters
In short, NOAA’s adjustments are doing what they’re supposed to do – removing biases in the raw data to make it more accurately reflect the true temperature changes at each measurement station. As lead author Zeke Hausfather told me,
Posted by dana1981 on Monday, 8 February, 2016
 |
The Skeptical Science website by Skeptical Science is licensed under a Creative Commons Attribution 3.0 Unported License. |