
January gave us yet another record anomaly in the GISS data, coming in at 1.13C. If we apply this to our preindustrial baseline that puts the monthly anomaly at 1.382C. (Click here for a full size version of the graph below.)
While we're clearly seeing a strong El Nino signal in the surface station data, the satellite data continues to lag. On my chart tracking the current El Nino compared to the 1997/98 El Nino I've decided to try switching to the RSS data. There's not a lot of difference between the two and I'm continuing to track both data sets. (Full size image here.)
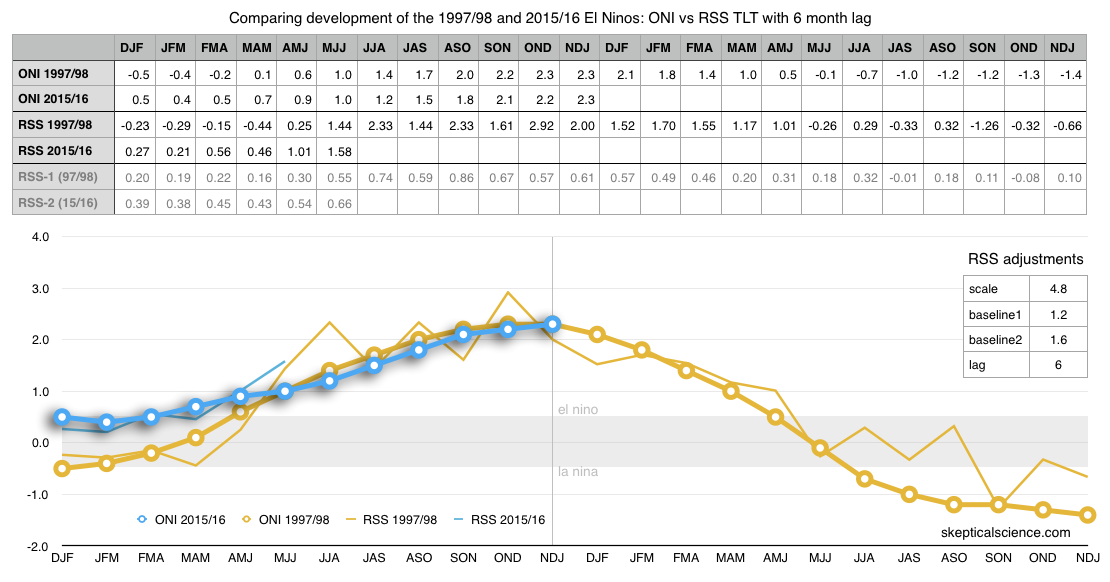
Best guess from these comparisons suggest that it's likely the anomaly for satellite data will exceed that of 1998 before all is said and done. It also seems likely the peak in the satellite record is still about 5 months away. We should have a good idea how the satellite data responded to the El Nino sometime around June of this year.
Posted by Rob Honeycutt on Wednesday, 17 February, 2016
 |
The Skeptical Science website by Skeptical Science is licensed under a Creative Commons Attribution 3.0 Unported License. |