We occasionally receive excellent questions and/or comments by email or via our contact form and have then usually corresponded with the emailer directly. But, some of the questions and answers deserve a broader audience, so we decided to highlight some of them in a new series of blog posts.
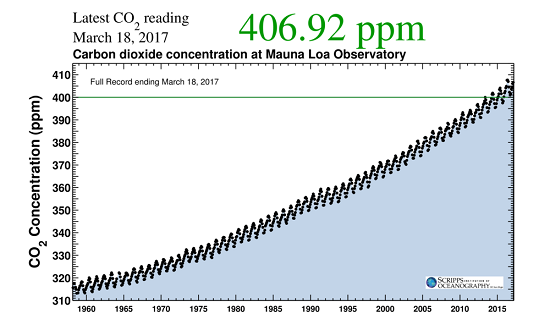
The Keeling Curve (Figure 1) is one of the most iconic graphs illustrating modern climate change. Since 1958, the Keeling Curve has shown the increase in atmospheric CO2 from about 315 ppm to the present value of 405 ppm. CO2 measurements at Mauna Loa are taken hourly so this record has a very high time-resolution and is remarkably complete, even though there are occasional short gaps in the record.
Figure 1. The Keeling Curve. Source: https://scripps.ucsd.edu/programs/keelingcurve/
Another iconic graph shows CO2 concentrations going back 800,000 years through eight of the Earth's ice age cycles (Figure 2). Our sudden anthropogenic CO2 spike is almost literally "off the charts" compared to the rest of the ice ages record. At no time during the last 800,000 years has there been any comparable increase in CO2 concentrations.
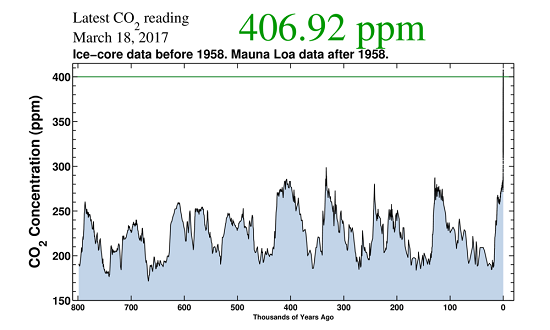
Figure 2. CO2 levels through 800,000 years and 8 ice ages and the Keeling Curve "spike" on the right. Source: https://scripps.ucsd.edu/programs/keelingcurve/
One of our readers (I'll call him A.B.) sent us an email asking about the time-resolution of the ice ages graph and how it compares to the resolution in the Keeling Curve:
Is there some study or dataset that shows the ice core samples with the same time resolution we see in modern measurements of CO2 such as the Keeling Curve; so that we can know for sure if there were any large-amplitude spikes of CO2 at earlier times (back to ~800 k yrs BP)?
The ice ages graph comes from measurements of CO2 in air bubbles trapped in ice cores drilled from the Antarctic ice sheets. These cores often have annual layers so it would be theoretically possible to get yearly samples of CO2, although the deeper (oldest) portions of the cores are vertically compressed, making the layers extremely thin. Still, even if all the annual layers were preserved, I doubt that scientists would sample all 800,000 layers (!) to produce such a high-resolution record. Surely, that would be overkill. I thought a CO2 sample taken every 10 or 20 or perhaps even 50 years would be high-res enough to get a good record of any fast changes in CO2 concentration, and would show any sudden spike like our current anthropogenic rise to 400 ppm.
NOAA has a helpful webpage which points to Ice Core Data by Location.* Browsing through the list of Antarctic data I found a number of "high resolution" studies such as this one which only goes back about 22,000 years (Monnin et al. 2004). Figure 3 is a screenshot of this page which lists the data from the top of the EPICA Dome C core. The time-resolution jumps around a lot (the Age column), from as little as ~5-10 years between samples to ~100 years between samples. That is close to what I thought would be required to satisfy A.B.'s question, but not quite. The larger concern was that none of the longer ice core records seemed to have even this level of high resolution. The best I could find was a study by Luthi et al. (2008) (data, paper) which had a resolution of about 500 years for the oldest portion of the Dome C ice core.
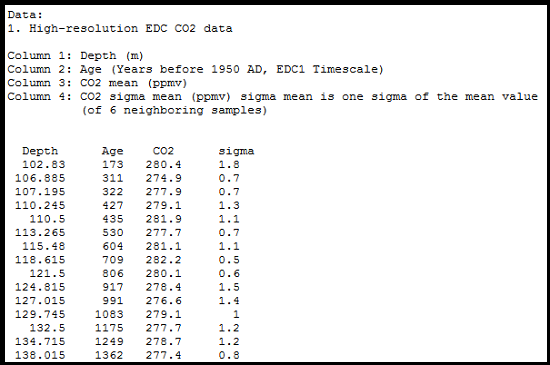
Figure 3. Screenshot of webpage showing data from Luthi et al. (2008).
Luckily, while writing the last "From the eMail Bag" post, I happened upon a scientist who has first-hand knowledge of Antarctica's ice cores, Dr Heidi Roop, who has "a particular interest in highly-resolved (annual to decadal) paleoclimate archives." I emailed her hoping she could point me to some truly high-res ice core data. Unfortunately, through no fault of her own, she could not. But she and some of her collegues did explain why such records are impossible to get from the oldest ice cores.
The great polar ice sheets grow from layers of accumulated snowfall over thousands of years. The deeper layers of snow are slowly pressed into solid ice as more and more snow accumulates (see Figure 4, below). The porous upper layers of snow are called "firn" and range from ~40 - 120 meters deep. Inside the firn layer there is a network of pores (or air pockets) that are still connected to the atmosphere above it (the Convective and Diffusive Zones). At the bottom of the firn the snow is eventually compressed into ice and the air in the pore spaces is enclosed in bubbles and sealed off from further exchange with the atmosphere (the Lock-in Zone). The result is air bubbles which are much "younger" than the ice surrounding them. The age of the gas enclosed in bubbles minus the age of the ice gives us the Δ-age: gas age - ice age = Δ-age.
The firn can be open to the atmosphere for decades to centuries, depending on the local conditions at the ice coring site. At the West Antarctic Ice Sheet Divide (WAIS-Divide) site, which, at -31°C (-24°F), is relatively "warm" (by Antarctic standards at least) and has a lot of snow accumulation, the bubbles close off sooner than at colder sites with less snow accumulation, like Vostok and EPICA Dome C in East Antarctica.
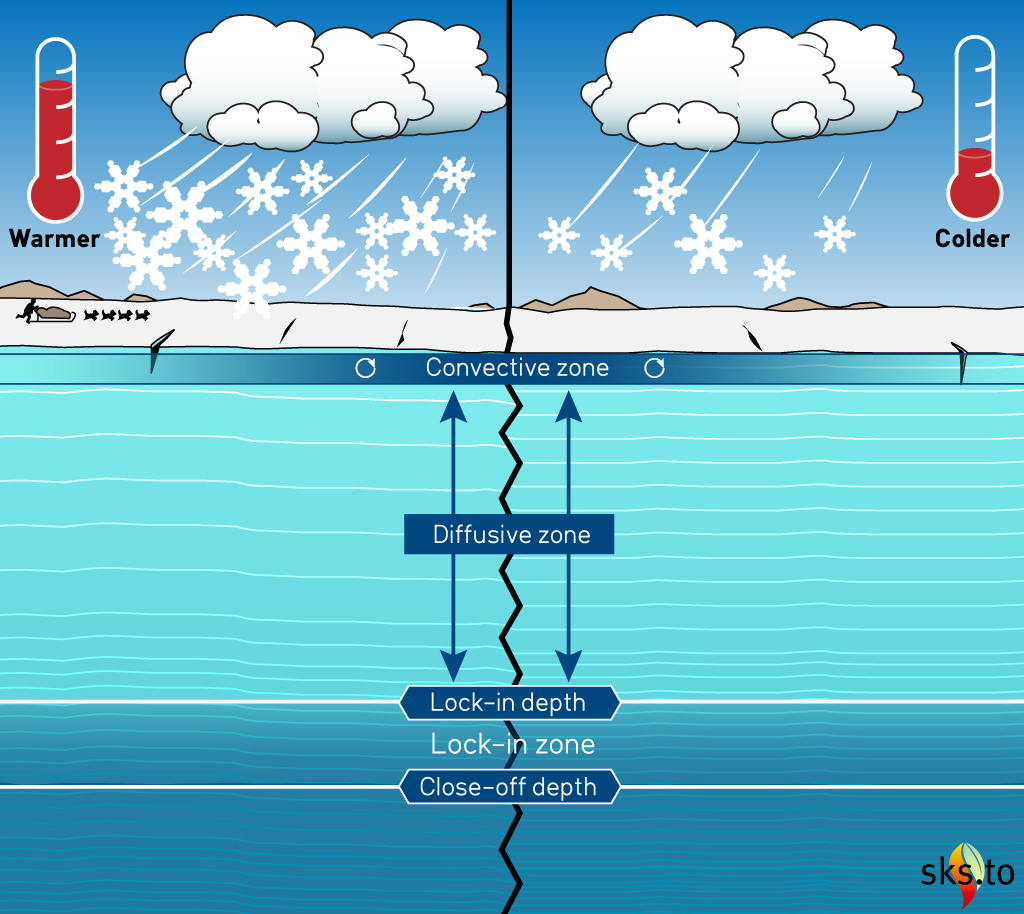
Figure 4. Cross section of firn at a warm, high-snow-accumulation site (left) and a colder, low-accumulation site (right). The depths of firn layers and zones from actual ice core sites vary and are not the same thicknesses at each site as shown in this diagram. Illustration by jg.
Another complicating factor of the firn processes is that the gas in the bubbles does not really have a "single" age. Imagine a site where it takes 100 years from the time of snowfall until the snow reaches the Lock-in Zone trapping the air bubbles. The ice at the close-off depth is 100 years old but how old is the air in the bubbles? The firn was open to the atmosphere for ~100 years so the air in the bubbles could have come from any of those years. The result is an age distribution or range of most probable ages for the air in the bubbles.
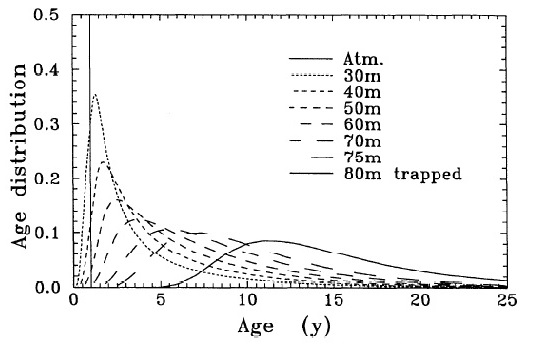
Figure 5. Age distributions of CO2 molecules in the Law Dome DE08 firn from the surface to 75 meters, and in the ice at 80 meters. (Trudinger et al. 1997)
In the graph above the age distribution of the gas in the trapped bubbles (at 80 m deep) ranges from ~5 to ~25+ years wide, but the high point of the curve tells you the most probable age distribution, about 8-15 years wide. This graph is for a site which has very high snow accumulation, but for a site with very low snow accumulation the age distribution would be much broader, perhaps centuries wide.
Once the air is locked into bubbles the age distribution is essentially frozen as they are buried deeper and deeper into the ice sheet. But finding a particular age distribution for a particular bubble is not so straightforward. Scientists calculate age distributions using mathematical models with known firn parameters such as snow accumulation rates, temperature, density of the firn with depth, etc. Finding those known local parameters for modern firn is one thing, but knowing what those conditions were over thousands of years in the past is another.
Luckily, there is a short-cut for finding the age distribution. This is alluded to in a recent paper (Mitchell et al. 2015):
The bubbles are known to close off over a vertical ice age range [the Lock-in Zone] that corresponds to roughly 10% of the gas age-ice age difference, which intuitively should result in a gas age distribution width corresponding to 10% of the gas age-ice age difference [the Δ-age]. However, the observed smoothing of the trapped gas record often appears to be less than would be expected from this rate of gradual bubble closure.
So rather than 10%, a good rule-of-thumb, according to Dr. Christo Buizert, is to take 5% of the Δ-age to find the age distribution.
One more quirk affecting the age distribution is that two processes, diffusive transport of air through the firn pores and bubble close-off in the Lock-in Zone, have different effects on different cores. Spahni et al. (2003), found that these two processes have varying affects on the age distributions depending on site differences. For warm, high-accumulation sites the width of the age distribution is mainly governed by the diffusive mixing. And for colder, low-accumulation sites the width is mainly affected by the bubble close-off process.
So what does all of this mean for the graph of CO2 during the ice ages (Figure 2)? The really deep, really old ice cores reaching back to 800,000 years ago come from sites with very large Δ-ages of thousands of years. The following graph shows various Δ-ages for various ice cores and how these Δ-ages can change slightly over time.
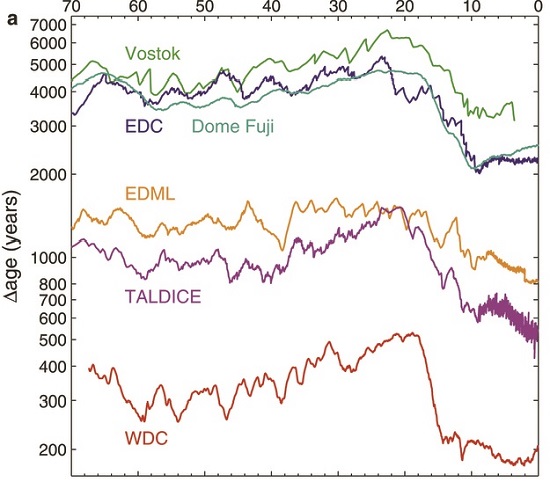
Figure 6. Δ-ages for various Antarctic ice cores. The horizontal axis is in thousands of years. The vertical axis is on a logarithmic scale. Ice core abbreviations: EDC, EPICA Dome Concordia; EDML, EPICA Dronning Maud Land; TALDICE, Talos Dome; WDC, WAIS Divide. From WAIS Divide Project Members (2015). Image.
The oldest cores, from Vostok and EDC (EPICA Dome C), have the largest Δ-ages, ranging around 3000 to 6000 years, so the age-distributions would be around 150 to 300 years wide. This means that a sample of air from a bubble deep in one of these cores would not be from a specific year in the past but from a range of years spanning a few centuries. So it really would not matter if we took samples from each and every annual "layer" in the core (even if that were possible). We could never get that level of high-resolution because of the nature of the way the air is trapped in the ice. Each sample of CO2 from the ice cores is more like a short movie than a snapshot in time.
Samples taken 300 or so years apart should give a fairly fine-grained record of CO2, even with the smoothing caused by the age-distribution. But would that resolution be good enough to show a sudden spike in CO2 comparable to our modern anthro-spike? What about samples spaced further apart, say 500 or 1000 years apart? So just how finely sampled are the ice cores?
While I was learning about age distributions, A.B. located the most up-to-date reconstruction of the 800,000 year record of CO2: Bereiter et al. (2015) Revision of the EPICA Dome C CO2 record from 800 to 600kyr before present. He downloaded the data and made a graph of the time-resolution of the samples, in other words, the length in years between each sample (Figure 7).
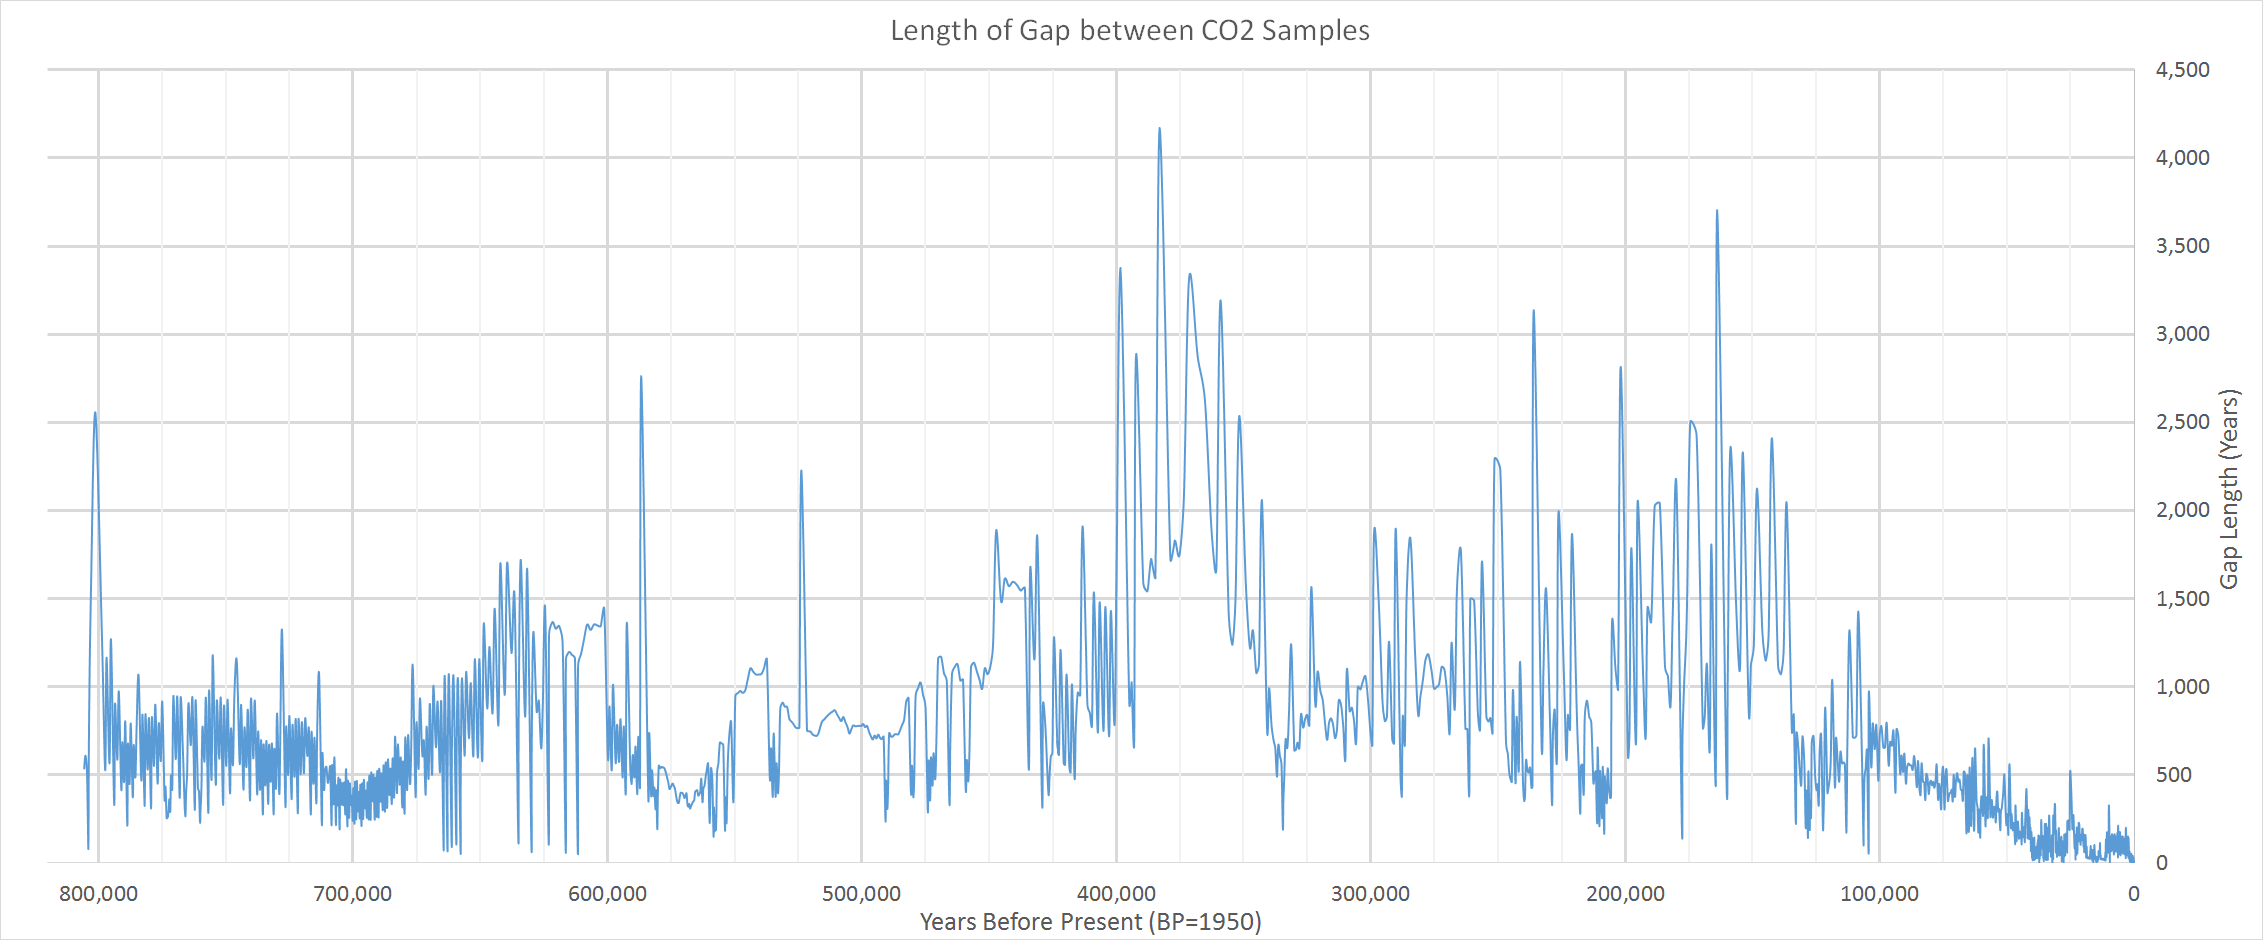
Figure 7. Length of gaps between samples of CO2 taken from ice cores, from Bereiter et al. (2015). Click here for larger image.
The vast majority of gaps between samples is less than 1000 years long (89%), and of these over half are 500 years long or less (65%). There is only one gap over 4000 years long, five gaps from 3000 to 4000 years long, 23 gaps from 2000 to 3000 years long, and 175 gaps from 1000 to 2000 years long. Would any of these millennia-long gaps be long enough to hide a spike in CO2 similar to our modern spike?
I put this question to Dr. Buizert who answered: "The possibility of a 50-year spike in CO2 up to 400 ppm (like the present one) during the last 800,000 years is vanishingly small, but admittedly not zero." The main reason for this is the nature of the carbon cycle, Dr. Buizert again:
CO2 has a long lifetime in the climate system of several thousands of years. Emitting CO2 like we're doing today can build up CO2 relatively fast in the atmosphere, but removing it again is a much slower process that involves chemical weathering of silicate rock and remineralization in the ocean...So given our understanding of the carbon cycle, a 50-year spike of 400 ppm CO2 is an impossibility. The CO2 cannot be removed fast enough, and
inevitably the CO2 spike would persist for thousands of years, making it easily detectable with the ice core CO2 records that we do have.
Dr. David Archer's work (Archer et al. 2009) has shown that our current spike in CO2 will last for millennia. Even though the majority of the CO2 is absorbed by the oceans in the first ~500 years after a spike occurs, it takes 2 to 7 thousand years for the earth to absorb the rest of the spike. If such a spike had occurred during one of the longest gaps in the ice core record the measurements after the gap would be skewed higher.
Also, Dr. Buizert pointed out that even if such a spike did occur during one of these gaps there would have been "profound climatic consequences...and no evidence for this has been found in any climate archive (ice core or otherwise)."
Finally, Dr. Buizert notes:
Last, I think one could make the argument of large numbers. Between all ice core records, we have probably around 4000 data points of past CO2 concentrations - although admittedly, some of those records replicate one another. If such hypothetical 50-year spikes could indeed occur (despite the carbon-cycle arguments), we must have been incredibly unlucky not to hit at least one of them.
Through the last eight ice age cycles atmospheric CO2 levels ranged from lows of ~175-200 ppm during the depths of each ice age, to highs of ~250-280 ppm during the warm interglacials. The magnitude of each of these variations was roughly a 90 ppm change in CO2 levels. These changes occurred over thousands, even tens of thousands, of years. The modern Keeling Curve shows a CO2 rise from ~315 ppm to ~405 ppm, or a 90 ppm increase (equal to the ice-ages variation), in only ~50 years. And if we consider the full length of our current spike, which began ~150 years ago from ~280 ppm, then we have a 125 ppm increase in CO2. In just a few more decades, if we continue to emit CO2 at current rates, we should reach the ~460 ppm mark which would bring us to a 180 ppm increase over pre-industrial levels—twice the natural range of variability seen in the ice age cycle. Such a sudden spike has never been recorded in ice cores from Greenland and Antarctica. Human emissions of CO2 are clearly unprecedented.
Thanks to Drs Heidi Roop, Peter Neff, and Christo Buizert for helping answer A. B.'s questions.
*Note about the NOAA webpage on Ice Cores. When I first started researching this topic the NOAA Ice Core Data by Location page linked directly to an individual study's data but sometime in February all of the links started going to this page: NOAA Paleo Data Search. This is not quite as helpful since you need to enter search terms but you eventually can find what you are looking for.
Bender et al. (2006) - Bender, M. L., Floch, G., Chappellaz, J., Suwa, M., Barnola, J. M., Blunier, T., ... & Parrenin, F. (2006). Gas age–ice age differences and the chronology of the Vostok ice core, 0–100 ka. Journal of Geophysical Research: Atmospheres, 111(D21). Link to paper.
Buizert (2013) - Buizert C. (2013) Studies of Firn Air. In: Elias S.A. (ed.) The Encyclopedia of Quaternary Science, vol. 2, pp. 361-372. Amsterdam: Elsevier. Link to Abstract.
Etheridge et al. (1996) - Etheridge, D. M., Steele, L. P., Langenfelds, R. L., Francey, R. J., Barnola, J. M., & Morgan, V. I. (1996). Natural and anthropogenic changes in atmospheric CO2 over the last 1000 years from air in Antarctic ice and firn. Journal of Geophysical Research: Atmospheres, 101(D2), 4115-4128. Link to paper.
Marcott et al. (2014) - Marcott, S. A., Bauska, T. K., Buizert, C., Steig, E. J., Rosen, J. L., Cuffey, K. M., ... & McConnell, J. R. (2014). Centennial-scale changes in the global carbon cycle during the last deglaciation. Nature, 514(7524), 616-619. Link to paper.
Rommelaere et al. (1997) - Rommelaere, V., Arnaud, L., & Barnola, J. M. (1997). Reconstructing recent atmospheric trace gas concentrations from polar firn and bubbly ice data by inverse methods. Journal of Geophysical Research: Atmospheres, 102(D25), 30069-30083. Link to paper.
Schwander et al. (1993) - Schwander, J., Barnola, J. M., Andrié, C., Leuenberger, M., Ludin, A., Raynaud, D., & Stauffer, B. (1993). The age of the air in the firn and the ice at Summit, Greenland. Journal of Geophysical Research: Atmospheres, 98(D2), 2831-2838. Link to abstract.
Siegenthaler et al. (2005) - Siegenthaler, U., Stocker, T. F., Monnin, E., Lüthi, D., Schwander, J., Stauffer, B., ... & Jouzel, J. (2005). Stable carbon cycle–climate relationship during the late Pleistocene. Science, 310(5752), 1313-1317. Link to paper.
Trudinger et al. (2002) - Trudinger, C. M., Etheridge, D. M., Rayner, P. J., Enting, I. G., Sturrock, G. A., & Langenfelds, R. L. (2002). Reconstructing atmospheric histories from measurements of air composition in firn. Journal of Geophysical Research: Atmospheres, 107(D24). Link to paper.
Trudinger et al. (2003) - Trudinger, C. M., Rayner, P. J., Enting, I. G., Heimann, M., & Scholze, M. (2003). Implications of ice core smoothing for inferring CO2 flux variability. Journal of Geophysical Research: Atmospheres, 108(D16). Link to paper.
Posted by David Kirtley on Tuesday, 11 April, 2017
 |
The Skeptical Science website by Skeptical Science is licensed under a Creative Commons Attribution 3.0 Unported License. |