Greenhouse gases (GHG) determine amount of warming, but oceans delay the warming.
To see how the oceans delay warming of the atmosphere, try the following thought experiment.
The longer time it takes to heat the pot of water than a pot of air explains why there is a delay between GHG emissions and a rise in temperature of the atmosphere: the oceans absorb a lot of heat, requiring a long time to heat up. This is why scientists such as James Hansen refer to global warming as an inter-generational issue, because the heating due to our emissions are only fully felt by the next generation, due to the time lag created by the oceans.
The earth is covered mostly in water. The large heat capacity of the oceans mean they soak up a lot of energy and slow down the heating of the atmosphere. Just how long is the delay between the time we inject CO2 and other GHG's into the atmosphere and when the effect is felt? The CO2 concentration is like the burner setting in the above example: more CO2 is like a higher burner temperature. However, even though turning up the heat creates hotter water, it takes a while for the water to heat up.
We can estimate the final temperature the atmosphere will reach for a given CO2 concentration by using the average IPCC estimate of 3°C warming for doubling CO2 concentration (this is called the “climate sensitivity”). Using the estimate of pre-industrial CO2 concentration of 280 ppm (parts per million), a climate sensitivity of 3°C implies that CO2 concentrations of 350, 440, and 560 ppm yield 1, 2, and 3°C warming, respectively. Using this estimate of climate sensitivity together with measurements of CO2 from 1970 to today, we can estimate the warming that has been locked in due to recent CO2 emissions. That is, knowing the burner setting, we can estimate the final temperature of the pot of water, even though we will have to wait some time for it to heat up.
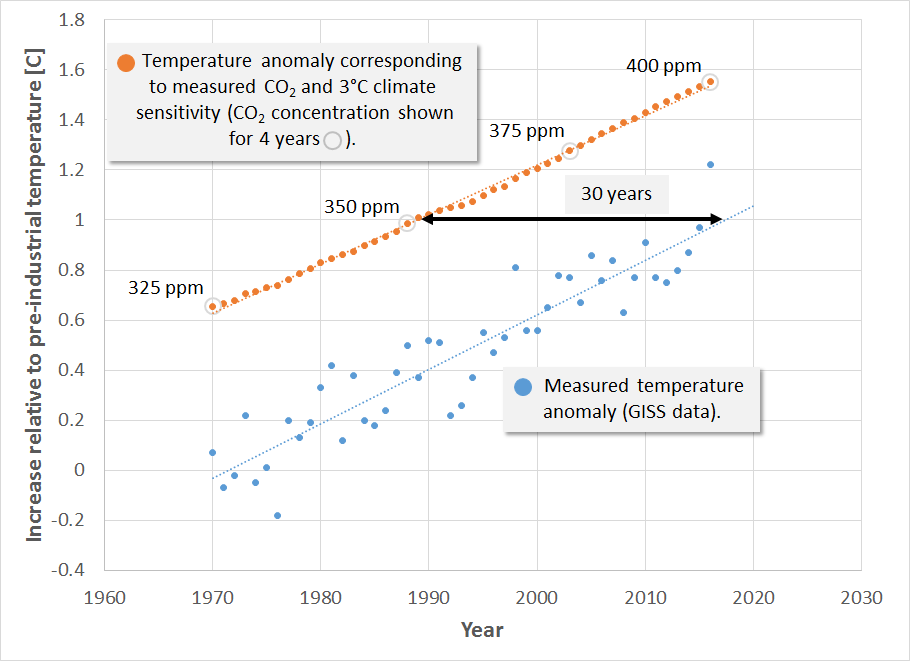
We also use the GISS (Goddard Institute for Space Studies) data to plot measured global mean temperature above preindustrial to estimate the time lag between the temperature anomaly suggested by a particular CO2 concentration and the time when that temperature is observed. This and CO2 concentrations for 4 selected years are shown in the following figure.
This figure therefore shows the temperature anomaly starting in 1970, the year when the temperature increase due to greenhouse gases began to emerge from the background noise. This figure indicates 3 things: (1) the time lag between emitting greenhouse gases and when we see the principle effect is about 30 years, due mostly to the time required to heat the oceans, (2) the rate of temperature increase predicted by a climate sensitivity of 3°C tracks well with the observed rate of temperature increase, and (3) we have already locked in more than 1.5°C warming. As of 2017 we have reached 406 ppm CO2. At the current increase of 2 ppm CO2/yr., this implies that we will reach 440 ppm and lock in 2°C warming by 2035 … if we don’t act now.
So whereas the experiment at home with a pot of water on low heat yields a time lag of something like 10’s of minutes to heat the water, to heat an Earth-sized pot of water the time lag is about 30 years.
What this figure does not show, however, is that as other complex feedback mechanisms kick in, the rate of warming may begin to exceed the IPCC average climate sensitivity. Therefore, for future trends, this plot likely represents the minimum temperature increase that we can expect for a given CO2 concentration.
Posted by Evan on Thursday, 18 May, 2017
 |
The Skeptical Science website by Skeptical Science is licensed under a Creative Commons Attribution 3.0 Unported License. |