Did Global Warming stop in 1998, 1995, 2002, 2007, 2010?
A common claim, made by those who deny man-made global warming, is that the Earth has been cooling recently. 1998 was the first year claimed by 'skeptics' for "Global Cooling". Then 1995 followed by 2002. 'Skeptics' have also emphasized the year 2007-2008 and most recently the last half of 2010.
NASA and climate scientists throughout the world have said, however, that the years starting since 1998 have been the hottest in all recorded temperature history. Do these claims sound confusing and contradictory? Has the Earth been cooling, lately?
To find out whether there is actually a "cooling trend" it is important to consider all of these claims as a whole since they follow the same pattern. In making these claims, 'skeptics' take short periods of time, usually about 10 years or less, out of context ("Cherry picked.") from 30 years of evidence; the minimum needed to make a valid judgment.
'Skeptics' also take selected areas of the world where cold records for the recent past are being set while ignoring other areas where all time heat records are being set.
The temperature chart below is based on information acquired from NASA heat sensing satellites. It covers a 30 year period from January 1979 to November 2010. The red curve indicates the average temperature throughout the entire Earth.
The red line represents the average temperature. The top of the curves are warmer years caused by El Niño; a weather phenomenon where the Pacific Ocean gives out heat thus warming the Earth. The bottoms of the curves are usually La Niña years which cool the Earth. Volcanic eruptions, like Mount Pinatubo in 1991 will also cool the Earth so they are not counted. Although they are affected by Global Warming, El Niños and La Niñas occur whether or not there is Global Warming.

Figure 1: University of Alabama, Huntsville (UAH) temperature chart from January 1979 to November 2010. This chart is shown with no trend lines so the viewer may make his own judgment.
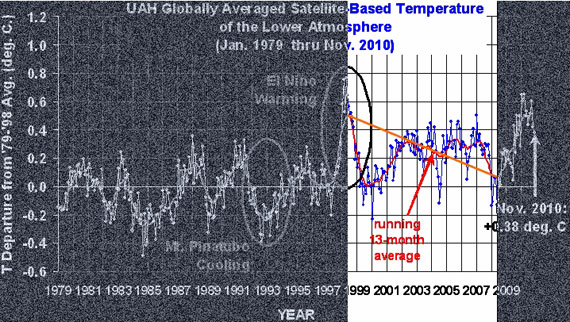
Below is the same temperature chart, showing how 'skeptics', manipulate the data to give the impression of 'Global Cooling'. First, they choose the warmest most recent year they can find. Then, in this case, they exclude 20 years of previous temperature records. Next, they draw a line from the warmest year (The high peak.) to the lowest La Niña they can find. In doing this they falsely give the impression that an ordinary La Niña is actually a cooling trend.

Figure 2: Representation of how 'skeptics' distort the temperature chart. Even though the chart clearly indicates increased warming, 'skeptics' take small portions of out of context to claim the opposite.
What do the past 30 years of temperature data really show? Below is the answer.

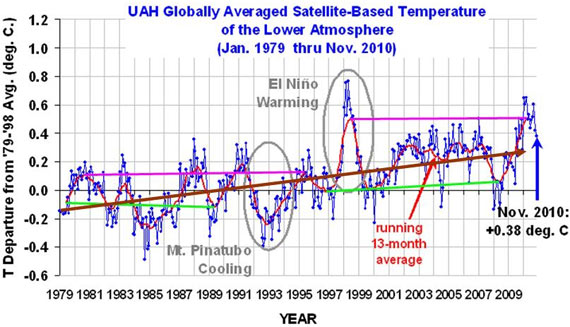
Figure 3: Trend lines showing the sudden jump in temperatures in the 1995 La Niña (Green lines) and the 1998 (Pink lines) El Niño events. Brown line indicates the overall increase in temperatures.
The chart above clearly shows that temperatures have gone up. They are, however, not going up in a steady curve as most people would expect. They are, instead, rising in a staircase fashion. That means they can remain flat for a few years and then suddenly jump up. Then once more they flatten out only jump up again a few years later.
When temperatures for the warm El Niño years (Pink lines) during 1980-1995 are compared to 1998-2010, there is a sudden increase of at least 0.2o Centigrade (0.36o Fahrenheit). Temperatures also jumped up by about 0.15oC (0.27oF) between the cool La Niña years (Green lines) of 1979-1989 and those of 1996-2008 (the eruption of Mount Pinatubo in 1991 lowered the Earth's temperatures in the midst of an El Niño cycle).The overall trend from 1979 through November 2010 (Brown line) shows an unmistakable rise.
While these increases do not sound like much they are more than enough to disrupt weather systems and cause severe damage to crops and human populations.
In spite of these facts, 'skeptics' simply keep changing their dates for 'Global Cooling'.
Posted by villabolo on Monday, 27 December, 2010


