NOTE: This is the second article of a five-part series on what we can learn from the Last Interglacial time period. Understanding this period may provide clues on how the environment may respond to similar conditions in the future. In the first post, we described the conditions that exisited during the Last Interglacial. In this post, we we examine two of the key factors that caused the conditions described in the first post.
In the previous installment of this series on the Last Interglacial; also known as the Eemian in Europe, we learnt that it was a period that was warmer and wetter, with smaller ice sheets and higher global sea level. Three of the the key factors in determining the conditions that existed during the Last Interglacial are:
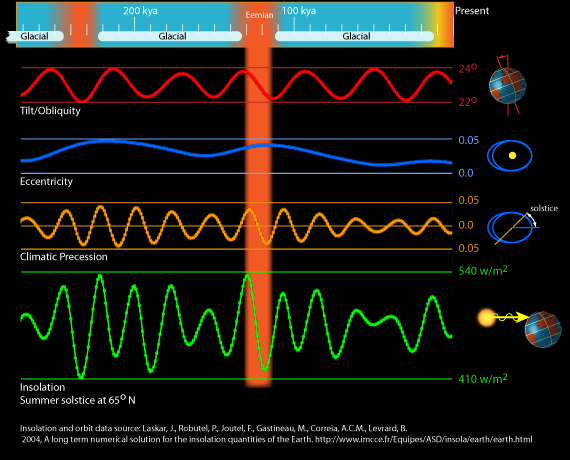
The IPCC Assessment Report 4 describes palaeoclimatic proxy evidence from the Last Interglacial, which estimates that the largest warming then was in northern Greenland and Eurasia of ~3 to 5oC, though some individual sites may have been even warmer. Models have determined that much, if not all this warming can be explained by increased insolation from orbital forcing as the Earth travels around the Sun, shifts its axial tilt and changes the amount of eccentricity in its orbit in regular cycles; effectively acting like a long-term climate pacemaker. In itself, this additional warming from the Sun is too small and too regional to fully explain all the observed warming during the period. It's likely that lowered albedo, increasing CO2 and other carbon feedbacks have amplified this warming from the orbital pacemaker.
For the first half of the Last Interglacial (~130 to 123 Ka) orbital forcing produced a large increase in summer Northern Hemisphere insolation (IPCC AR4). The orbital eccentricity was higher, giving a more elliptical orbit. The effects of precession, a wobbling of Earth's axis of rotation, on insolation was also more pronounced. These warm conditions lasted around 11,000 years (Muller, 2009) and summer insolation at 65oN was at a maximum at 126 ka (Berger 1978, as described in Born et al., 2009). Modelling studies using Last Interglacial orbital parameters determined that precession was the main contributor to climatic change during the period. Kaspar et al (2005) compared temperature proxy reconstructions with results from an Atmosphere-Ocean General Circulation Model utilizing greenhouse gas concentrations and orbital parameters to simulate climate at ~125 ka. The model results were consistent with the temperature proxy reconstructions and indicated that the differences in orbital parameters compared to today were sufficient to explain the higher temperatures over most parts of Europe in summer. They argue that greater axial tilt and eccentricity of orbit, together with perihelion, Earth's closest approach to the Sun, happening during summer in the Northern Hemisphere, amplified seasonal insolation at 125 ka. However, Muhs et al. (2002), from a study of past sea-levels using Hawaiian coral dating found a much longer Last Interglacial period from ~136 to 115 ka., they argue that this indicates that orbital forcing could not be solely responsible for maintaining warm temperatures throughout the period.
A variety of temperature proxy reconstructions suggest mean annual temperatures up to 4oC higher than today in northern Europe, northern latitudes of North America, and northern Asia. The mean annual temperature rose up to 2oC higher in central Europe and the mid-latitudes of North America and Asia. In lower latitudes the mean annual temperature was similar to the present day. This means that the temperature gradient between northern latitudes and the equator would have been lower during the climatic optimum of the Last Interglacial, possibly due to variations in the angle of tilt of the Earth's axis. During the early part of the Last Interglacial (~130 to 126 ka), this axial tilt was higher, which provided stronger insolation at high latitudes and weaker insolation at low latitudes. Another difference is that perihelion occurs during Northern Hemisphere winter today, but during Northern Hemisphere summer in the early part of the Last Interglacial (Muller, 2009).
At 130 to 127 ka, the mean temperature of the warmest month in the East Siberian Arctic was estimated to be 4 to 5oC higher than present, mainly due to insolation being 13% higher than today. This high mean temperature in the Arctic cannot be explained solely by increased insolation, but may have been affected by feedback effects from lower albedo due to reforestation and reduced sea-ice cover (Kienast et al., 2007).
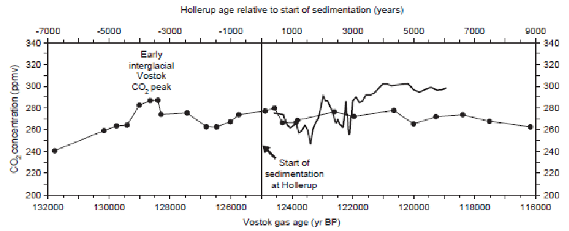
Reconstructed atmospheric CO2 levels for the first 7,400 years of the Eemian were derived from stomatal index data obtained from tree leaves in a lake sediment section from Hollerup in Denmark. Stomata play a role in plant respiration and their density can provide an estimate of atmospheric CO2. Rundgren et al. (2004) found that CO2 varied between 250 to 290 ppmv, with the remainder of the record more stable around 290 to 300 ppmv, which can be compared to the atmospheric CO2 at the preceding glacial maximum of ~190 ppmv (Broecker 1998) and more than 390 ppmv today.

The most important terrestrial controls of climate relate to albedo effects and changes in land surface, which determine the reflectivity of the Earth and how much energy from the Sun can be absorbed. For example, reduction in ice-sheet extent can expose lower albedo soil, rock and vegetation, which enhances surface warming. There was less glacial ice on Earth during the Last Interglacial compared to the present day, which suggests a significant reduction in the size of the Greenland and Antarctic Ice Sheets (IPCC AR4). This would support the view that an increase in land area exhibiting a lower albedo might have played some part in increased warming during the Last Interglacial.
Schurgers et al. (2007) performed computer simulations of Eemian climate to determine the effect of land surface changes. They found that the main influence on climate was related to changes in the albedo. In the Northern Hemisphere high-latitudes this was partially due to the albedo effect of the conversion of grasses to forest, with the indirect effect of forests on snow albedo being the major factor affecting absorption of total solar irradiation. Large changes in surface albedo occurred in the western Sahara due to the appearance of vegetation between 128 and 120 ky.
Research by CAPE-Last Interglacial Project Members (2006), suggests the 4 to 5oC warming in the Arctic was the result of positive feedbacks from the intensification of the North Atlantic Drift bringing warm water from the Gulf Stream poleward and albedo efects from the reduction in sea-ice extent and the expansion of forests into Arctic regions. These factors all enhanced the summer insolation forcing. Greater coverage of vegetation during the summer potentially led to further warming through feedback effects of enhanced evapotranspiration and lower albedo (Klotz et al., 2003).
Today, we are observing a reduction in sea-ice and ice-sheet volume as a result of a warming climate, especially in the Arctic. This ice melt and thermal expansion of seawater is creating an observable increase in global sea-level. How did the warming of the Last Interglacial climate affect ice melt and sea-level rise? We'll answer this question in Part 3 of this series on the Last Interglacial Climate....
Posted by Steve Brown on Wednesday, 6 July, 2011
 |
The Skeptical Science website by Skeptical Science is licensed under a Creative Commons Attribution 3.0 Unported License. |