
Figure 1: Hansen's model projections (green, blue, purple) compared to observations (red and black).
What The Science Says:
Weather is chaotic, making prediction difficult. However, climate takes a long term view, averaging weather out over time. This removes the chaotic element, enabling climate models to successfully predict future climate change.
Climate Myth: Scientists can't even predict weather
...Since modern computer models cannot with any certainty predict the weather two weeks from now, how can we rely upon computer models to predict what the Earth's climate might be like a hundred years from now? They can't! Yet people like Al "Carbon-Credit" Gore want you to believe that these models can predict the future. I bet I can do at least as well with a crystal ball (source: Kowabunga)
This argument betrays a misunderstanding of the difference between weather, which is chaotic and unpredictable and climate which is weather averaged out over time. While you can't predict with certainty whether a coin will land heads or tails, you can predict the statistical results of a large number of coin tosses. Or expressing that in weather terms, you can't predict the exact route a storm will take but the average temperature and precipitation will result the same for the region over a period of time.
Climate prediction is a difficult and ever refining art. There's the problem that future behaviour of the sun is very difficult to predict. Similarly, short term perturbations like El Nino or volcanic eruptions are difficult to model. Nevertheless, climate scientists have a handle on the major drivers of climate.
Way back in 1988, James Hansen projected future temperature trends (Hansen et al. 1988). Those initial projections show remarkable agreement with observation right to present day (Hansen et al. 2006). Hansen even speculated on a volcanic eruption in 1995 but missed the date by a few years (we'll cut him some slack there).
Figure 1: Hansen's model projections (green, blue, purple) compared to observations (red and black).
Hansen's Scenario B (described as the most likely option and in hindsight, the one that most closely matched the level of CO2 emissions) shows close correlation with observed temperatures. In fact, Hansen overestimated future CO2 levels by 5 to 10% so if his model was given the correct forcing levels, the match would be even closer. There are deviations from year to year but this is to be expected. The chaotic nature of weather will add noise to the signal but the overall trend is predictable.
When Mount Pinatubo erupted in 1991, it provided the opportunity to test how successfully models could predict the climate response to the sulfate aersol injected into the atmosphere. The models accurately forecast the subsequent global cooling of about 0.5 °C soon after the eruption. Furthermore, the radiative, water-vapor, and dynamical feedbacks included in the models were also quantitatively verified (Hansen et al. 2007).
Figure 2: Observed and simulated global temperature change during Pinatubo eruption. Green is observed temperature by weather stations. Blue is land and ocean temperature. Red is mean model output (Hansen et al. 2007).
Recent Climate Observations Compared to Projections (Rahmstorf et al. 2007) compared 2001 IPCC projections of global temperature change (coloured dotted lines) with observations from HadCRUT (blue) and NASA GISS data (red). The thin lines are the observed yearly average. The solid lines are the long term trends, which filter out short term weather fluctuations.
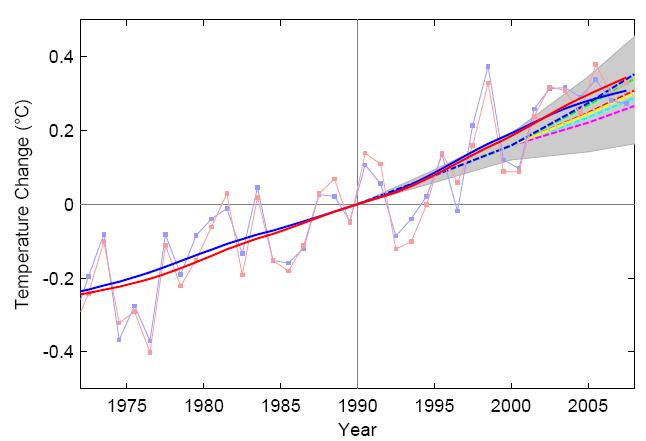 Figure 3: courtesy of Tamino: Solid blue and red lines are trends from GISS and HadCRU data, dashed lines are IPCC projections.
It's immediately apparent the IPCC underestimated temperature rise with observations warmer than all projections (but inside the grey uncertainty area). The paper proposes several possible reasons for the difference. One is intrinsic internal variability which is possible over such a short period. Another candidate is climate forcings other than CO2 such as aerosol cooling being smaller than expected.
A third candidate is an underestimation of climate sensitivity. The IPCC assumed a climate sensitivity of 3°C with an uncertainty range between 1.7° to 4.2°C (this is indicated in the grey area of Figure 2). However, there are a number of positive feedbacks in the climate system that are poorly understood and hence not given much influence in IPCC models. Add to this the fact that model uncertainty is inherently skewed towards greater sensitivity. My guess is higher climate sensitivity is part of the story but not all. More on IPCC's 2001 projections...
Intermediate rebuttal written by John Cook
 |
The Skeptical Science website by Skeptical Science is licensed under a Creative Commons Attribution 3.0 Unported License. |