What The Science Says:
CO2 Emissions from human activities increased dramatically after the Industrial Revolution and are the main reason for the increase in atmospheric CO2 concentration since the Industrial Revolution.
Climate Myth: Human CO2 is a tiny % of CO2 emissions
“The oceans contain 37,400 billion tons (GT) of suspended carbon, land biomass has 2000-3000 GT. The atpmosphere contains 720 billion tons of CO2 and humans contribute only 6 GT additional load on this balance. The oceans, land and atpmosphere exchange CO2 continuously so the additional load by humans is incredibly small. A small shift in the balance between oceans and air would cause a CO2 much more severe rise than anything we could produce.” (Jeff Id)
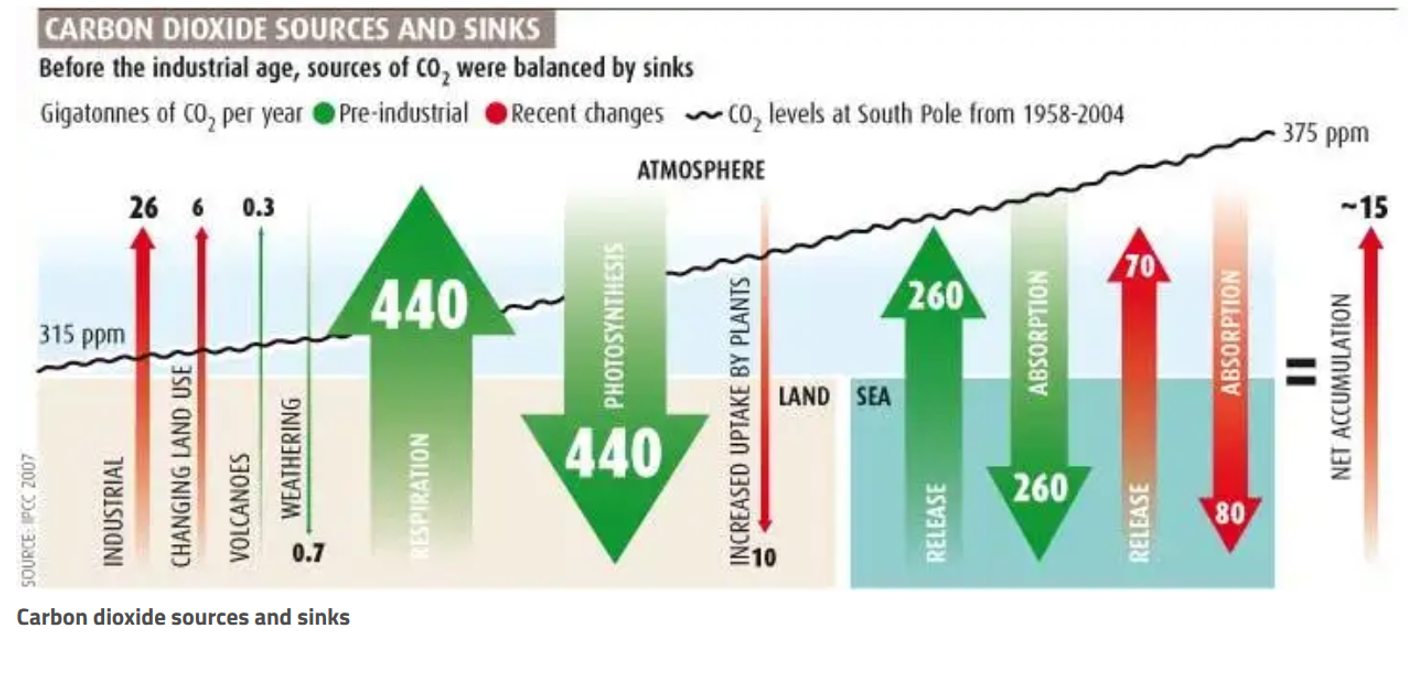
Nature emits and absorbs CO2 to and from the atmosphere, with emissions and absorptions largely in balance before the Industrial Revolution. As depicted in Figure 1, CO2 emissions come from a variety of sources, including human activities, land use changes, vegetation respiration, volcanoes, and ocean release. CO2 sinking sources include weathering, photosynthesis, increased uptake by plants, and ocean absorption.

Figure 1. CO2 sources and sinks with pre-industrial fluxes in green and the recent changes shown in red (Brahic 2007).
In Figure 1, the green arrows show natural emission and absorption with the ocean and land respectively. This demonstrates that natural emissions and absorptions were largely in balance before the industrial revolution. Atmospheric CO2 levels and human CO2 emission significantly increased after industrial revolution. As Figure 2 shows, the recent increase in atmospheric CO2 is unseen in the past 800,000 years and as will be explained below, must be caused by human activity.
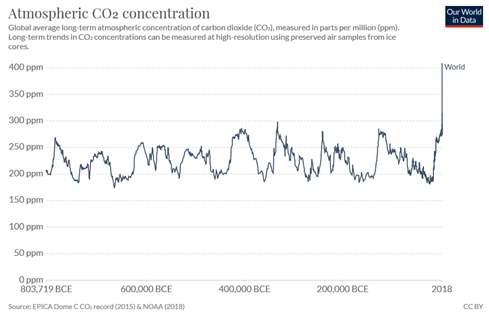
Figure 2. Average concentration of carbon dioxide (CO2) in the atmosphere, measured in parts per million (ppm) from 803,719 BCE to 2018 (data source: NOAA)
One climate myth argues that human CO2 emissions are tiny compared to natural CO2 emissions. This myth oversimplifies the carbon cycle by ignoring that without human influence, natural CO2 emissions are balanced by natural CO2 absorptions. Nature was in balance - we upset the balance. Many lines of evidence confirm that the human role in atmospheric CO2 - observations including atmospheric CO2 measurements, ocean CO2 measurements, and isotope data show that human CO2 emissions are the cause of this increase in atmospheric CO2.
How can scientists be sure that the human CO2 emission (e.g., burning fossil fuels) is responsible for the increase of CO2 in atmosphere? Scientists normally propose many explanatory theories to explain phenomenon and use real-world observations to validate them. It's not easy to prove an explanation is right, but it is easier to prove an explanation is wrong. Before coming to the conclusion that human CO2 is the cause, scientists have investigated other possible explanations, all of which have been ruled out by observational data. This section will list some of the theories, including the ocean one that is also mentioned in the myth.
(1) Could oceans have caused the increase in CO2?
The scientific evidence is clear that since the industrial revolution, the ocean has been absorbing more CO2 than it has been emitting. The partial pressure of carbon dioxide (pCO2) in ocean water is trending upwards since 1990 and the pH value is trending downwards accordingly (Figure 5). DeVries et al (2017) found that the ocean CO2 uptake rates have been growing over the past decade. Meanwhile, decreasing pH reflects that the ocean is absorbing more CO2 from atmosphere. According to the conservation of mass, the ocean CO2 is increasing, so carbon somewhere must be decreasing. Since the atmospheric CO2 is also increasing, the increased carbon must come from other sources.
The reaction between CO2 and seawater forms carbonic acid (H2CO3) which immediately dissociates to form bicarbonate ions (HCO3-) and hydrogen ions (H+). As the concentration of hydrogen ions increases, the water becomes more acidic and the pH value becomes lower (Figure 3).
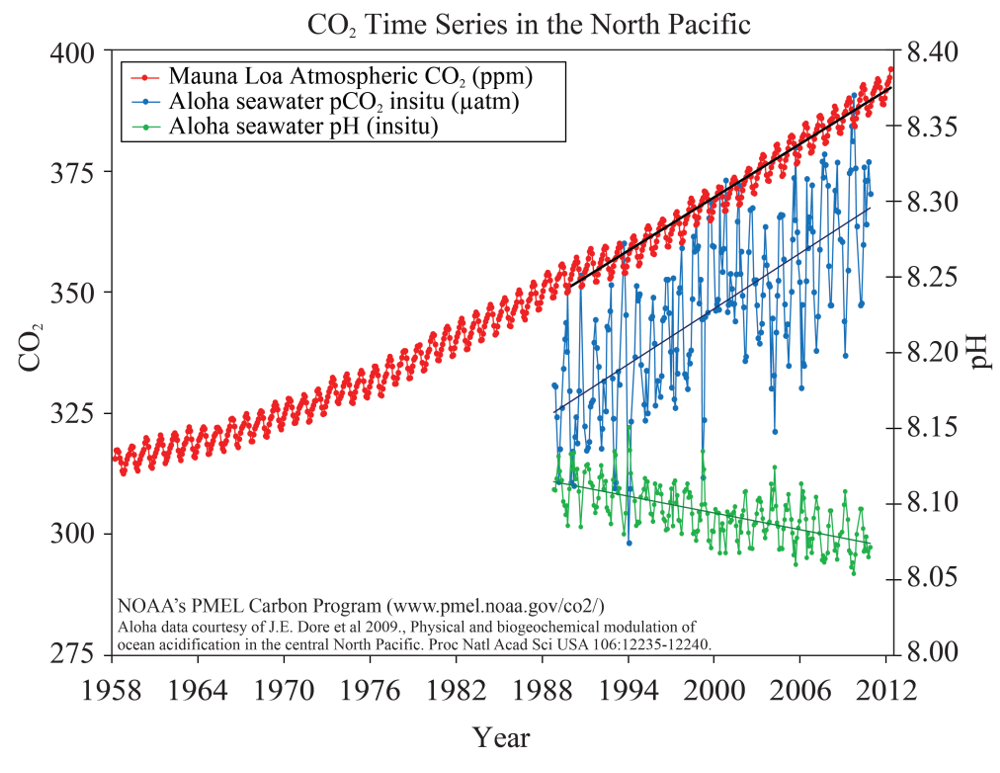
Figure 3. CO2 time series in the North Pacific.
(2) Could land use changes have caused the increase?
Plants absorb CO2 via photosynthesis and produce O2. But human-caused land cover changes are dramatic, especially in the past century, result in deforestation and other changes that reduce the CO2 absorption capacity of the land. Houghton et al (2012) estimated that the net flux of carbon from land use and land cover change accounted for 12.5% of anthropogenic carbon emissions from 1990 to 2010. The Intergovernmental Panel on Climate Change (IPCC) 2019 report concluded that human-caused forest and land use (FOLU) changes contribute to the CO2 emissions (Fig. 4). According to IPCC 2019 report, FOLU CO2 emissions (land use change-related emission in Fig. 1) are around 6 Gt per year, which is smaller than CO2 emission from fossil fuel burning.
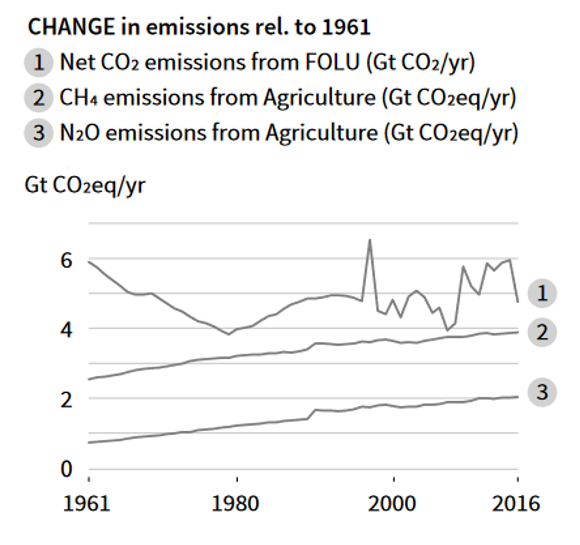
Figure 4. Net CO2 emissions from change of FOLU: forest or land use (IPCC Climate Change and Land 2019 Report).
(3) Could volcanoes have caused the increase?
Some argues that the extra CO2 might come from volcanoes. This is very unlikely because CO2 levels over the past 50 years show no significant increase after large volcano eruptions. It is very unlikely that volcanoes are the major cause for the unprecedented increase in atmospheric CO2.
The decrease of atmospheric oxygen is an evidence indicating that the increase in atmospheric CO2 is due to combustion of fossil fuels. Burning fossil fuels takes gas and oxygen and produces CO2 and water. If human CO2 emissions are the major reason, atmospheric oxygen (O2) should decrease accordingly because of the consumption by chemical combustion. Just as we expected, O2 has been decreasing since we’ve started measuring oxygen levels in the atmosphere (as shown in Fig. 5).

Figure 5. CO2 and O2 trends (light green curve shows the CO2 data collected at the Mauna Loa Observatory Hawaii; the dark green curve is O2 data collected at the South Pole Observatory).
Different sources of CO2 have their own unique isotopic fingerprints. CO2 from the fossil fuel burning doesn't have carbon 14 (14C), and CO2 from terrestrial plants has less carbon 13 (13C) than from the ocean. Since fossil fuels are derived from ancient plants, they also have less 13C isotopes. Isotope data from ice cores show that since 1800, the carbon 13 in atmosphere have decreased, which means the extra CO2 in atmosphere came from fossil burning (Fig. 6).
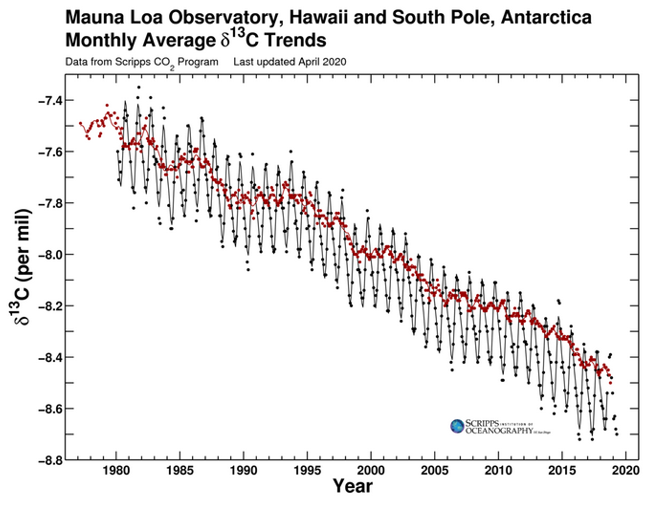
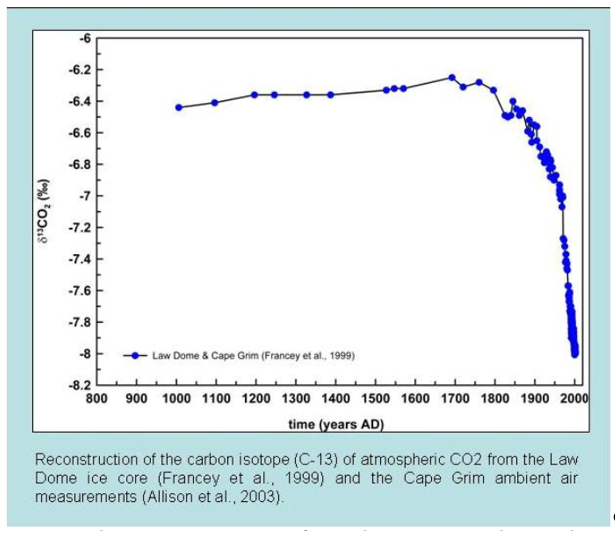
Figure 6. Carbon isotope measurements of atmospheric CO2 from the Law Dome ice core (Francey et al. 1999) and the Cape Grim ambient air measurements (Allison et al. 2003)
The myth that human CO2 emissions are tiny compared to natural CO2 emissions oversimplifies, ignoring that natural emissions are balanced by natural absorptions. After reviewing the evidence, scientists have concluded that human-caused CO2 to be mainly responsible for the increase in atmospheric CO2 after the industrial revolution.
 |
The Skeptical Science website by Skeptical Science is licensed under a Creative Commons Attribution 3.0 Unported License. |