What The Science Says:
Short term surface temperature trends are strongly influenced by natural and other factors which may mask the slow but inexorable anthropogenic warming trend. However the total energy of the climate system continues to increase.
Climate Myth: No warming in 16 years
"...there has been no increase in the global average surface temperature for the past 16 years" (Judith Curry and David Rose)
Update 26/05/2013: The '16 years' video, originally linked from this article, is not representative of the scientific consensus. In fact the short term trends are rather more complicated. The problem is explained in more detail in this article.
Humans have continued to contribute to the greenhouse warming of the planet over the past 16 years. The myth arises from two misconceptions. Firstly, it ignores the fact that short term temperature trends are strongly influenced by a variety of natural factors and observational limitations which must be analyzed to isolate the human contribution. Secondly it focuses on one small part of the climate system (the atmosphere) while ignoring the largest part (the oceans). We will address each of these errors in turn.
Climate scientists have traditionally looked at climate over long periods - 30 years or more. However the media obsession with short term trends has focussed attention on the past 15-16 years. Short term trends are much more complex because they can be affected by many factors which cancel out over longer periods. In a recent interview James Hansen noted "If you look over a 30-40 year period the expected warming is two-tenths of a degree per decade, but that doesn't mean each decade is going to warm two-tenths of a degree: there is too much natural variability".
The list of factors which can affect short term temperature trends is extensive, and some of them can rival the global warming signal in magnitude over short periods. They can be divided into 3 categories: observational biases, natural influences and human influences.
Observational biases
Coverage bias. The HadCRUT4 and NOAA temperature records don’t cover the whole planet. Omitting the Arctic in particular produces a cool bias in recent temperatures. (e.g. Hansen et al 2006, Folland et al 2013). The video avoided this problem by using GISTEMP. However the issue affects the Foster and Rahmstorf analysis of the other records.
Sea surface temperature bias. The GISTEMP and NOAA temperature records don’t include corrections for the transition from warm-biased engine room measurements to buoy measurements over the past 15 years. This produces a cool bias in recent temperature trends, although this result is based on only one study (Kennedy et al 2012).
Natural influences
Volcanic eruptions. The recovery from the Pinatubo eruption is responsible for a short term warming. GCMs predict that this is a significant contribution to recent warming. However Neely et al (2013) find evidence of a significant cooling contribution from recent volcanoes.
The El Nino oscillation. The recent run of La Niñas produces a moderate cooling effect.
The solar cycle. The current low solar activity produces a small cooling effect.
Longer term oscillations, including the AMO and PDO.
Changes in ocean heat uptake. A number of recent papers have found evidence that heat has been going into the oceans rather than the atmosphere recently, see in particular Balmaseda et al (2013), Guemas et al (2013), Nuccitelli et al (2012) and Levitus et al (2012) (and also used in Otto et al, 2013).
Human influences
An increase in other industrial emissions. Unlike long-lived greenhouse gasses such as CO2, short-lived atmospheric constituents can cause significant short term fluctuations in the rate of warming. Chinese aerosol emissions have varied significantly over the past 16 years (Klimont et al 2013). Murphy (2013) finds that the direct cooling effect of these emissions has been limited, however secondary effects on clouds are still uncertain.
Implications
In order to reliably detect a change in the underlying rate of warming, it is necessary to separate out all of these contributions. While attempts have been made at this calculation, (for example Lean and Rind 2008 and Foster and Rahmstorf 2011), there remain significant uncertainties, for example in the duration of the volcanic response and the contribution of recent volcanoes.
The fundamental mechanism of global warming is a change in the top-of-atmosphere energy balance, and as a result the energy content of the climate system provides a more direct measure of global warming which avoids many of these problems, although the observational record is shorter and less complete (e.g. Church et al 2011).
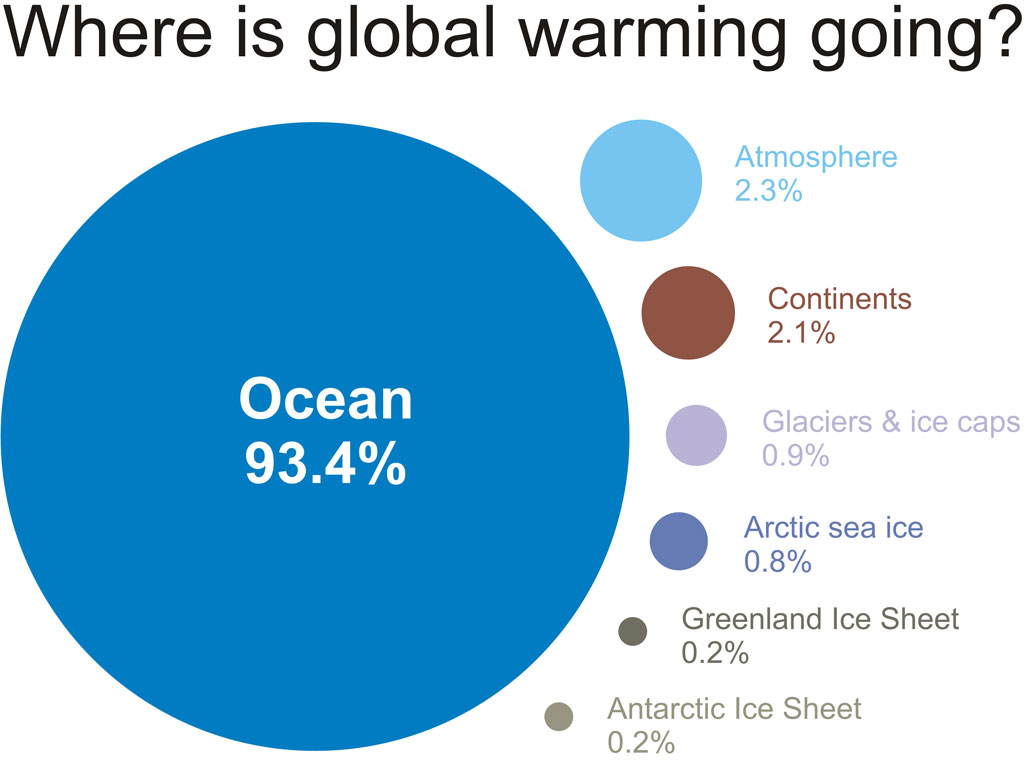
Focusing on surface air temperatures also misses more than 90% of the overall warming of the planet (Figure 2).
Figure 2: Components of global warming for the period 1993 to 2003 calculated from IPCC AR4 5.2.2.3.
Nuccitelli et al. (2012) considered the warming of the oceans (both shallow and deep), land, atmosphere, and ice, and showed that global warming has not slowed in recent years (Figure 3).
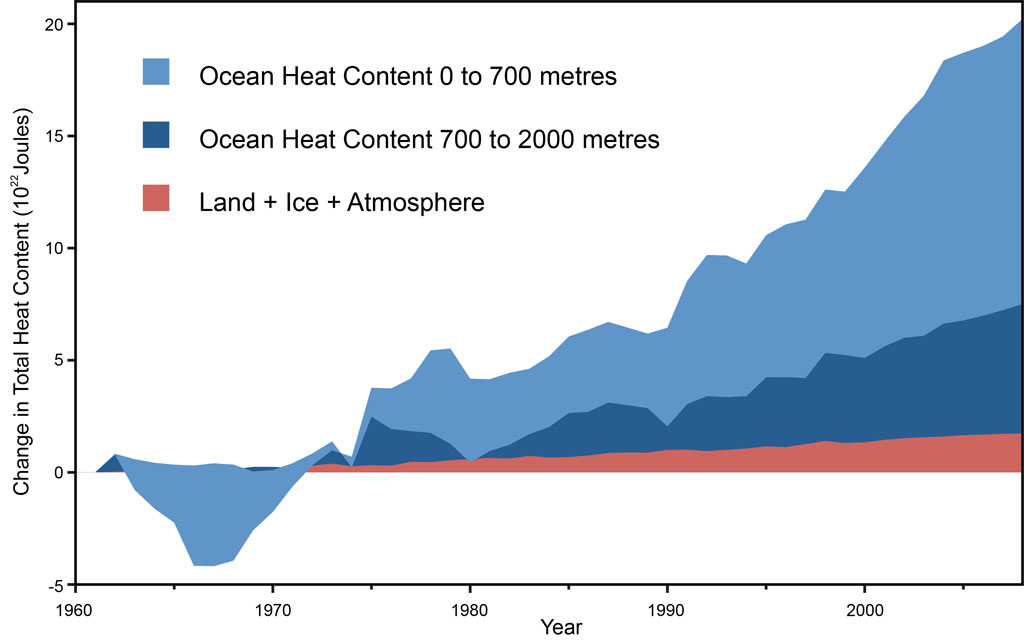 Figure 3: Land, atmosphere, and ice heating (red), 0-700 meter OHC increase (light blue), 700-2,000 meter OHC increase (dark blue). From Nuccitelli et al. (2012).
Advanced rebuttal written by Kevin C
Update July 2015:
Here is a related lecture-video from Denial101x - Making Sense of Climate Science Denial
 |
The Skeptical Science website by Skeptical Science is licensed under a Creative Commons Attribution 3.0 Unported License. |