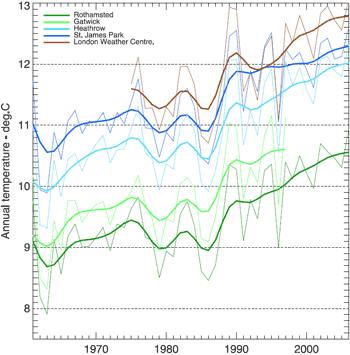
Figure 1: Annual temperature trends for five sites in and around London. Brown and dark blue are urban sites, green are rural.
What The Science Says:
While urban areas are undoubtedly warmer than surrounding rural areas, this has had little to no impact on warming trends.
Climate Myth: It's Urban Heat Island effect
A paper by Ross McKitrick, an economics professor at the University of Guelph, and Patrick Michaels, an environmental studies professor at the University of Virginia, concludes that half of the global warming trend from 1980 to 2002 is caused by Urban Heat Island. (McKitrick & Michaels)
When compiling temperature records, NASA GISS go to great pains to remove any possible influence from Urban Heat Island Effect. They compare urban long term trends to nearby rural trends. They then adjust the urban trend so it matches the rural trend. The process is described in detail on the NASA website (Hansen et al. 2001).
They found in most cases, urban warming was small and fell within uncertainty ranges. Surprisingly, 42% of city trends are cooler relative to their country surroundings as weather stations are often sited in cool islands (eg - a park within the city). The point is they're aware of UHI and rigorously adjust for it when analysing temperature records.
This confirms a peer review study by the NCDC (Peterson 2003) that did statistical analysis of urban and rural temperature anomalies and concluded "Contrary to generally accepted wisdom, no statistically significant impact of urbanization could be found in annual temperatures... Industrial sections of towns may well be significantly warmer than rural sites, but urban meteorological observations are more likely to be made within park cool islands than industrial regions."
Another more recent study (Parker 2006) plotted 50 year records of temperatures observed on calm nights, the other on windy nights. He concluded "temperatures over land have risen as much on windy nights as on calm nights, indicating that the observed overall warming is not a consequence of urban development".
The paper Urbanization effects in large-scale temperature records, with an emphasis on China (Jones et al 2008) finds urban temperature trends to be little different to rural trends. The paper begins by looking at 5 sites in and around London. Figure 1 shows absolute temperatures, clearly indicating a UHI influence on the urban sites at London Weather Centre (brown) and St. James Park (dark blue). The coolest record is the rural based Rothamsted (dark green). However, the excess urban warmth has no effect on the temperature trend - all sites show the same overall trend.
Figure 1: Annual temperature trends for five sites in and around London. Brown and dark blue are urban sites, green are rural.
A similar comparison was made between two sites in Vienna. Again, the absolute temperature is greater for the urban site but both sites show near identical trends.
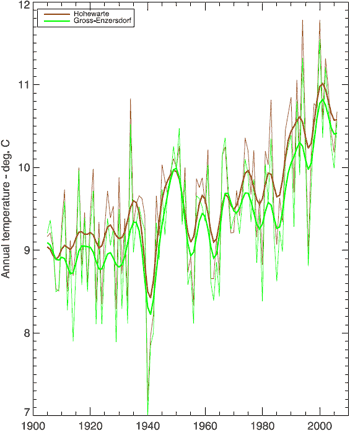
Figure 2: Annual temperature trends for two sites in Vienna – Hohewarte in the center (brown) and the rural location of Grossenzersdorf (green).
So established urban areas show the same trends as surrounding rural areas. What about urban areas that are still developing? China, in contrast to Europe, has experienced rapid economic growth over the last 30 years with a dramatic increase in its city areas. If there were to be significant urban-related warming, it ought to be in this region and over recent decades. Figure 3 compares a range of temperature datasets:
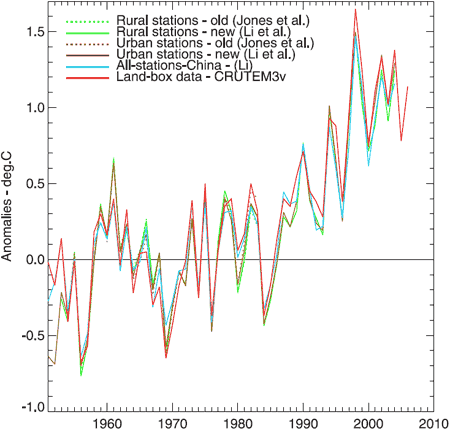
Figure 3: Annual average temperature anomalies. Jones et all (dotted green and brown) is a dataset of 42 rural and 42 urban sites. Li et al (solid green and brown) is a homogenized dataset of 42 rural and 40 urban sites. Li (blue) is a non-homogenized set of 728 stations, urban and rural. CRUTEM3v (red) is a land-only data set (Brohan et al., 2006). This plot uses the 1954–83 base period.
That there are hardly any differences between the six series tells us several things. Small datasets of 40 stations show the same result as the 728 station dataset. In other words, for a region of this size, the average can be constructed from a limited number of sites, implying that for the 728 station network there is considerable redundancy.
As the scale increases, the overall impact of homogeneity adjustments diminishes. This might be a bit heartbreaking for those hard working boffins who spend hundreds of hours pouring meticulously over station data, ensuring the data is all homogenised (but of course, they don't do it just to calculate global trends).
And of course, the most significant finding: the trend is the same for both urban and rural groups over any of the periods. Even in the case of developing urban areas, when averaged out over large areas, urban heat island has little impact on the warming trend.
Intermediate rebuttal written by John Cook
Update July 2015:
Here is a related lecture-video from Denial101x - Making Sense of Climate Science Denial
Update December 17, 2017 - fixed some broken links (BaerbelW)
 |
The Skeptical Science website by Skeptical Science is licensed under a Creative Commons Attribution 3.0 Unported License. |