


 Arguments
Software
Resources
Comments
The Consensus Project
Translations
About
Support
Arguments
Software
Resources
Comments
The Consensus Project
Translations
About
Support
![]()
![]()
![]()
![]()
![]()
![]()
![]()
![]()
![]()
![]()


![]()


Latest Posts
- At a glance - The difference between weather and climate
- India makes a big bet on electric buses
- 2024 SkS Weekly Climate Change & Global Warming News Roundup #16
- EGU2024 - An intense week of joining sessions virtually
- Skeptical Science New Research for Week #16 2024
- How extreme was the Earth's temperature in 2023
- At a glance - Is the science settled?
- What is Mexico doing about climate change?
- 2024 SkS Weekly Climate Change & Global Warming News Roundup #15
- Fact Brief - Did global warming stop in 1998?
- Skeptical Science New Research for Week #15 2024
- EGU2024 - Picking and chosing sessions to attend virtually
- At a glance - The Pacific Decadal Oscillation (PDO) is not causing global warming
- Climate Adam: Is Global Warming Speeding Up?
- 2024 SkS Weekly Climate Change & Global Warming News Roundup #14
- Gigafact and Skeptical Science collaborate to create fact briefs
- Skeptical Science New Research for Week #14 2024
- How can I make my retirement plan climate-friendly?
- At a glance - Global warming and the El Niño Southern Oscillation
- A data scientist’s case for ‘cautious optimism’ about climate change
- 2024 SkS Weekly Climate Change & Global Warming News Roundup #13
- Skeptical Science New Research for Week #13 2024
- You can start applying for the American Climate Corps next month
- At a glance - Human fingerprints on climate change rule out natural cycles
- Want clean electricity? These are the overlooked elected officials who get to decide.
- 2024 SkS Weekly Climate Change & Global Warming News Roundup #12
- Climate - the Movie: a hot mess of (c)old myths!
- Skeptical Science New Research for Week #12 2024
- Climate Adam: Could the Amazon Rainforest Collapse?
- At a glance - Does CO2 always correlate with temperature?
Comment Search Results
Search for ice mass balance
Comments matching the search ice mass balance:
- CO2 lags temperature
Charlie_Brown at 09:26 AM on 16 March, 2024RBurr @ 654
1) CO2 lags temperature rise at the end of an ice age because CO2 evolves from ocean waters as the temperature rises. This is Henry’s Law. In that case, temperature rises first due to the Milankovitch Cycles. Note that ice age temperatures cool slowly and warm rapidly. Modern CO2 emissions are different because they come from burning fossil fuels. Therefore, temperature rises as a result of CO2. Cause and effect in both cases is clear in both cases, and different in both cases.
2) The quantum mechanical mechanism on IR radiation that explains the greenhouse warming theory has been proven. It is based on fundamental principles of energy balance and radiant energy transfer and has been verified by massive amounts of data, cross-checks, and validation.
3) The Earth’s energy “balance” is fundamental:
Input = Output + Accumulation
Output is reduced as greenhouse gases increase. Thus, energy accumulates.
4) Your description of quantum mechanics does not make sense. Quantum mechanics is fundamental to the specific frequencies (i.e., wavelengths) that are absorbed and emitted by CO2, CH4, and H2O. There is a huge amount of energy carried by IR radiation. It is naturally emitted (not dissipated) and lost to outer space by IR. By the overall global energy balance at steady state:
Input solar = Reflected solar + Emitted IR
Accumulation is zero at steady state, as before CO2 emissions of the industrial revolution.
5) The hot object in this case is the sun at about 5800 Kelvin. That is more than hot enough to warm the earth. The temperature profile is 5800 K of the sun to 288 K (60F) of the Earth 217 K of the lower stratosphere to 2 K of outer space. Increasing CO2 reduces the energy loss to space at specific wavelengths (e.g., approx. 13-17 microns). The absorptance/emittance lines in that range increase, meaning that energy is emitted from a cold 217 K instead of a warm 288 K. This upsets the energy balance. The balance is restored by accumulating energy until the surface temperature increases enough to make up the reduction by CO2. Nothing about this violates either the 1st or 2nd law of thermodynamics. Some mistake the 2nd law by describing the energy balance being at steady state, but the steady state was upset by increasing GHG.
6) Neither the Milankovitch Cycles nor the Schwabe Cycles (sunspots) explain the cause of modern global warming. The long-term Milankovitch Cycles have not been in a period of significant change for the last 12,000 years after warming from the last ice age. Measured radiosity data from the sun show that short-term Schwabe Cycles have not changed significantly either and do not explain modern warming.
- Antarctica is gaining ice
Bart Vreeken at 19:51 PM on 24 May, 2023Thank you very much, scaddenp #579
So text was just removed, which is very annoying! I wasn't sure if I had done anything wrong myself.
But indeed, a rising air temperature and reduced sea ice mean more snowfall and a higher Surface Mass Balance according to multiple models. The question is how that relates to the increased melting and calving along the edges. Nobody knows exactly, and therefore it's good to have a close look on what happens.
BL #577 "He's made a big thing about NASA's 149 Gt/yr value"
Huh ...? I simply changed the number, for it was wrong. Bob Loblaw was the one who kept talking about it. And yes, "it ignores all the data in between." But that's not what the discussion was about. Replacing the 'last-first' by 'regression' doesn't make it better, for that still ignores all the data in between.
- Antarctica is gaining ice
Bart Vreeken at 01:41 AM on 23 May, 2023"Are you suggesting the most recent changes in ice mass are indicative of a substantive change in the trend? And if so, what do you think is driving such a change?"
That might be, yes. The driving force could be the low amount of sea ice, and the rising temperatures. Both of them can produce more snowfall. The question is: how will the discharge of the ice along the edge of the ice sheet react? And how is the balance between these two? Of course, things can be less positive when the climate change goes on. More precipitation can fall in the form of rain than, and the discharge can overrule the gain of ice again. Nowbody knows, that's why it's so interesting to have a close look on what happens.
- Antarctica is gaining ice
Bart Vreeken at 05:44 AM on 21 May, 2023"Where the 149 Gt/yr number comes from was discussed in March"
OK, let's have a look at the data of IMBIE, then. IMBIE is the Ice Sheet Mass Balance Inter-comparison Exercise. They compare data from different sources: gravimetry, altimetry, input-output.
essd.copernicus.org/articles/15/1597/2023/
There, the average number over April 2002 - December 2020 is 114,9 Gt/Yr. Very much like my calculation, but without the data of 2021 and 2022.

- Antarctica is gaining ice
Bart Vreeken at 18:50 PM on 20 May, 2023 After three months, there is another update of the gravitational measurements of the Antarctic ice sheet. The series now runs until February 13, which includes most of the Antarctic summer. Often in February there is a minimum in the amount of ice, but the pattern is not very tight.
We still see that Antarctica as a whole has a better period. Over the last three years, there has been no net decrease in land ice. The small amount of sea ice must play an important role in this. As a result, more snow falls. Apparently, that was enough to compensate for the increased melting and calving along the edge.
Changes to the floating ice shelves cannot be measured in this way. - Arctic sea ice has recovered
One Planet Only Forever at 14:53 PM on 21 April, 2023Albert started an interesting discussion with their comment @120.
I have an update of my questioning comment @124.
My updated question for Albert is "What explains the recent reduced rate of Arctic Sea Ice loss given that global ice mass loss has continued to occur?" (in addition to the links @124 see the EGU "Review article: Earth's ice imbalance" here which has the following in its Abstract "The rate of ice loss has risen by 57 % since the 1990s – from 0.8 to 1.2 trillion tonnes per year")
Similar to my question @124, the answer is not that human impacts have stopped significantly affecting the climate. And, as has been painstakingly pointed out by others, the recent lack of rapid reduction of Arctic sea ice does not mean that the recent rapid reduction of Arctic sea ice due to human induced global warming has ended.
That raises another question. "Why is the admittedly unusual temporary reduction of the rate of Arctic Sea Ice loss being focused on so relentlessly when global ice loss has continued to occur rapidly?"
- The Big Picture
Bob Loblaw at 11:28 AM on 18 March, 2023Bart @ 62:
In addition to pointing out what Rob said to you at comment 64 about the error in using Surface Mass Balance, I note that you have also given a map of SMB for a single winter season. Do you not bother looking at the ful captions of the figures you pick up? This one does not need translation from Dutch - it is dated March 16, 2023, and states "Accumulated anomaly since Sep 1, 2022".
You're back to the same basic error that you made in your very first post here at SkS on March 9, regarding Antarctic ice. Treating a single year of data as if it represents a long term trend.
At least you honestly say "...how the Greenland Icesheet reshapes at the moment..." Now all you need to figure out is that "the moment" is not enough to make predictions about the future.
Another clue for you: losing ice at lower altitudes around the perimeter of the ice sheet, and gaining ice at the higher altitude is Business As Usual for continental ice sheets. There is this thing called "glacial flow" that moves ice from the accumulation zone to the ablation zone. You should read about it some time.
- The Big Picture
michael sweet at 10:24 AM on 18 March, 2023Here is a map of surface height change in Greenland. That includes snowfall, melt runoff, ocean melting and iceberg calving.

The caption reads:
Maps of elevation change from satellite altimetry reveal where the Greenland Ice Sheet is changing mass. Map created using data acquired by the CryoSat-2 satellite radar altimeter. Credit: CPOM
I note that the major areas of ice loss are on the west and northwest side of the island, the opposite of Holland.
- The Big Picture
Bart Vreeken at 08:07 AM on 18 March, 2023@60
"You have no justification for saying that the mass loss will come from the southern part of Greenland."
When we look at the anomaly of the Surface Mass Balance of Greenland of this moment then I think that it gives a good idea of how the Greenland Icesheet reshapes at the moment. The lower parts and the southern parts are losing ice, and the higher part can gain ice due to more precipitation.

- Antarctica is gaining ice
Bart Vreeken at 02:57 AM on 17 March, 2023Pfff, it looks like knowledge of psychology is more useful here then knowledge of Antarctica and climate change. How to react? A person called 'One Planet only forever' makes his or her own analyzation about 'people like me'. But isn't even willing to tell his or her own name. Why is that? I think an open discussion without hide-and-seek is more effectful and respective. About my motivation: my only motivation is trying to understand Antarctica and sharing information on that. And discussing that, but in a positive way. OK, lets stay on topic.
We had a discussion about the the collapse of the Conger glacier's ice shelf. Here's an article on Change in Antarctic Ice Shelf Area from 2009 to 2019. In this period the ice shelves around Antarctica have gained a modest 0.4 %, or 5,304.5 km2 the study says. The study does not include the last three years. A low sea ice extent won't be good for the ice shelves, so I think we can expect that they lost some of there area.
egusphere.copernicus.org/preprints/2022/egusphere-2022-1087/egusphere-2022-1087.pdf
And then a rectification. I made calculations on the total discharge of Antarctica, based on the Surface Mass Balance (SMB) and the GRACE data. But the SMB calculated here also includes the ice shelves, and that part does not count for the mass change of the ice sheet. So, the SMB for the grounded ice will be less, and the discharge of the grounded ice will be less. In the literature I found numbers like 1750 Gt/yr.
- Antarctica is gaining ice
Bart Vreeken at 02:09 AM on 15 March, 2023Ah, thank you John Hartz @557
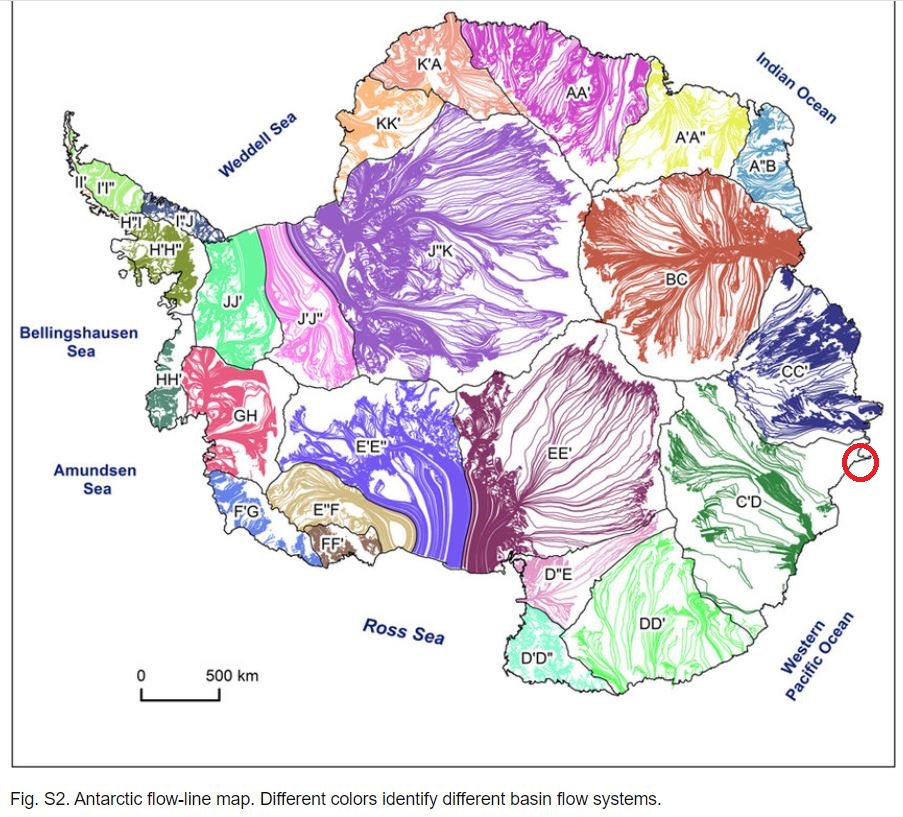
Yes, I noticed the article too. Indeed, the iceshelfs are the missing part of information and indeed, they are more vulnerable when the sea ice extent is low. But when we look at the position of the Conger's ice shelf (it's in the red circle on the map below) there is something strange. There isn't much inflow of ice from the ice sheet above. And when there isn't inflow, an ice shelf will disappear sooner or later. Maybe the pattern of the ice flow has changed during the years?
So, let's hope that the other ice shelfs are doing better. At least, the collapse of the Conger's ice shelf didn't influence the mass balance of the total ice sheet (the non-floating part) too much last year. It showed an increase of mass.
- Antarctica is gaining ice
Bob Loblaw at 08:35 AM on 11 March, 2023Bart @ 546, 547, and 549:
When I am having a serious discussion with someone in the comments section here, I expect certain things:
- That they stick consistently to one aspect of a discussion, without jumping randomly from one sub-characteristic to another.
- That when they refer to a figure, they are specific in explaining what part of the figure they are talking about.
- That when they provide a link to a paper, they explain which part of the paper they want someone to read (e.g., by using quotes or section numbers, or figure numbers) and why it is relevant.
- When they make multiple points, they give some indication that they are shifting gears and how the new point relates to the old point.
You've jumped from Grace data showing total mass, to links to papers discussing snowfall changes, to Surface Mass Balance, and back again - and it is all jumbled together in an incoherent mess.
In 546, you state, "I never said the the [sic] mass loss has stopped. (OK, last year incidentely) [sic]."
- The whole purpose of your original comment @ 533 was to draw attention to that "incidental" observation in Grace data, and to tie it to sea ice loss.
- In 537, you doubled down on the significance of that one year, and speculated about what might happen "in coming years". And linked to a paper that did not discuss Grace data at all.
- In 541 you drew attention to how that one "incidental" point had changed the average, and said that it "gave us a hint..." You referred back to that same paper that does not cover Grace data.
- In 544 you switched from Grace data in your original comment to discussions of SMB, without explaining, connecting, or justifying the change.
And now the primary evidence from your original comment (the 2022 Grace data) is dropped as if you just mentioned it "incidentely" [sic] and never meant it to be a claim that the mass loss had stopped?
I expected an honest discussion here, not a game of "Look, squirrel". And in 549 your response to Rob's request to explain what is "interesting" is basically a hand-waving speculation of maybes. If you are posting maybes so that you can backtrack and say things like "I never said the the [sic]mass loss has stopped", when that was the obvious implication of what you said, then it is impossible to have a serious discussion with you.
- Antarctica is gaining ice
Bart Vreeken at 03:32 AM on 11 March, 2023Bob @545
I expected a more serious discussion here.
Of course, snowfall is not SMB. There is also surface melting, runoff, wind blow, evaporation. In the figure i posted above you can see the difference between the SMB and the snowfall (dashed line). But of course, there is a big corralation between SMB and snowfall.
And SMB is not the same as the total Mass Balance. I never said the the mass loss has stopped. (OK, last year incidentely).
The SMB of the last seven years is showed in the figure I posted above. Source:
www.climato.uliege.be/cms/c_5652669/fr/climato-antarctica
As you can see, the SMB of season 2022-2023 ended ca 310 Gt above average. And so on.
And yes, its not completly consistent with the diagram in comment 533. The diagram shows the mass change between 2021/11/14 and 14 2022/11/14, based on gravimetry. The SMB is calculated over 2022/03/01 until 2023/03/01 based on weather models.
With a close look to the SMB figure you can also derive a SMB over the same period as the GRACE data.

- Antarctica is gaining ice
Bob Loblaw at 00:26 AM on 11 March, 2023Bart @ 544:
You are really presenting a scrambled set of statements that lack clarity and consistency.
The link you provide does not mention any increase in SMB - it discusses small increases in snowfall, and how this has made the decreases in the SMB less than they would have been otherwise. The opening of the second paragraph is [emphasis added]:
"Our findings don’t mean that Antarctica is growing; it’s still losing mass, even with the extra snowfall"
The second-last paragraph says [emphasis added]:
“Snowfall plays a critical role in Antarctic mass balance and it will continue to do so in the future,” Medley said. “Currently it is helping mitigate ice losses, but it’s not entirely compensating for them. We expect snowfall will continue to increase into the 21st century and beyond, but our results show that future increases in snowfall cannot keep pace with oceanic-driven ice losses in Antarctica.
So, your reference provides no support for your claim that the 2022 increase in SMB "started last century". Snowfall is not SMB - it is only part of it. Stop jumping from one measure to another, as if they are equivalent.
When you refer to "the last seven years then five of them were above average; four of them were far above average and none of them were far below average" you completely fail to tell us what "them" are. The article you link to provides no annual numbers for anything. This description does not appear to be consistent with the diagram you presented originally in comment 533, and I have no idea what data set you are talking about.
You appear to be taking small bits from articles that you read, misunderstanding what they say, and interpreting them (incorrectly) as evidence that supports your position.
- Antarctica is gaining ice
Bart Vreeken at 06:01 AM on 10 March, 2023Bob Loblaw @ 539
I don't think focussing on the noise is a good idea ;-)
When we just look at the GRACE data then the year 2022 is one in a row of 20. After last year the average has changed, which is interesting by itself.
But during this 20 years things have changed. The extent of the sea ice has declined. So more water vapour comes to the continent, which gives more precipitation. The question is how this works out. The last year gave us a hint that it can add a lot to the Surface Mass Balance. The next question is: how much will the SMB increase, and how much will the discharge increase. Of course, that's very uncertain. In the paper I called it says in the abstract:
The surface mass balance in SSP5–8.5 simulations shows a pattern of strong decrease on ice shelves, caused by increased melting, and strong increase on grounded ice, caused by increased snowfall. Despite strong surface and basal melting of the ice shelves, increased snowfall dominates the mass budget of the grounded ice, leading to an ensemble mean Antarctic contribution to global mean sea level of a fall of 22 mm by 2100 in the SSP5–8.5 scenario. We hypothesise that this signal would revert to sea-level rise on longer timescales, caused by the ice sheet dynamic response to ice shelf thinning. These results demonstrate the need for fully coupled ice–climate models in reducing the substantial uncertainty in sea-level rise from the Antarctic Ice Sheet.
- Antarctica is gaining ice
MA Rodger at 01:05 AM on 10 March, 2023Bart Vreeken @533,
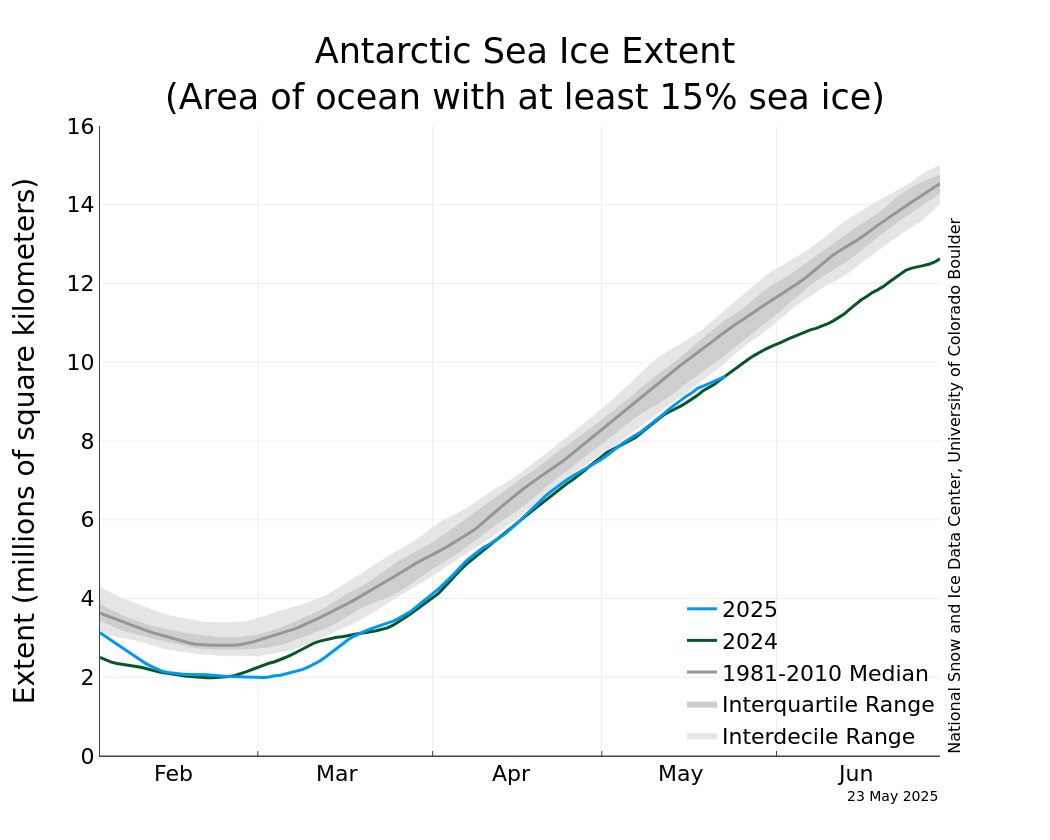
You appear to be plotting out the GRACE/GRACE-FO data as per this NASA web page (which shows data to Oct 2022). This gravity data does not measure Sea Ice which is floating. And for clarity, it is not Surface Mass Balance which you correctly say had an exceptional year last year (as per this NSIDC post of January 2023, snowfall being high enough to "completely offset recent net ice losses from faster ice flow off the ice sheet for this assessment period. Most of the past decade has seen annual net losses of 50 to 150 billion tons."

So a record year for the 2023 Antarctic Sea Ice Extent minimum as well as a record year for the 2022 Antarctic Surface Mass Balance.
Antarctica doesn't get a lot of attention, compared to the Arctic cryosphere. Certainly for Antarctic Sea Ice, the mechanisms driving the variations is a lot less straightforward in the Antarctic.
- Antarctica is gaining ice
Bart Vreeken at 23:07 PM on 9 March, 2023
It looks like the Antartican Ice Sheet had a very good year, as far as we can see. At least, the mass balance over the period november 2021 - november 2022 was far positive. This can be due to the very low extend of the sea ice. The Surface Mass Balance over the melting period of last year turned out very positive. I don't read much about this, the focus in de media is on the low extent of the sea ice. Any thoughts about this?
I did expect a new update of de GRACE data of December 2022, but it comes late again.
- What’s going on with the Greenland ice sheet?
MA Rodger at 23:09 PM on 3 September, 2022Wayne @4,
I was in two minds on continuing our interchange, but I decided I would continue when I came across coverage of the paper underlying this SkS OP which surprisingly appeared today on the pages of my local rag with the title "Zombie ice to raise global sea level". On-line I see the same story getting into newspapers elsewhere (eg The Washigton Post).
In terms of an SLR-CO2 correlations, I don't recall seeing Hansen provide it. I believe the closest he got was in Hansen et al (2013) 'Climate sensitivity, sea level and atmospheric carbon dioxide' (with its well-used Fig 1) which looked at temperature & SLR but only inferred CO2 levels with very cursory checks to actual CO2 reconstructions.

And for me, Hansen's 5m SLR by 2100 was always a bit of theorising that I struggled with. Even after it appeared properly written up in Hansen et al (2016), which at least answered the energy equations that were my initial objection to such a large SLR projections, for me it still remains more 'discussion document' than a full-blooded argued case. In my view, worrying as it is, the future SLR from Greenland & Antarctica depends on the Precipitation minus Ice-Loss balances and that puts us in the hands of climatologists for the precipitaion and glaciologists for the ice-loss. The application of paleoclimatology and whether Greenland melted out in the Eemian isn't so relevant for our future SLR.
Just to throw in my other SLR bug bear which also becomes relevant here, I've always reckoned SLR ain't gonna stop at 2100. So why do we go on so long about the 2100 SLR when by 2150, 2200, 2300 etc it's going to be seriously bigger? (A total of 2.3m SLR/ºC AGW according to IPCC AR5 fig13.14.)
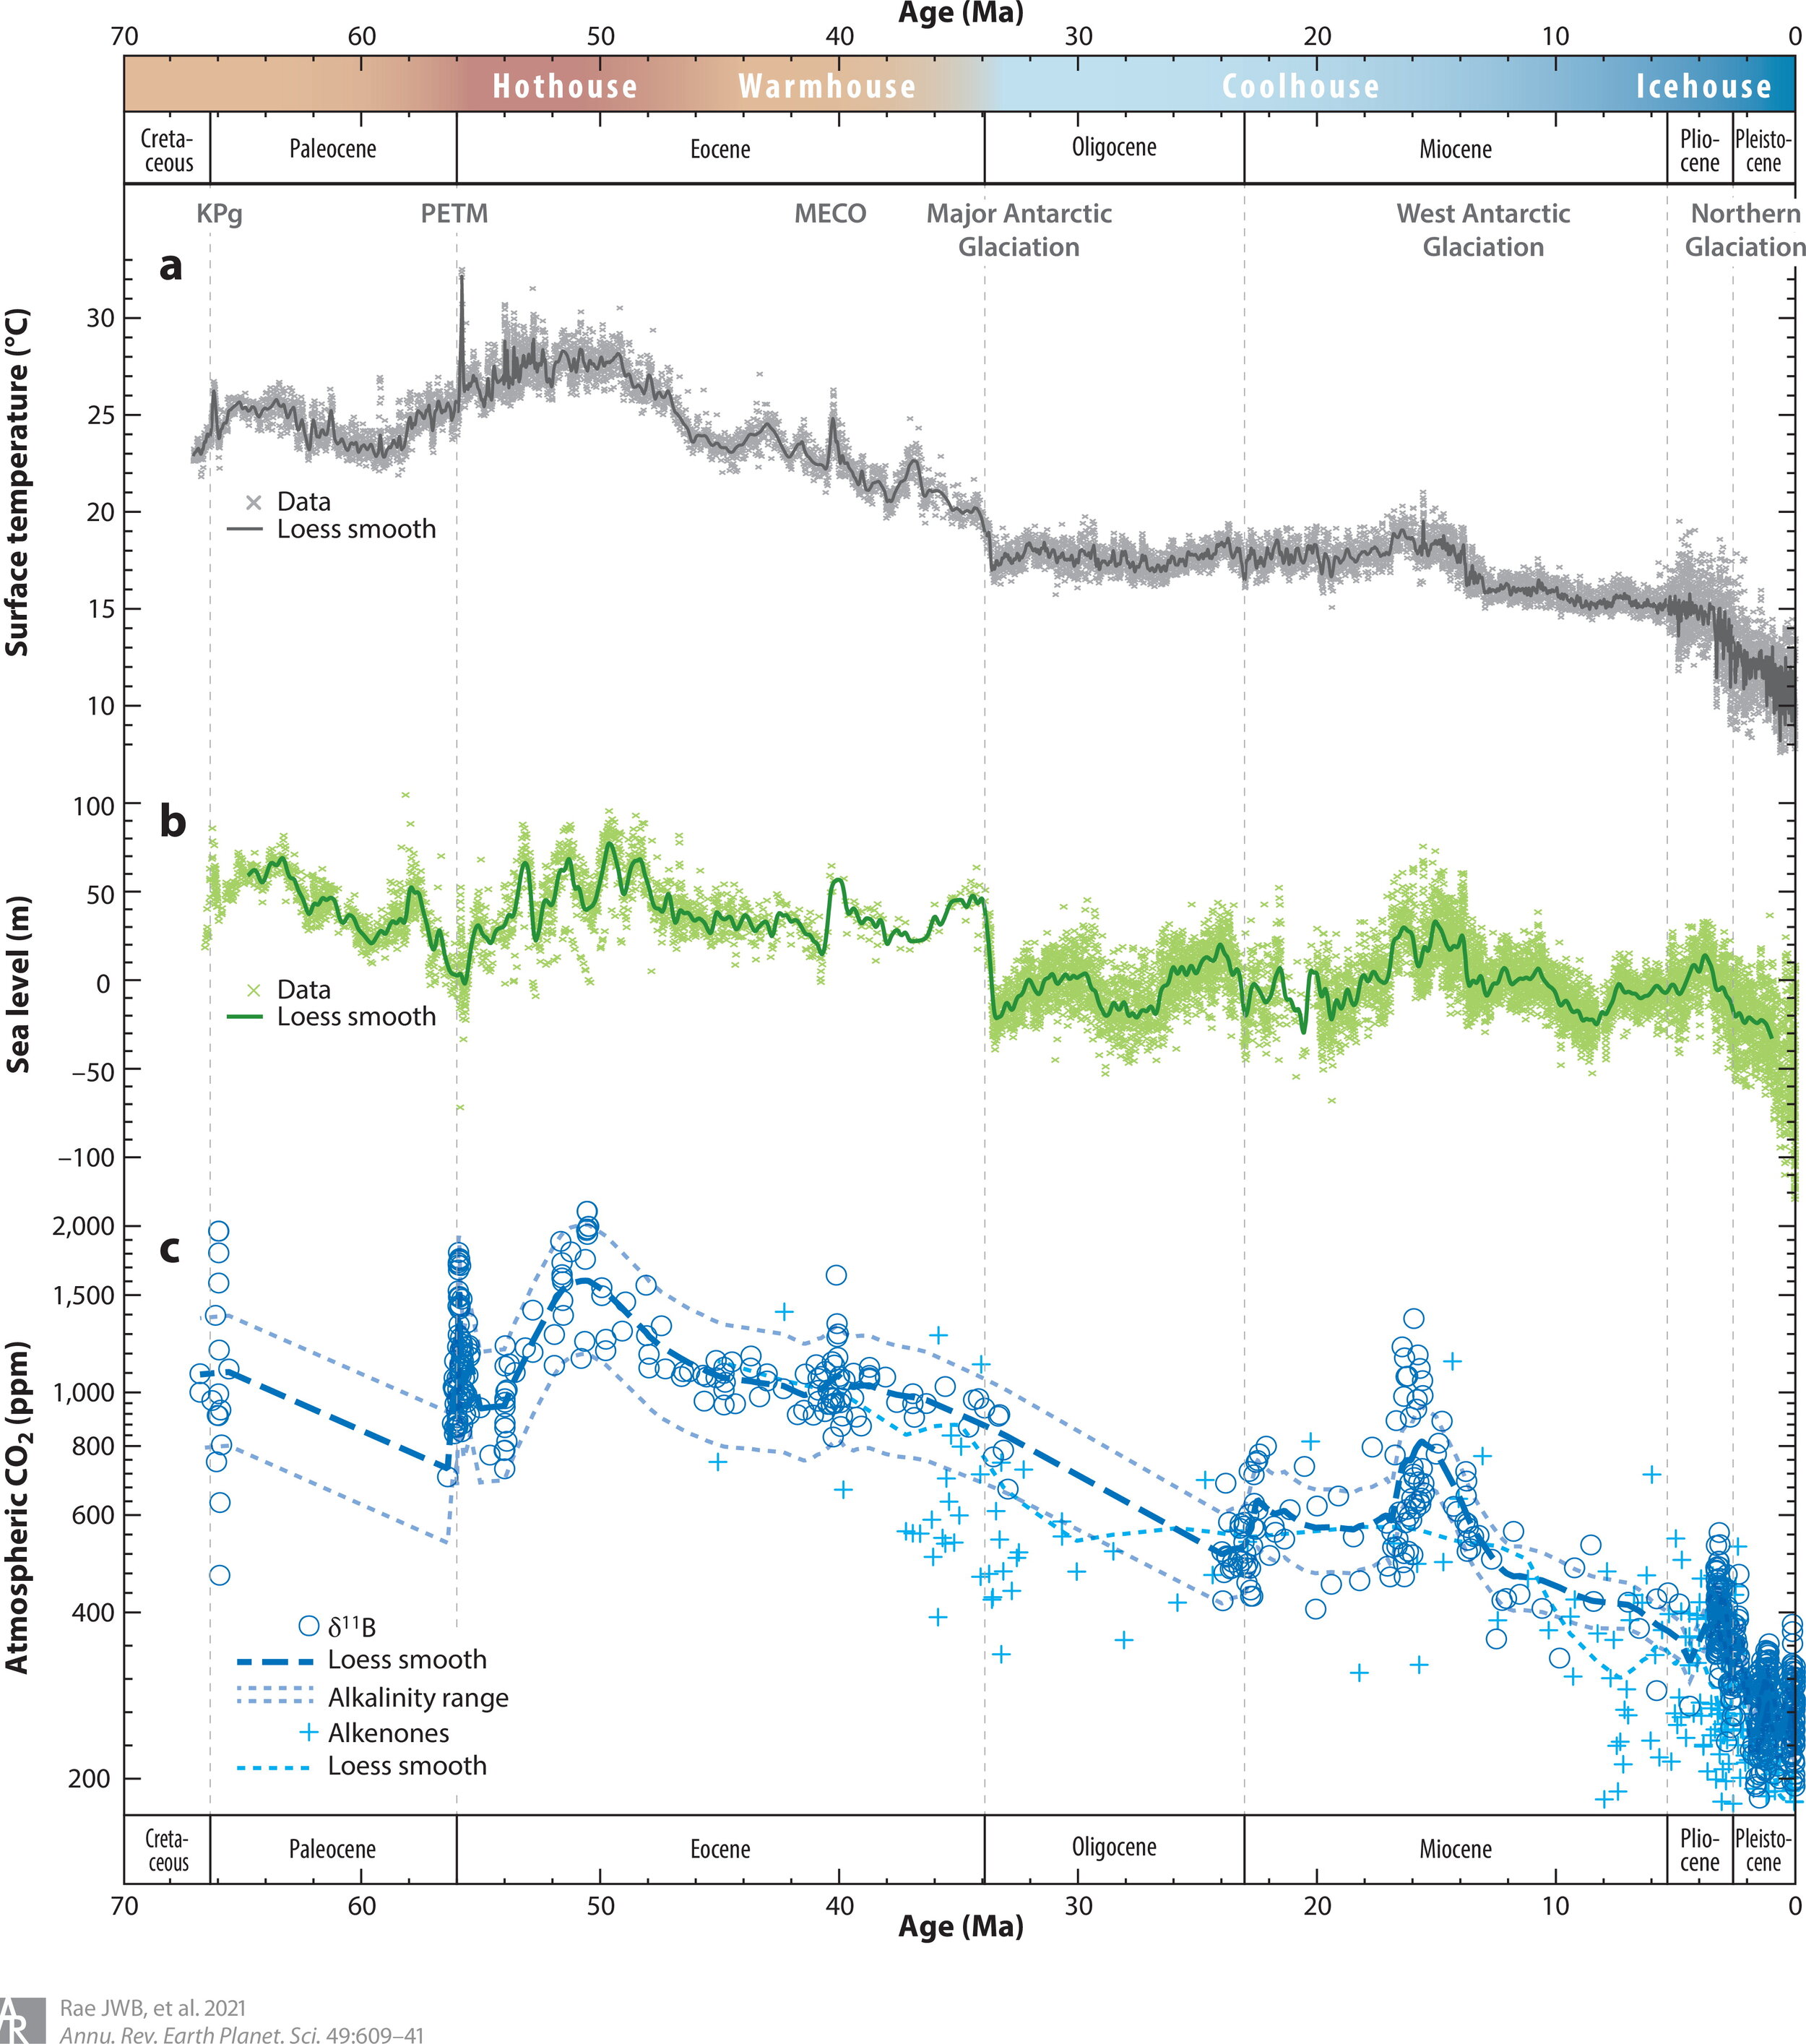
The SLR-ΔCO2 relationship is of course a paleoclimate thing, so may not be immediately relevant outside the Eemian or now we have a Panama Isthmus connecting N&S America. That said, the SLR-ΔCO2 relationship is usually a step beyond what most graphics provide, but fig 6 of Rea et al (2021) 'Atmospheric CO2 over the Past 66 Million Years from Marine Archives' does provide us a ΔT-SLR-ΔCO2 graphic. Note that they do not attempt to be definitive with this CO2 reconstruction, saying "While each method has uncertainties, these are largely independent, so their broad convergence on similar CO2 histories is encouraging."
But I stress the idea that paleoclimate stuff should concede precedence to glaciology when it comes to the melting ice caps today and glaciology is where the paper underlying the SkS OP above comes from, Box et al (2022) 'Greenland ice sheet climate disequilibrium and committed sea-level rise'. I read that paper as saying that, as of now (2000-19), Greenland is not tipped over into melt-out mode (which I think was always seen as requiring a little more AGW to do that tipping, but nonetheless is good news to hear said) and that the Greenland melt which we are committed-to will happen in the next several decades, not several centuries, and will be mainly over by 2100.
So at least for Greenland under the AGW so-far, my bug bear (that we are in denial ignoring massive SLR awaiting us post-2100) is assuaged.
Mind, the SLR thus awaiting from Greenland isn't trivial. And there is still Antarctica. And not forgetting we still have the tiny task of halting future AGW.
- Antarctica is gaining ice
Eclectic at 09:37 AM on 21 June, 2022My apologies, MA Rodger, for using the word "obsolete" , in describing the Zwally 2015 paper. I am guilty of achieving more brevity than wit.
And thank you for the Zwally (et al.) 2021 paper , illustrating the academic bun-fight re mass balance (too many buns for me to wish to digest).
However, it was amusing to see his wording: "... disparate estimates [of about 100 Gigatonnes per annum] of the [East Antarctic] mass balance have not been properly resolved."
Overall, my suspicious mind detected a whiff of rear-guard justification, with Zwally attempting to juggle isostatic changes / altimetric measurements / gravimetric measurements.
For me, the take-home message from all the Antarctic studies, is that the totality of the ice-sheet is in approximate stasis (plus or minus a few decades). And most importantly, Antarctica supplies no support for science-denialists who wish to claim that the south polar situation disproves the mainstream climate science.
- Antarctica is gaining ice
Philippe Chantreau at 09:09 AM on 20 June, 2022Andrew,
Your accusations are unwarranted. The recent exchange on this thread is a shining example of how some will believe assertions that are false, and will continue to believe them even after being shown without a shadow of a doubt that they are false. This behavior is contrary to a sincere scientific approach. It is not widespread among those who participate regularly on this site. The allusion to government bla-bla is rather ironic for 2 reasons. One is that you used a government agency as a source for your argument, and said government agency was publicizing scientific work headed by a government employee (Jay Zwally), pretty much the boss of glaciology at NASA. How did that irony escape you?
Second, because governments have taken so far no significant action and most of them can even be described as actively resisting change. Some may pay lip service and have plenty of nice sounding declarations, but actions are more important than words, and governmental actions have so far been tepid, at best.
I note that NASA has updated their position since publicizing the Zwally study, as well they should, because knowledge and understanding evolve and what matters is the weight of the evidence. I have no doubt that Dr Zwally thinks no different.
The Zwally study (full paper with that link) is a well known outlier. It was a surprising outlier back in 2015 when published and generated a lot of interest. In the 7 years since publication, it has been contradicted by numerous subsequent studies that benefited from the data from IceSat2 launched in 2018.
Because of that 2015 paper, there has been more scientific enquiry into this problem, which led to multiple publications. That is science at work. The Rignot et al (2018) paper is arguably one of the best researched, but there are plenty more:
wwhttps://www.science.org/doi/10.1126/science.aaz5845w.science.org/doi/10.1126/science.aaz5845
www.researchgate.net/publication/233806259_A_Reconciled_Estimate_of_Ice-Sheet_Mass_Balance (full article accessible as pdf)
About sea level:
I have worked in various areas involving science and engineering. Anecdote is no substitute for data and rigorous analysis.
Careful data gathering and analysis has been performed by numerous teams and, once again, there is an unmistakable convergence of results. Multiple scientific works can be fond in literally seconds on this subject.
It is entirely expected that see level not be uniform and that sea level changes vary by region. That variability itself is the subject of multiple studies.
- It's albedo
coolmaster at 01:54 AM on 5 September, 2021@Bob Loblaw
"useful extension"
They are not only a useful extension of the understanding of climate - but also the basis for recognizing where and how humans intervene (or could intervene) in the climate.
Fighting the causes of an evil (GHG emissions) is important and right - but is it actually enough? - I would say - NO. After decades of meditation on Mauna Loa Observatory / Hawaii GHG concentrations are still rising steeply.
So we urgently need a second, additional strategy that is potent enough to stop further global warming.
All possibilities that humans could have available are shown in the changing global radiation balances. There you not only find the disturbed carbon cycle, but also the energy flow of the global water cycle.
When looking at the actual problems (decreasing biodiversity, SLR, droughts, record temperatures, floods, ...) that humans and creation have to suffer with global warming, it is noticeable that they all mainly have to do with the presence or absence of water. The idea of influencing the climate via the water cycle is therefore only logical, more direct and, above all, much faster. (All firefighters in this world nod their heads understandingly)
Let me now briefly explain this alternative climate protection strategy, which does not care much about the causes (mainly CO² & other warming GHG), but should at least noticeably alleviate the above-mentioned effects and problems of climate change:
- 3.7mm SLR = 9mm over the land area = 1335km³ of water = 2.7% of the global runoff via the rivers.
- This volume can be retained by a wide variety of measures before it flows into the oceans and converted into evaporation.
- 9L / m² corresponds to ~ 1% of the average annual rainfall over land and should therefore create ~ 1% additional clouds over the land mass. Also a multiplication effect arises because there is a high probability that these clouds will in turn rain down again over a (different) area of land.
- The net effect of the clouds(CRE) is given by Prof. M. Wild (ETH Zurich) as -19W / m². + 1% additional cloud cover over land (-0.19W / m²) corresponds globally to -0.07W / m² and is therefore a lot more than the current annual increase in radiative forcing.
!!! The rise in sea level and the rise in earth temperature would thus (in theory) be stopped. !!!
In the graphic below I tried to show the simulated additional amount of clouds and water(red numbers) in the radiation balance. I look forward to your criticism and assessment. - Thanks

- Volcanoes emit more CO2 than humans
Daniel Bailey at 07:53 AM on 13 August, 2021Here's what the peer-reviewed published literature shows, that humans produce 100x more CO2 than all Earth's volcanoes combined:
- Just two-one thousandths* of 1% of Earth's total carbon—about 43,500 gigatonnes (Gt)—is above surface in the oceans, on land, and in the atmosphere. The rest is subsurface, including the crust, mantle and core—an estimated 1.85 billion Gt in all.
- CO2 out-gassed to the atmosphere and oceans today from volcanoes and other magmatically active regions is estimated at 280 to 360 million tonnes (0.28 to 0.36 Gt) per year, including that released into the oceans from mid-ocean ridges.
- Humanity’s annual carbon emissions through the burning of fossil fuels and forests, etc., are 40 to 100 times greater than all volcanic emissions.
- Earth’s deep carbon cycle through deep time reveals balanced, long-term stability of atmospheric CO2, punctuated by large disturbances, including immense, catastrophic releases of magma that occurred at least five times in the past 500 million years. During these events, huge volumes of carbon were outgassed, leading to a warmer atmosphere, acidified oceans, and mass extinctions.
- Similarly, a giant meteor impact 66 million years ago, the Chicxulub bolide strike on Mexico’s Yucatan peninsula, released between 425 and 1,400 Gt of CO2, rapidly warmed the planet and coincided with the mass (>75%) extinction of plants and animals—including the dinosaurs. Over the past 100 years, emissions from anthropogenic activities such as burning fossil fuels have been 40 to 100 times greater than our planet’s geologic carbon emissions.
- A shift in the composition of volcanic gases from smelly (akin to burnt matches) sulphur dioxide (SO2) to a gas richer in odorless, colorless CO2 can be sniffed out by monitoring stations or drones to forewarn of an eruption—sometimes hours, sometimes months in advance. Eruption early warning systems with real-time monitoring are moving ahead to exploit the CO2 to SO2 ratio discovery, first recognized with certainty in 2014.
Regarding the release of CO2 from volcanoes:
"Earth’s total annual out-gassing of CO2 via volcanoes and through other geological processes such as the heating of limestone in mountain belts is newly estimated at roughly 300 to 400 million metric tonnes (0.3 to 0.4 Gt).
Volcanoes and volcanic regions alone outgas an estimated 280–360 million tonnes (0.28 to 0.36 Gt) of CO2 per year. This includes the CO2 contribution from active volcanic vents, from the diffuse, widespread release of CO2 through soils, faults, and fractures in volcanic regions, volcanic lakes, and from the mid-ocean ridge system."
https://www.sciencealert.com/humans-produce-100x-more-co2-than-all-volcanoes-combined
https://deepcarbon.net/scientists-quantify-global-volcanic-co2-venting-estimate-total-carbon-earth
http://elementsmagazine.org/past-issues/catastrophic-perturbations-deep-carbon-cycle/
Kelemen and Manning 2015 - Reevaluating carbon fluxes in subduction zones, what goes down, mostly comes up
de Moor et al 2016 - Short-period volcanic gas precursors to phreatic eruptions: Insights from Poás Volcano, Costa Rica
McCormick et al 2016 - Observing eruptions of gas-rich, compressible magmas from space
Johansson et al 2018 - The Interplay Between the Eruption and Weathering of Large Igneous Provinces and the Deep‐Time Carbon Cycle
Tamburello et al 2018 - Global-scale control of extensional tectonics on CO2 earth degassing
Lee et al 2019 - A Framework for Understanding Whole-Earth Carbon Cycling
Black and Gibson 2019 - Deep Carbon and the Life Cycle of Large Igneous Provinces
Kamber and Petrus 2019 - The Influence of Large Bolide Impacts on Earth’s Carbon Cycle
"pCO2 is a result of the balance between the rate of CO2 inputs through magmatic/metamorphic degassing and the rates of carbon removal via silicate weathering and organic carbon burial."
McKenzie and Hehe Jiang 2019 - Earth’s Outgassing and Climatic Transitions_The Slow Burn Towards Environmental Catastrophes
Mikhail and Furi 2019 - On the Origins and Evolution of Earth’s Carbon
Schobben et al 2019 - Interpreting the Carbon Isotope Record of Mass Extinctions
Suarez et al 2019 - Earth Catastrophes and Their Impact on the Carbon Cycle
Werner et al 2019 - Carbon Dioxide Emissions from Subaerial Volcanic Regions_Two Decades in Review
"All studies to date of global volcanic carbon dioxide emissions indicate that present-day subaerial and submarine volcanoes release less than a percent of the carbon dioxide released currently by human activities. "
- It hasn't warmed since 1998
Vonyisz at 03:52 AM on 23 April, 2021Thanks for your answers Eclectic michael sweet MA Rodger
I’m sorry if I was misunderstood when I called attention not to consider temperature as energy. I note that I consider this an important detail that cannot be ignored. I have quoted the sentences I have quoted in terms of method, of course I know, like everyone here, what has happened since then. I know that from a marketing point of view, it would sound pros and cons to describe global warming in ten powers and all this in Joules. It is easier to enter in degrees Celsius. But for that simplification, we are paying a high price. This is because we can easily liken an apple to an elephant. The temperature of the deep ocean is fundamentally determined by the amount of cold water: the largest "river" from the Arctic. „The total ocean heat content (all the way to the bottom) is probably a more scientific measurement but does not relate to people as well. Global warming warms the ocean all the way to the deepest depths. In general, the warming is slower the deeper you go.” – Sure?
„You follow that by the assertion that it is all about energy rather than temperature which is true but not greatly relevant as Ocean Heat Content is effectively a temperature thing.
And then you introduce the concepts of PE & KE.
Surely PE & KE are red herrings. Is there some part of the global system where mass is increasing in altitude? Are there parts of the global system where stuff is whizzing about faster? In energy terms, any such change globally (if at all) will be miniscule enough to be entirely irrelevant, thus the red herrings.” – E (pot) = m * g * h true or not? In terms of energy, it is important where (high and salinity) a 5 degree water in the ocean. In the same way, at different altitudes of the atmosphere, 5 degrees of air can be associated with different amounts of energy (the hidden energy of water vapor). This is not a joke, can we agree on that? Is the temperature almost energy? Are you serious? When tenth and hundredth of a degree Celsius changes are included in scientific articles, should we be generous and say that temperature is equal to energy? I understand that mathematical accuracy is different from physical accuracy. But this is an exaggeration. I think so. Although air temperature is significant in our daily lives, it is only one element of our sense of warmth. Other elements: wind, percentage of water vapor, temperature of surrounding objects, energy of current sunshine. It is not possible to snatch one of these five elements. On the other hand, in the energy balance of the earth’s surface (no matter how we determine what we include in it and what we omit), we can agree that the vast majority of energy is stored in the ocean. If we really want to study global warming, we need to look largely at the dynamics of the energy of the oceans. We don’t just need to be able to measure temperature changes. Not just the top 2000 meters. We need to explore the temperature profile of the entire ocean. We need to be able to examine the causality of the processes.
In any case, there is a need to justify why the temperature at the poles is rising much faster than around the Equator. If it is also about accelerating heat transfer, there is also a chance that the deep ocean will cool faster. Because water vapor at the poles does not interfere with radiation (in the atmosphere), and because the radiation is proportional to the fourth power of the temperature (in Kelvin), the radiation at the poles has multiplied into space due to global warming and other processes. Although some of the cold produced in this way also cools the air around the poles, here I find it important to mention here that some of the cold “disappears” for us into the depths of the oceans (especially the Atlantic Ocean). How much of this cooling cools the atmosphere and the upper ocean and how much of it deepens the deep ocean? This process will really "explode" when the Arctic ice disappears. I was looking for a scientific description of this (believe me), I haven't found it on the internet yet.
It’s a mystery to me how warmer water gets into the deep ocean, as you can read in many places. I know there are salt fingers, but they don’t affect the area below 3,000 feet. You wrote (and thank you) to ask only one question, only one. Here’s what we know about changes in energy across the ocean today? Not just the top 2000 or 3000 meters, but the whole ocean! What do we know about changes in the great ocean flow system? Thank you in advance for your answers.
- Climate's changed before
Daniel Bailey at 07:47 AM on 29 October, 2020
"Then the question is how long will it take for all that ice to melt"
Sea level rise from ice sheets continue to track worst-case (High scenario) climate change scenarios (discussion here, source paper here).

Which, charitably, means 2.0 meters SLR by 2100, given that the Greenland Ice Sheet has tipped into a negative mass balance state, Earth having lost 28 trillion tons of ice in the past 23 years and that Greenland is expected to exceed Holocene loss rates by 2100.

Typically, when climate scientists try to understand some of the expected future effects of global warming and climate change, they first look to the past. And in looking to the past, we can use the example of the climate transition from the icy depths of the Last Glacial Maximum into our current Holocene Interglacial to guide us. From about 21,000 years Before Present (BP) to about 11,700 years BP, the Earth warmed about 4 degrees C and the oceans rose (with a slight lag after the onset of the warming) about 85 meters.
However, the sea level response continued to rise another 45 meters, to a total of 130 meters (from its initial level before warming began), reaching its modern level about 3,000 BP.
This means that, even after temperatures reached their maximum and leveled off, the ice sheets continued to melt for another 8,000 years until they reached an equilibrium with temperatures.
Stated another way, the ice sheet response to warming continued for 8,000 years after warming had already leveled off, with the meltwater contribution to global sea levels totaling 45 additional meters of SLR.
Which brings us to our modern era of today: over the past 100 years, global temperatures have risen about 1 degree C…with sea level response to that warming totaling about 150 mm. Recently, accelerations in SLR and in ice sheet mass losses have been detected, which is what you’d expect to happen when the globe warms, based on our understanding of the previous history of the Earth and our understanding of the physics of climate.
Support for above:
https://www.nasa.gov/feature/goddard/2019/study-predicts-more-long-term-sea-level-rise-from-greenland-ice/
https://advances.sciencemag.org/content/5/6/eaav9396
https://climate.nasa.gov/news/2458/why-a-half-degree-temperature-rise-is-a-big-deal/
https://www.nature.com/articles/nclimate2923
https://www.nature.com/articles/ncomms9059
http://www.pnas.org/content/111/43/15296.short
https://www.carbonbrief.org/sea-level-research-says-only-a-brief-window-to-cut-emissions
https://climate.nasa.gov/news/2869/antarcticas-effect-on-sea-level-rise-in-coming-centuries/
https://www.pnas.org/content/110/4/1209
https://science.sciencemag.org/content/364/6444/eaav7908
https://advances.sciencemag.org/content/5/1/eaau3433
https://www.pnas.org/content/116/30/14887 - Climate's changed before
Daniel Bailey at 00:29 AM on 29 October, 2020Since we are discussing sea level rise, recent sea level rise is unprecedented over the past 2,500 years (Kopp et al 2016):

Anthropogenic forcing dominates global mean sea-level rise since 1970 (Slangen et al 2016):
"the anthropogenic forcing (primarily a balance between a positive sea-level contribution from GHGs and a partially offsetting component from anthropogenic aerosols) explains only 15 ± 55% of the observations before 1950, but increases to become the dominant contribution to sea-level rise after 1970 (69 ± 31%), reaching 72 ± 39% in 2000 (37 ± 38% over the period 1900–2005)"
Causes of sea level rise since 1900, from NASA and Frederikse et al 2020:

Takeaways:
1. Glacier-dominated cryospheric mass loss has caused twice as much sea-level rise as thermal expansion since 1900
2. The acceleration since the 1970s is caused by the combination of thermal expansion and increased Greenland mass loss
3. Ocean mass increases from land-based ice losses dominated the early 20th and 21st Century sea level rise record; ocean heating was the dominant component from 1970-2000
4. The closure of the 20th-century sea-level budget derived here implies that no additional unknown processes, such as large-scale deep ocean thermal expansion or additional mass loss from the Antarctic Ice Sheet are required to explain the observed changes of global sea level
Additionally, new research (Miller et al 2020) affirms modern sea level rise is linked to human activities, and not to changes in Earth’s orbit:
"Surprisingly, the Earth had nearly ice-free conditions with carbon dioxide levels not much higher than today and had glacial periods in times previously believed to be ice-free over the last 66 million years, according to a paper published in the journal Science Advances.
“Our team showed that the Earth’s history of glaciation was more complex than previously thought,” said lead author Kenneth G. Miller, a Distinguished Professor in the Department of Earth and Planetary Sciences in the School of Arts and Sciences at Rutgers University-New Brunswick. “Although carbon dioxide levels had an important influence on ice-free periods, minor variations in the Earth’s orbit were the dominant factor in terms of ice volume and sea-level changes — until modern times.”
Sea-level rise, which has accelerated in recent decades, threatens to permanently inundate densely populated coastal cities and communities, other low-lying lands and costly infrastructure by 2100. It also poses a grave threat to many ecosystems and economies.
The paper reconstructed the history of sea levels and glaciation since the age of the dinosaurs ended. Scientists compared estimates of the global average sea level, based on deep-sea geochemistry data, with continental margin records. Continental margins, which include the relatively shallow ocean waters over a continental shelf, can extend hundreds of miles from the coast.
The study showed that periods of nearly ice-free conditions, such as 17 million to 13 million years ago, occurred when the concentration of atmospheric carbon dioxide — a key greenhouse gas driving climate change — was not much higher than today. However, glacial periods occurred when the Earth was previously thought to be ice-free, such as from 48 million to 34 million years ago.
“We demonstrate that although atmospheric carbon dioxide had an important influence on ice-free periods on Earth, ice volume and sea-level changes prior to human influences were linked primarily to minor variations in the Earth’s orbit and distance from the sun,” Miller said.
The largest sea-level decline took place during the last glacial period about 20,000 years ago, when the water level dropped by about 400 feet. That was followed by a foot per decade rise in sea level — a rapid pace that slowed from 10,000 to 2,000 years ago. Sea-level rise was then at a standstill until around 1900, when rates began rising as human activities began influencing the climate.
Future work reconstructing the history of sea-level changes before 48 million years ago is needed to determine the times when the Earth was entirely ice-free, the role of atmospheric carbon dioxide in glaciation and the cause of the natural fall in atmospheric carbon dioxide before humans."
From the source paper, Miller et al 2020:
"High long-term CO2 caused warm climates and high sea levels, with sea-level variability dominated by periodic Milankovitch cycles.
Sea level rose in the Early Pliocene ca. 4.7 Ma, reaching highs that had not been consistently seen since the MCO. From a sea-level perspective, the Pliocene is marked by three intervals with sea level well (~10 to 20 m) above modern: 4.6 to 4.1, 3.9 to 3.3, and 3.3 to 2.85 Ma.
GMSL higher than 12 m above modern requires loss of ice sheets in Greenland, West Antarctica, and sensitive areas of East Antarctica, the Wilkes, and Aurora Basins. This interval is of keen interest, because global temperatures were >2°C warmer than today at times when atmospheric CO2 concentrations were on the order of those in 2020 CE (~400 ppm), and thus, the equilibrium sea-level state is relevant to ice sheet trajectories in coming centuries. The peaks between 3.9 and 3.3 Ma were even higher, reaching a peak of ~30 m during Gi13, and thus requiring some melting of the EAIS.
The development of a permanent EAIS by 12.8 Ma resulted in a change from responding to precession, tilt, and eccentricity to subdued to absent response to eccentricity and precessional forcing that had previously been strong; the 41-ka tilt cycle dominated ice sheet and sea-level response from ca. 12.8 to 1.0 Ma following the development of a permanent EAIS. During the mid-Pleistocene transition, very large, 100-ka paced LIS were amplified by 100-ka changes in CO2 from ~180 (glacial) to 280 ppm (terminations).
During the last deglaciation (ca. 19 to 10 ka), GMSL rise exceeded 40 to 45 mm/year, providing an upper limit on known rates of GMSL rise. Rates before radiocarbon ages are less certain, although the sea-level rises exceeded 10 mm/year during terminations. Sea-level rise progressively slowed during the Holocene until the late 19th to early 20th century when rates began to rise from near 0 to 1.2 mm/year in the early 20th century to a late 20th and 21st century rise of 3.1 ± 0.4 mm/year.
Sea level follows long-term trends of atmospheric CO2, with high sea levels associated with high CO2 and warm climates. CO2 played an important role with high CO2 maintaining warmth in the Eocene (with values >800 to 1000 ppm; associated with largely ice-free conditions and high sea levels. Generally, decreasing CO2 values during Middle Eocene to Oligocene led to cooling and glaciation, although a secondary CO2 increase at ca. 35 to 36 Ma may be associated with the late Late Eocene warming. The cause of the CO2 decrease over the past 50 Ma has been widely discussed and debated but must be due to long-term (107-year) changes in CO2 sources (e.g., higher CO2 associated with inferred higher ocean crust production rates) or more likely the effectiveness of sinks CO2 (e.g., increased weathering associated with uplift of the Himalayas or exposure of basalts in tropical regions).
Our records that suggest nearly ice-free conditions occurred during the MCO and are thus intriguing if this is an equilibrium state for warming levels that will be attained in this century or the next century under sustained greenhouse gas emissions.
Our sea-level history constrains cryospheric evolution over the past 66 Ma, with ice-free conditions during most of the Early Eocene, MECO, latest Eocene, and possibly the MCO, with ice sheets (up to 40-m sea-level equivalent) in the Middle to Late Eocene greenhouse and with continental-scale Antarctic ice sheets beginning in the Oligocene.
From 34 to 13.8 Ma, the EAIS varied from larger than today (sea-level ~35 m below present) to nearly ice-free (~50 m above present) but became permanent during the MMCT ca. 12.8 Ma."
Miller 2020, Figure 4, rotated once:

And the past 40,000 years, from Miller 2020, Figure 4 above:

- 2020 SkS Weekly Climate Change & Global Warming News Roundup #35
Eclectic at 10:55 AM on 7 September, 2020Gseattle , best if you exert yourself to making genuine points of argument, rather than use empty rhetoric (which is something that Moderators tend to zap). [ And yes, I do enjoy posting on this thread! ]
It would be helpful to readers (and possibly to yourself) if you clarified the underlying problem you have with Greta Thunberg.
Looking at the bigger picture : it sounds dramatic to say "200 species extinct every day". How accurate is that? ~ quite probably it is accurate enough for practical purposes (of guiding our actions).
Why probably? : well, there are many millions of species . . . and millions more of species which are not yet discovered/identified. The ecological balance has been tilted against these species, and so it is hardly surprising that you get a dramatic answer if you divide a very large Numerator by thousands of days.
We already know even prior to the current major warming . . . that the expanding human population has tilted the balance strongly ~ thanks to de-forestation, extensive agriculture, over-grazing, pesticide usage, etcetera etcetera. And we know from the paleo evidence, that the comparable rapid warming episodes of the past have caused massive extinctions.
IOW : at present, the plants & animals are being hit by a "Double Whammy". So you should not be surprised at the level of extinctions per day. And there seems little point in you arguing whether the "200 per day" might only be "100 per day".
The major concern is ~ What should be be done about these changes in the real physical world? Should we sadly shake our heads, and sit on our hands? Should we engage in a game of Trivial Pursuit, and spend our time discoursing about "200" or "50" or "100" ? Or should we look at the bigger picture, and avoid distractions, and take intelligent action?
What is your choice, Gseattle ?
- Scientists remember 'Koni' Steffen, glaciologist who died after fall into crevasse in Greenland
Doug Bostrom at 05:52 AM on 18 August, 2020Steffan's most recent publication Greenland surface air temperature changes from 1981 to 2019 and implications for ice‐sheet melt and mass‐balance change (coauthor) is here:
https://rmets.onlinelibrary.wiley.com/doi/abs/10.1002/joc.6771
Open access.
- Models are unreliable
ClimateDemon at 21:53 PM on 2 July, 2020I agree that over the past century, the state-of-the-art of modeling and simulation has grown by leaps and bounds, especially since the development of supercomputers in the 1980s. They have been valuable tools for research and development in general, not just climate science. It should be noted, however, that such models are meant to aid scientists in their understanding of certain phenomenon, possibly identifying causes and even making short-term general predictions. They are NOT meant for government use to generate long-term predictions (which no model can do reliably), and use them as a basis for carbon taxes and regulations.
In order for a model to accurately predict climate change, it must take into account the dynamics of atmospheric fluid motion, realizing that the atmosphere is not in thermal equilibrium. [If it were in thermal equilibrium, there would be a uniform temperature and humidity over the entire surface with no winds nor storms.] This involves solving the time-dependent equations of mass balance (equation of continuity), momentum balance (Navier-Stokes equation), and energy balance which is what is done in the climate General Circulation Models. This is a set of partial differential equations that are first order in time which are generally solved in time by some type of finite difference method given the initial conditions. Note that the terms "forcings" and "feedbacks" aren't even in the vocabulary. Therefore, if there is H2O vapor in the air, its greenhouse effect is accounted for in the energy balance equation. If there is CO2 in the air, its greenhouse effect is also accounted for in the same energy balance equation. The contributions from the H2O greenhouse warming will, of course, be much greater than those of the CO2 warming, but there is nothing to indicate that CO2 has any "control knob" effect.
The only model that predicts AGW and the CO2 control knob is the one used by Lacis et. al. 2010, the staff here at SkS, or wherever AGW is preached. This is a highly oversimplified, zero dimensional model in which the earth's temperature is represented by a single scalar value T, and the H2O vapor concentration is determined by the Clausius-Clapeyron equation at temperature T. This means that the entire globe is rigidly held to this one fixed value of temperature and corresponding value of humidity, which we know is false. Furthermore, it assumes (through the Clausius-Clapeyron equation) that H2O in its vapor state and condensed states are in constant thermal equilibrium with each other, which is also false. At this point, AGW advocates generally understand the (invalid) argument as to how CO2 becomes the controlling GHG even though it is much weaker than H2O vapor, so I won't repeat it here. In general, those who preach the doctrine that a non-condensable GHG can only be a “forcing” and a condensable GHG can only be a “feedback” have been duped by the fallacies and self-inconsistencies of this “carbon-in-control” model. Another false manifestation of this model is the frozen earth scenario where all CO2 is eliminated, and as a result, there is no non-condensable GHG in the atmosphere to provide the temperature forcing needed to put H2O vapor, the stronger GHG, in the air. As a result, the entire terrestrial greenhouse effect collapses since there isn’t any of either GHG in the atmosphere, thereby leaving an iceball of an earth behind. Aside from the highly anti-intuitive nature of this prediction, it would be totally impossible to test it.
So what should we do about this CO2 control-knob theory? Do we say "It's what the science says, so we must accept it since we are scientists.", or do we do some critical thinking and say "It took several false assumptions to make the control knob argument, so there are very likely problems with it."?
- Ice isn't melting
MA Rodger at 20:09 PM on 27 April, 2020Lawrence Tenkman @11,
The Ocean Heat Content measured down to 2000m is increasing at a rate in excess of 10Zj/year due to AGW. The global loss of ice mass is subject to a lot of variation year-to-year but to put some numbers down:-
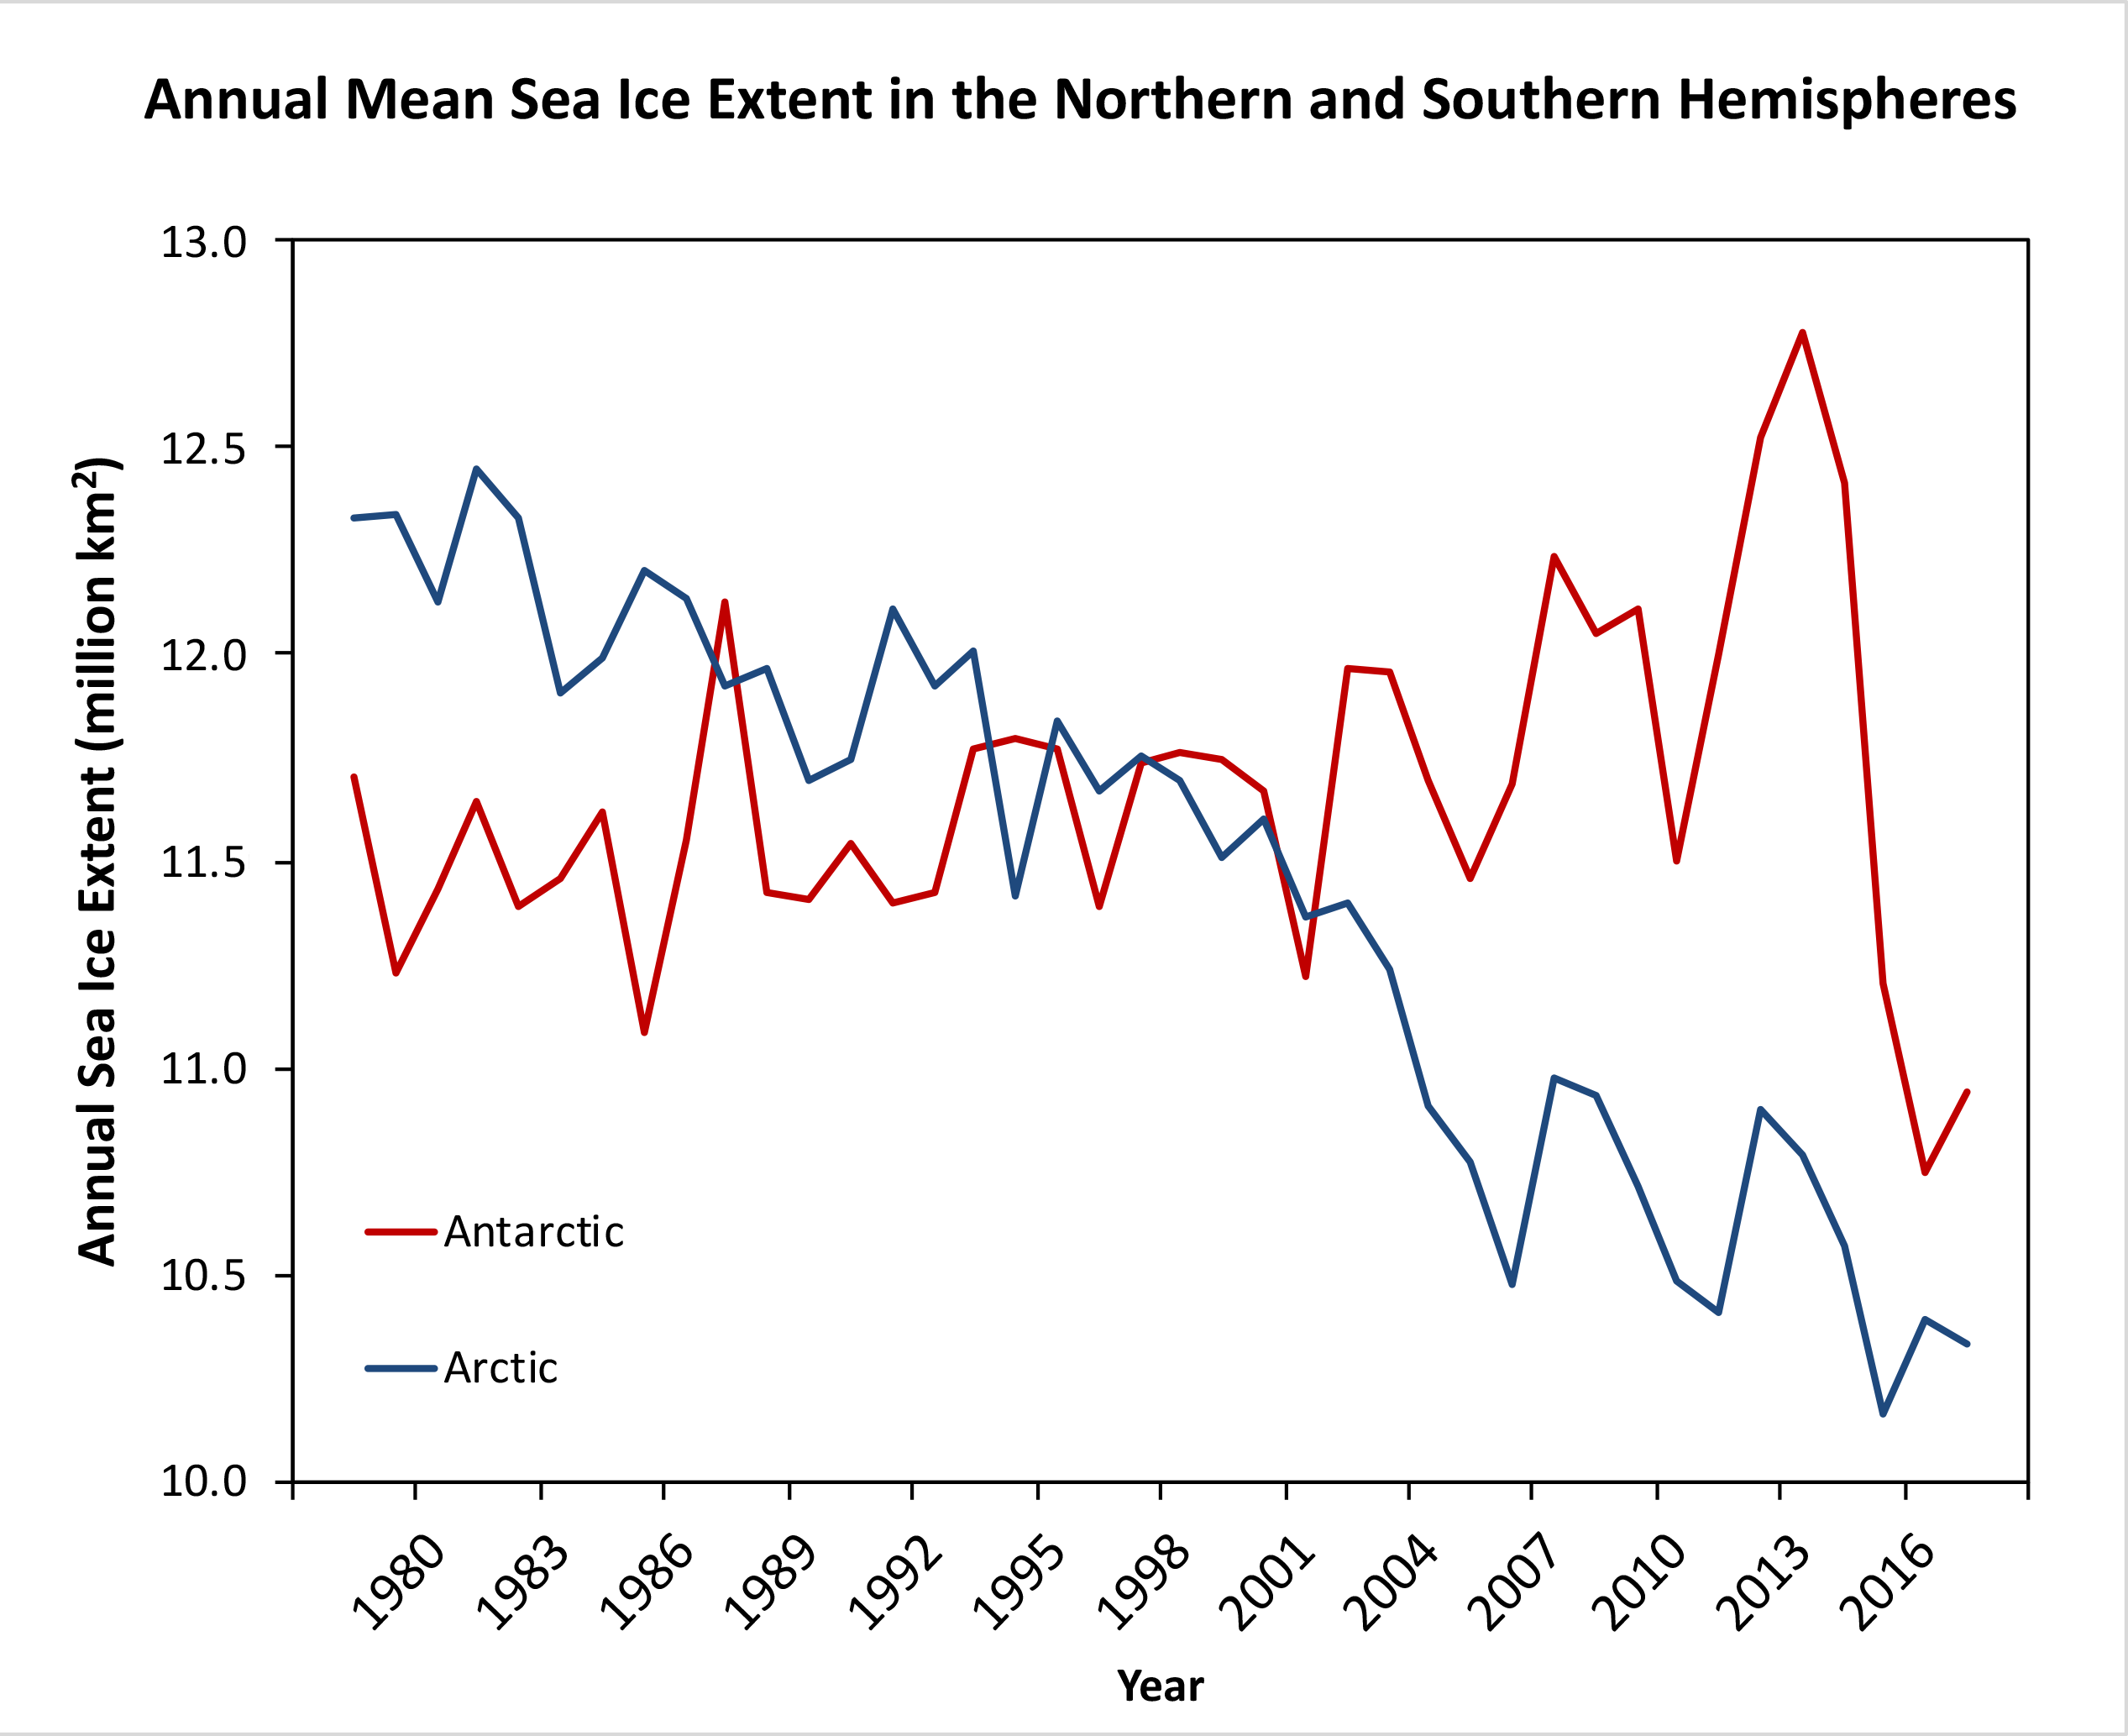
Sea Ice Arctic Sea Ice loss (from PIOMAS) averages 350Gt/y since 2007. Antarctic Sea Ice Volume is poorly assess but probably insignificant. (The small Antarctic areal increase to 2004 graphed in the OP was very minor. It became more pronounced for a while 2014-16 before plunging negative where it remains. The graph here is from NSIDC.)
Land Ice The dramatic acceleration of polar land ice in the OP graphs has not been maintained. With GRACE-FO beginning to give results (graph of Greenland mass balance), the recent combined rate of loss of global land ice has been assessed as something like 650Gt/year.
So the global ice loss is roughly 1,000Gt/year.
In terms of the energy to warm the resulting melt water up to average ocean temperatures, something like +4ºC, would require 0.015Zj/year, significantly less than the 10Zj/year annual increase in OHC. Energy to warm melt-water is also significanlty less than the energy required to convert that amount of ice into the melt-water (0.30Zj/year) but ocean-wise that would only affect icebergs melting out while bobbing on the briny sea.
Where all this melt water will play more of a role in global climate is it being fresh water and not briny. Note that the Greenland rate of gross ice loss is probably five-times greater than the rate of net ice loss and there is a lot of other fresh water entering the oceans from rivers and also the annual sea ice melts, but fresh water is more buoyant than ocean water and increases in the discharge of fresh water into the oceans can disrupt deep ocean currents, the AMOC (which brings warmth to the high Atlantic) being of particular concern.
- YouTube's Climate Denial Problem
nigelj at 12:28 PM on 12 April, 2020duncan61 @34, you claim some data supports sea level rise and some data says there is more ice, so presumably no sea level rise. You give no details or examples or sources.
Sea level rise is measured by both tidal gauges and satellite and they both unequivocally show sea leve rise. Satellites are also able to monitor the mass balance of ice sheets and show Greenland is losing ice dramatically and Antarctica is losing ice slightly. Glaciers are also monitored and most are losing ice. If you just bothered to read the appropriate information under secptical myths on the left side of this page you can get some details.
Now the denialist side of the debate typically make claims that glaciers are advancing, but if you read carefully they refer to just a small subset of glaciers, or they say sea ice is increasing somewhere when this doesn't actually affect sea level rise so its not relevant. Or they say Antarctica is not losing ice or much ice, while not mentioning that plenty of other places are. Or sometimes the denialists data is just made up.
None of this is new, in fact its now almost ancient history. I have several times explained these sorts of climate things diplomatically but you dont seem to get it. I cannot make you understand if you can't or won't, and I can't teach you critical thinking skills if you cant or wont.
We have tidal gauges and satellites and historical photos and god knows what all pointing to melting ice and sea level rise and its very hard for me to believe these systems of measurement and observation would all be 100% wrong because so many differerent monitoring systems show the same thing. I equally find it hard to believe its all some conspiracy. But perhaps you are built differently.
Personally I think you are just trolling for attention, and that you will come back with a whole lot of silly data.
- How I try to break climate silence
One Planet Only Forever at 12:03 PM on 10 March, 2020A long comment with details added for anyone interested.
My starting point, or foundation, is “Try to Help Others and Do No Harm”, with the awareness that Everybody’s actions combine to become the future. And being aware that compromising on understanding and its helpful application, or compromising on the required corrections, is understandably harmful.
I think it is essential for people to learn to be as helpful as possible and as harmless as possible. That means personally expanding awareness and improving understanding and applying what is learned to help develop sustainable improvements, and helping others do that. And voting helpfully, and helping others vote more helpfully, is a key part of that individual action.
Rather than provide examples of what I do I will share the basics of the approach I try to use to help others expand their awareness and improve their understanding and apply that learning to be less harmful and become more helpful. It is a work in progress, but this is its current form. (A recent example would be my comments on the “Silk Road article”).
A bit of personal Background:
I try to stick to the fundamentals of constantly improving awareness and understanding regarding any issue and applying what I learn to try to help others and avoid harm being done or reduce the risk of harm. I learned that was the foundation of being a Good Engineer. And it was reinforced by my MBA education which I pursued out of interest in expanded awareness and understanding to be helpful, not in order to get richer quicker.
My MBA education in the 1980s, and my engineering career, taught me that misleading marketing can be temporarily effective but eventually fails, so Good Managers should not use it. My MBA education also taught me that there were very few case studies of Businesses that were Helpful Good Ethical participants in society. Seems that the pursuit of popularity and profit can compromise good understanding and helpful intentions.
I live in Alberta, Canada. I often encounter people who don’t get climate science and the required corrections of developed human activity. Many appear to resist getting it because getting it would require them to give up beliefs and actions that they have developed a liking for.
What I try to do when given an opportunity to discuss climate change:
The following is an Idealized outline of my approach to a comment that initiates the opportunity to discuss human climate change impacts. I try to follow it to avoid getting sucked into a foundation-less argument. I also try to not ‘match the attitude’ of the person I interact with if they start to get angry. That can be difficult because mimicking is a good thing in an interaction when we are collaborating, but the Fight side of Fight or Flight seems to wire us to mimic the increased aggressive behaviour of the person we are engaged with.
I Start by establishing that:
- Everyone’s actions add up to become the future. This is key to inoculate against beliefs that Others should act first, especially that totally incorrect but very common demand that the Chinese and Indian populations are the climate change impact problem, rather than understanding that per-person impacts are the point. It also blocks someone from claiming the freedom to believe and do as they please because one person’s actions are no big deal.
- Improved awareness and understanding applied to help develop sustainable improvements and reduce harm done is a Governing Objective. This ties to my primary interest in raising awareness of the Sustainable Development Goals (all of the SDGs), and the key importance of limiting human climate change impacts.
- I see little point in further discussion without this fundamental awareness and understanding being established.
I then try to establish the following points of understanding, based on the source information I refer to (I am careful about referring to the IPCC or SkS. Many people seem to have developed an impulsive dislike of the IPCC and SkS, especially in Alberta):
- In the 1800s there was the initial development of awareness and understanding that GHGs in the atmosphere increase the temperature at the surface of the planet, and particularly that increased CO2 from the burning of fossil fuels could become a significant influence: I initially refer to Wikipedia History of climate change science. If there are questions about Wikipedia’s validity, I refer to the SkS History of Climate Science. That is a well-presented alternative to Wikipedia that has matching content and adds reference to “The Discovery of Global Warming” by Spencer R. Weart, and the Timeline webpage on the American Institute of Physics website.
- Evidence of recent increase in levels of atmospheric CO2: NOAA Greenhouse Gas Website (also shows trends for CH4, N2O and SF6)
- Evidence of recent increase of global average surface temperature: NASA/GISTemp data set (I refer to the SkS Trend Calculator if the person wonders about other temperature data sets, and I discussion the difference between surface temperature data and satellite data)
- Evidence of recent reduction of Arctic, Antarctic and Greenland ice extents and mass: NSIDC, particularly the Arctic Sea Ice News and Analysis page.
- Rising sea levels due to warming of oceans as well as loss of ice, not just Antarctica and Greenland: NASA Sea Level Change.
If I get agreement on those fundamentals, I bring up the Sustainable Development Goals and the understood need to achieve all of them through individual action, particularly getting individuals to vote for parties that will try to achieve the SDGs, all of them. And I point out that stopping climate change impacts of human activity is a major helpful action, because more significant human caused climate change makes it harder to achieve almost all of the SDGs.
I then return to discussing the fundamental objective of learning to help develop sustainable improvements and learning to stop harmful actions, tied to knowing that Everybody’s actions add up to the future (negatives if they are harmful). And I try to make the point that there is no neutral position. There is no harmless bystander. Harm is harm. It is not balanced by doing good. A rare exception is trying to help an individual in a way that may harm them – the medical intervention dilemma. Aside from that type of rare Ethical dilemma all other considerations are pretty simple Do No Harm, and Try to Help Others.
How I bring up climate change when given an opportunity to discuss any of the Sustainable Development Goals (there is so much covered by the SDGs that there are many opportunities for this type of discussion):
I use an approach that is similar to the climate change one above:
- Start by pointing out that Everyone’s actions add up to become the future. And Improved awareness and understanding ….
- Raise fundamental awareness and all of the SDGs, and the history of development of awareness and understanding that resulted in the SDGs: WWI – League of Nations (failure) WWII – UN, Universal Declaration of Human Rights (still a battle to have embraced and honoured by all Leadership) – everything since including Millennium Development Goals and SDGs.
- Once agreement of importance of achieving all of the SDGs is established introduce the importance of stopping human climate change impacts because climate change makes achieving the SDGs so much harder.
Regarding how people vote:
I find it challenging to get people I encounter to consider changing their vote. Even if I can get a person to understand and agree that the threat of climate change impacts requires significant corrections of what has developed popularity and profitability, it can be very difficult to get them to change what party they vote for. Many people in Alberta are motivated by the wealth that they have developed a liking for obtaining from the export of fossil fuels combined with the comfort, convenience and enjoyment they can get from using fossil fuels.
The majority of people in Alberta seem to have develop a liking for a certain type of political group based on uncritical identification, particularly just needing to see the Name Conservative or the political position being commented on as Right-wing (that type of party was Alberta’s leadership from 1931 through to 2015, and it returned to power in 2019). The recent time when a non-Conservative party won the leadership happened because there were two well-known Conservative Right-wing parties almost evenly splitting the Conservative/Right-wing votes (though the winning NDP did get a significant number of votes).
And many of those Conservative supporters seem uninterested in investigating the helpfulness/harmfulness of the current set of actions and intentions of the political group they developed a liking for. Their natural inclination is to resist change. And that can be powerful enough to make them resist learning, resist fully correcting or expanding their awareness and understanding. Even getting them to be very concerned about climate change may not be enough to get them to change who they vote for. Some of them seem so ‘identity locked-in’ that they may dislike many of the current actions and plans of the party they developed a liking for, but they will still support it, accepting and making-up poor excuses for the harmful cheating actions and incorrect misleading claims made by Their Party because, well, it is Their Party and they want it to Win, they resist changing their mind (much like sports fans can excuse harmful cheating behaviours by Their Favourite Teams).
I have tried to help them understand that the party they are supporting may have harmfully changed from what they developed a liking for. It may have moved to embrace the support of harmfully self-interested people and that change will damage the Brand they like to identify with. To be fair, many of them probably like their Party because of a harmful self-interest, but they are unlikely to openly admit it.
Based on reading international political news I am quite sure that this also occurs with Right-wing parties and supporters in other nations. You may get them to understand climate science and the identified required corrections, but you are unlikely to get them to vote for a party that is not Conservative/Right-wing. And good luck getting them to succeed in pushing Their Correction Resistant Party to disappoint a significant portion of the Party’s dedicated motivated relied-on voter pool – all those who have a self-interest in personally benefiting as much as possible from the actions of the Party they support, especially the really rich supporters.
- Australia's wildfires: Is this the 'new normal'?
Eclectic at 11:32 AM on 19 February, 2020Mark Thomas , in my own simple understanding of things ~ deforestation has a global warming effect because woody carbon is released to raise the atmospheric CO2 level (and the replacement grasslands or cultivated fields are much lower in carbon mass . . . also, cultivated soil tends to lose some of its stored carbon, too).
OTOH, grasslands & farmland have a higher albedo, and thus some cooling effect ~ but not enough to counterbalance the CO2 effect. Then there are other complexities, such as the methane produced in rice-fields.
It would be difficult to determine whether small-region climate changes (e.g. in the Australian continent) could be brought about by deforestation. "Micro-climate" might well be cooled by evaporation from tall forests ~ but I am a touch sceptical about the evaporative difference between grassland/agri-fields and virgin land of the scrubby or semi-arid type (of which Australia has always possessed a vast amount).
Soil moisture may not be very important ~ since on dry lands the greater temperature during the day is counterbalanced by the lower temperature at night.
- Welcome to Skeptical Science
One Planet Only Forever at 02:21 AM on 14 February, 2020JoeZ,
Regions like Massachusetts can get all of their energy from Hydro-power in Canada, just north of them. There is a massive potential up there. And not promoting its development and buying it at a price that is beneficial to "Canadians" is the sort of harmful Negative -Sum Competitive behaviour that the likes of Trump pursue. Negative-Sum Game Playing is pursuits of perceptions of superiority relative to others that actually make everyone, including the perceived winner, worse off.
All that is required is for people to realize that Internationalism is the Future, not the unrealistic and incorrect beliefs in American Exceptionalism, Manifest Destiny and the related foolish attitude of America First Competing to Win Any Way That Can Be Gotten Away With in pursuit of a return to those beliefs about Increased Personal Wealth being Proof of the Providence of God, and any failure being blamed on Those Infidels.
A lot can be learned by reading the knowledge shared by people like Jeffrey D. Sacks. His most recent set of knowledge sharing, through the past decade, is quite comprehensive. He provides evidence-based understanding of what is going on. And all of it is built on the expanding awareness and understanding of Sustainable Development, developments that will provide lasting improvements for humanity.
The key is understanding the need to constantly achieve and improve on:
- Economic Growth - Measured as Improvement of life circumstances which is understood to not be measured by GDP. A more accurate indication is elimination of poverty.
- Social Inclusion - Understanding and accepting a robust diversity of ways of being human.
- Environmental Sustainability - The total actions of the entire global population being less than the understood sustainable planetary impact boundaries. Each nation doing what is best suited in their region.
Achieving what is required requires Good Governance, not limited government focused on building the military might to "be balanced with perceived military threats" or the more troubling belief that a nation's best future is achieved by being the "potentially most harmful pursuer of perceptions of superiority on the planet"
Expanded awareness and understanding directed towards helping develop sustainable improvements for the future of humanity leads to the clear understanding of the need for collaborative altruism to govern and limit the powerful tendency for people to be divisively Individualistic and harmfully Tribal.
There is a high likelihood that many people who resist learning about and accepting the developing constantly improving understanding of climate science are motivated by a harmful developed personal interest. They resist understanding that they really should change their mind and give up undeserved perceptions of prosperity and opportunity.
- Sea level rise is exaggerated
Daniel Bailey at 09:28 AM on 1 December, 2019Not sure what your definition of "uniformly even" is. Did you expect them to be so?
Firstly, global sea level rise is a global average and the surface of the oceans are anything but level (the surface of the oceans follow the gravitic shape of the Earth and are also subject to solar, lunar, sloshing and siphoning effects and oceanic oscillations, etc, all of which need to be controlled for).
From the NCA4, global average sea level has risen by about 7–8 inches since 1900, with almost half (about 3 inches) of that rise occurring since 1993:

From NOAA STAR NESDIS:

"Only altimetry measurements between 66°S and 66°N have been processed. An inverted barometer has been applied to the time series. The estimates of sea level rise do not include glacial isostatic adjustment effects on the geoid, which are modeled to be +0.2 to +0.5 mm/year when globally averaged."
Regional SLR graphics are also available from NOAA STAR NESDIS, here.
This is a screenshot of NOAA's tide gauge map for the Western Pacific (NOAA color-codes the relative changes in sea levels to make it easier to internalize):

Clicking on the Funafuti, Tuvalu tide gauge station we see that sea levels are rising by 3.74 mm/yr (above the global average) there, with a time series starting around 1978 and ending about 2011:

However, the time series used by your BOM link for Funafuti (1993-2019) is shorter and the BOM also does not apply a linear trend line to it like NOAA does:

Feel free to make further comparisons, but comparing a set of graphics with no trend lines vs those with trend lines is no comparison at all.
From the recent IPCC Special Report 2019 - Ocean and Cryosphere in a Changing Climate - Summary for Policy Makers, September 25, 2019 release (SROCC 2019), the portions on sea level rise:Observed Physical Changes
A3. Global mean sea level (GMSL) is rising, with acceleration in recent decades due to increasing rates of ice loss from the Greenland and Antarctic ice sheets (very high confidence), as well as continued glacier mass loss and ocean thermal expansion. Increases in tropical cyclone winds and rainfall, and increases in extreme waves, combined with relative sea level rise, exacerbate extreme sea level events and coastal hazards (high confidence).A3.1 Total GMSL rise for 1902–2015 is 0.16 m (likely range 0.12–0.21 m). The rate of GMSL rise for 2006–2015 of 3.6 mm yr–1 (3.1–4.1 mm yr–1, very likely range), is unprecedented over the last century (high confidence), and about 2.5 times the rate for 1901–1990 of 1.4 mm yr–1 (0.8– 2.0 mm yr–1, very likely range). The sum of ice sheet and glacier contributions over the period 2006–2015 is the dominant source of sea level rise (1.8 mm yr–1, very likely range 1.7–1.9 mm yr–1), exceeding the effect of thermal expansion of ocean water (1.4 mm yr–1, very likely range 1.1–1.7 mm yr–1) (very high confidence). The dominant cause of global mean sea level rise since 1970 is anthropogenic forcing (high confidence).
A3.2 Sea-level rise has accelerated (extremely likely) due to the combined increased ice loss from the Greenland and Antarctic ice sheets (very high confidence). Mass loss from the Antarctic ice sheet over the period 2007–2016 tripled relative to 1997–2006. For Greenland, mass loss doubled over the same period (likely, medium confidence).
A3.3 Acceleration of ice flow and retreat in Antarctica, which has the potential to lead to sea-level rise of several metres within a few centuries, is observed in the Amundsen Sea Embayment of West Antarctica and in Wilkes Land, East Antarctica (very high confidence). These changes may be the onset of an irreversible (recovery time scale is hundreds to thousands of years) ice sheet instability. Uncertainty related to the onset of ice sheet instability arises from limited observations, inadequate model representation of ice sheet processes, and limited understanding of the complex interactions between the atmosphere, ocean and the ice sheet.
A3.4 Sea-level rise is not globally uniform and varies regionally. Regional differences, within ±30% of the global mean sea-level rise, result from land ice loss and variations in ocean warming and circulation. Differences from the global mean can be greater in areas of rapid vertical land movement including from local human activities (e.g. extraction of groundwater). (high confidence)
A3.5 Extreme wave heights, which contribute to extreme sea level events, coastal erosion and flooding, have increased in the Southern and North Atlantic Oceans by around 1.0 cm yr–1 and 0.8 cm yr–1 over the period 1985–2018 (medium confidence). Sea ice loss in the Arctic has also increased wave heights over the period 1992–2014 (medium confidence).
A3.6 Anthropogenic climate change has increased observed precipitation (medium confidence), winds (low confidence), and extreme sea level events (high confidence) associated with some tropical cyclones, which has increased intensity of multiple extreme events and associated cascading impacts (high confidence). Anthropogenic climate change may have contributed to a poleward migration of maximum tropical cyclone intensity in the western North Pacific in recent decades related to anthropogenically-forced tropical expansion (low confidence). There is emerging evidence for an increase in annual global proportion of Category 4 or 5 tropical cyclones in recent decades (low confidence).
B3. Sea level continues to rise at an increasing rate. Extreme sea level events that are historically rare (once per century in the recent past) are projected to occur frequently (at least once per year) at many locations by 2050 in all RCP scenarios, especially in tropical regions (high confidence). The increasing frequency of high water levels can have severe impacts in many locations depending on exposure (high confidence). Sea level rise is projected to continue beyond 2100 in all RCP scenarios. For a high emissions scenario (RCP8.5), projections of global sea level rise by 2100 are greater than in AR5 due to a larger contribution from the Antarctic Ice Sheet (medium confidence). In coming centuries under RCP8.5, sea level rise is projected to exceed rates of several centimetres per year resulting in multi-metre rise (medium confidence), while for RCP2.6 sea level rise is projected to be limited to around 1m in 2300 (low confidence). Extreme sea levels and coastal hazards will be exacerbated by projected increases in tropical cyclone intensity and precipitation (high confidence). Projected changes in waves and tides vary locally in whether they amplify or ameliorate these hazards (medium confidence).
B3.1 The global mean sea level (GMSL) rise under RCP2.6 is projected to be 0.39 m (0.26–0.53 m, likely range) for the period 2081–2100, and 0.43 m (0.29–0.59 m, likely range) in 2100 with respect to 1986–2005. For RCP8.5, the corresponding GMSL rise is 0.71 m (0.51–0.92 m, likely range) for 2081–2100 and 0.84 m (0.61–1.10 m, likely range) in 2100. Mean sea level rise projections are higher by 0.1 m compared to AR5 under RCP8.5 in 2100, and the likely range extends beyond 1 m in 2100 due to a larger projected ice loss from the Antarctic Ice Sheet (medium confidence). The uncertainty at the end of the century is mainly determined by the ice sheets, especially in Antarctica.
B3.2 Sea level projections show regional differences around GMSL. Processes not driven by recent climate change, such as local subsidence caused by natural processes and human activities, are important to relative sea level changes at the coast (high confidence). While the relative importance of climate-driven sea level rise is projected to increase over time, local processes need to be considered for projections and impacts of sea level (high confidence).
Projected Changes and Risks
B3.3 The rate of global mean sea level rise is projected to reach 15 mm yr–1 (10–20 mm yr–1, likely range) under RCP8.5 in 2100, and to exceed several centimetres per year in the 22nd century. Under RCP2.6, the rate is projected to reach 4 mm yr-1 (2–6 mm yr–1, likely range) in 2100. Model studies indicate multi-meter rise in sea level by 2300 (2.3–5.4 m for RCP8.5 and 0.6–1.07 m under RCP2.6) (low confidence), indicating the importance of reduced emissions for limiting sea level rise. Processes controlling the timing of future ice-shelf loss and the extent of ice sheet instabilities could increase Antarctica’s contribution to sea level rise to values substantially higher than the likely range on century and longer time-scales (low confidence). Considering the consequences of sea level rise that a collapse of parts of the Antarctic Ice Sheet entails, this high impact risk merits attention.B3.4 Global mean sea level rise will cause the frequency of extreme sea level events at most locations to increase. Local sea levels that historically occurred once per century (historical centennial events) are projected to occur at least annually at most locations by 2100 under all RCP scenarios (high confidence). Many low-lying megacities and small islands (including SIDS) are projected to experience historical centennial events at least annually by 2050 under RCP2.6, RCP4.5 and RCP8.5. The year when the historical centennial event becomes an annual event in the mid-latitudes occurs soonest in RCP8.5, next in RCP4.5 and latest in RCP2.6. The increasing frequency of high water levels can have severe impacts in many locations depending on the level of exposure (high confidence).
B3.5 Significant wave heights (the average height from trough to crest of the highest one-third of waves) are projected to increase across the Southern Ocean and tropical eastern Pacific (high confidence) and Baltic Sea (medium confidence) and decrease over the North Atlantic and Mediterranean Sea under RCP8.5 (high confidence). Coastal tidal amplitudes and patterns are projected to change due to sea level rise and coastal adaptation measures (very likely). Projected changes in waves arising from changes in weather patterns, and changes in tides due to sea level rise, can locally enhance or ameliorate coastal hazards (medium confidence).
B3.6 The average intensity of tropical cyclones, the proportion of Category 4 and 5 tropical cyclones and the associated average precipitation rates are projected to increase for a 2°C global temperature rise above any baseline period (medium confidence). Rising mean sea levels will contribute to higher extreme sea levels associated with tropical cyclones (very high confidence). Coastal hazards will be exacerbated by an increase in the average intensity, magnitude of storm surge and precipitation rates of tropical cyclones. There are greater increases projected under RCP8.5 than under RCP2.6 from around mid-century to 2100 (medium confidence). There is low confidence in changes in the future frequency of tropical cyclones at the global scale.
Challenges
C3. Coastal communities face challenging choices in crafting context-specific and integrated responses to sea level rise that balance costs, benefits and trade-offs of available options and that can be adjusted over time (high confidence). All types of options, including protection, accommodation, ecosystem-based adaptation, coastal advance and retreat, wherever possible, can play important roles in such integrated responses (high confidence).C3.1. The higher the sea levels rise, the more challenging is coastal protection, mainly due to economic, financial and social barriers rather than due to technical limits (high confidence). In the coming decades, reducing local drivers of exposure and vulnerability such as coastal urbanization and human-induced subsidence constitute effective responses (high confidence). Where space is limited, and the value of exposed assets is high (e.g., in cities), hard protection (e.g., dikes) is likely to be a cost-efficient response option during the 21st century taking into account the specifics of the context (high confidence), but resource-limited areas may not be able to afford such investments. Where space is available, ecosystem-based adaptation can reduce coastal risk and provide multiple other benefits such as carbon storage, improved water quality, biodiversity conservation and livelihood support (medium confidence).
C3.2 Some coastal accommodation measures, such as early warning systems and flood-proofing of buildings, are often both low cost and highly cost-efficient under current sea levels (high confidence). Under projected sea level rise and increase in coastal hazards some of these measures become less effective unless combined with other measures (high confidence). All types of options, including protection, accommodation, ecosystem-based adaptation, coastal advance and planned relocation, if alternative localities are available, can play important roles in such integrated responses (high confidence). Where the community affected is small, or in the aftermath of a disaster, reducing risk by coastal planned relocations is worth considering if safe alternative localities are available. Such planned relocation can be socially, culturally, financially and politically constrained (very high confidence).
C3.3 Responses to sea-level rise and associated risk reduction present society with profound governance challenges, resulting from the uncertainty about the magnitude and rate of future sea level rise, vexing trade-offs between societal goals (e.g., safety, conservation, economic development, intra- and inter-generational equity), limited resources, and conflicting interests and values among diverse stakeholders (high confidence). These challenges can be eased using locally appropriate combinations of decision analysis, land-use planning, public participation, diverse knowledge systems and conflict resolution approaches that are adjusted over time as circumstances change (high confidence).
C3.4 Despite the large uncertainties about the magnitude and rate of post 2050 sea level rise, many coastal decisions with time horizons of decades to over a century are being made now (e.g., critical infrastructure, coastal protection works, city planning) and can be improved by taking relative sea-level rise into account, favouring flexible responses (i.e., those that can be adapted over time) supported by monitoring systems for early warning signals, periodically adjusting decisions (i.e., adaptive decision making), using robust decision-making approaches, expert judgement, scenario-building, and multiple knowledge systems (high confidence). The sea level rise range that needs to be considered for planning and implementing coastal responses depends on the risk tolerance of stakeholders. Stakeholders with higher risk tolerance (e.g., those planning for investments that can be very easily adapted to unforeseen conditions) often prefer to use the likely range of projections, while stakeholders with a lower risk tolerance (e.g., those deciding on critical infrastructure) also consider global and local mean sea level above the upper end of the likely range (globally 1.1 m under RCP8.5 by 2100) and from methods characterised by lower confidence such as from expert elicitation.
To sum:
1. Global sea levels continue to rise, with the rise itself accelerating (due to an acceleration in land-based ice sheet mass losses). This will continue, for beyond the lifespans of any now alive.
2. Beware of the eyecrometer. It will deceive you, if you allow it to.

SLR Components, from Cazenave et al 2018
- Antarctica is gaining ice
michael sweet at 06:47 AM on 28 November, 2019Hi,
This myth is a little old now. Five or more years ago for a few years there was relatively high sea ice in the Antarctic. The record is not very long, only since 1979. Deniers claimed that since sea ice in the Antarctic was high, warming could not be occuring. In the past four or five years the ice area in the Antarctic has collapsed to the lowest in the record. This myth has gone out of fashion since now Antarctic sea ice is low. Land ice is also melting in the Antarctic.
To answer your question: It is believed that sea ice area in the Antarctic is strongly affected by winds. If there are a lot of offshore winds then new ice freezes near shore as existing ice is blown out to sea. Strong winds thus increase sea ice area. Around 2010 the winds in the Antarctic were stronger offshore than they had been before that time. It is not completely clear why the winds were stronger. It may have been due to natural variation or it may have been due to some climate change affect or the result of the ozone hole affecting wind. Now the winds are more similar to what they used to be and warmer ocean temperatures are melting more sea ice.
The land ice in the Antarctic is most strongly affected by the temperature of the ocean. As AGW warms the ocean the land ice melts faster where it enters the sea. This affect is slow to start because the ocean is warmed in the Tropics and then currents slowly move the warm water all the way to the Antarctic. Currently, especially in West Antarctica, the ocean is warming and melting the great ice sheet. The warmer ocean does not affect the sea ice as much as the wind did.
So if you have strong offshore winds the sea ice increases while increasing ocean temperatures melt the ice sheet. In general, the ice sheet is more important since if it melts hundreds of millions of people will be flooded, including much of Florida and other coastal states. Sea ice does not affect sea level.
There are more complications if you look more in depth. Warmer air causes snowfall to increase. If snowfall increases enough the East Antarctic ice sheet (which is much bigger than the West Antarctic ice sheet) may increase in size even as the edges melt faster from the warmer ocean. It is difficult to measure the exact balance of the East Ice sheet because it is so remote and cold and big. An error of a few centimeters per year would be significant.
Wunderground (weather blog) has had a series of blogs on measuring the snowfall in East Antarctic here is the last one. Currently it is believed that the East Ice Sheet is very slowly losing mass but that could change (either up or down) depending on how much CO2 is eventually emitted.
- Antarctica is gaining ice
Cedders at 18:28 PM on 15 October, 2019Comment 475 and its references are very helpful. Comment 452 is undoubtedly spam!
Zwally (2015) is still doing the rounds on social media, although there seems to have been much research reconciling it since. I also found the Scambos & Shuman comment, Martin‐Español et al (2017) (press release here), IMBIE (2018) highlighting the possible range of East Antarctica loss or gain, and then a couple for 2019 not directly linked in these comments so far:
- Shepherd, Gilbert, Muir, Konrad, McMillan, Slater, Briggs, Sundal, Hogg, Engdahl: Trends in Antarctic Ice Sheet Elevation and Mass, Geophysical Research Letters, 2019, DOI: 10.1029/2019GL082182
- data and animation here
- Eurekalert press
- Rignot, Mouginot, Scheuchl, van den Broeke, van Wessem, Morlighem: Four decades of Antarctic Ice Sheet mass balance from 1979–2017, PNAS 2019 116 (4) 1095-1103. DOI: 10.1073/pnas.1812883116
The Scientific American article "What to Believe in Antarctica’s Great Ice Debate" by Shannon Hall says 'Most scientists agree that East Antarctica—unlike its western counterpart—is gaining mass in the form of snowfall or ice'. I notice that Shepherd et al agrees with that (East Antarctica subtracting 1.1 ± 0.4mm sea level rise since 1992), but Rignot at al says E Antarctica has contributed 4.4 ± 0.9 mm in the same period. All the above agree that Antarctica as a whole is losing mass (mostly from glacier flow into the sea), but one study says three times more than the other.
- How the Greenland ice sheet fared in 2019
One Planet Only Forever at 02:31 AM on 8 October, 2019Another detailed presentation that is likely to have cherry-picking applied by climate science deniers and delayers.
The reported Surface Mass Balance is all they need to, want to, see and hear about. It indicates that Greenland ice is increasing, as long as the fuller story is never sought out.
- An exponential increase in CO2 will result in a linear increase in temperature
scaddenp at 14:52 PM on 13 June, 2019jesscars - Scientists are suckers for 1st law of thermodynamics. If you increase GHG, then you increase the radiation reaching the surface and you can predict exactly the spectrum change associated with it and measure it directly. If you want to invoke some hitherto unnoticed cause, then you have interesting problem of explaining why increased radiation doesnt increase temperature in violation of known physics. Secondly, if you seriously expect someone to accept a natural cause, then you need to explain where this extra energy is coming from. Not the sun, we measure its output directly; not the ocean - it is getting warmer too; no Milankovich - the 65N forcing has been negative for a long time.
Furthermore, CO2 increase in past ages as a result of temperature increase are a very slow feedback from bogs and oceans that wont start happening with current temperature rise for 100s of years (we hope anyway). We can tell that all increase in CO2 concentration is from emissions based on O2 decrease; isotopic composition of the carbon; and straight mass-balance from known burning of fossil fuels. Frankly you are clutching at straws rather than examining the science.
- Climate change: sea level rise could displace millions of people within two generations
Daniel Bailey at 00:23 AM on 13 June, 2019That graphic is from Kopp et al 2016. From that paper:
"The 20th century rise was extremely likely faster than during any of the 27 previous centuries"
Extremely likely = 95%.
We know that in the early 20th Century, about one-third of the observed warming is from human activities. This corresponds well to the observations from Kopp et al 2016. However, since 1950, pretty much all of the observed warming is from human activities. Thus, the closer we get to the present the greater the human-driven component of the knock-on effects of that warming (like SLR from land-based ice sheet mass losses due to that warming) becomes.
Per Slangen et al 2016,
Anthropogenic forcing dominates global mean sea-level rise since 1970
"the anthropogenic forcing (primarily a balance between a positive sea-level contribution from GHGs and a partially offsetting component from anthropogenic aerosols) explains only 15 ± 55% of the observations before 1950, but increases to become the dominant contribution to sea-level rise after 1970 (69 ± 31%), reaching 72 ± 39% in 2000 (37 ± 38% over the period 1900–2005)"
Takeaways:
1. Although natural variations in radiative forcing affect decadal trends, they have little effect over the twentieth century as a whole
2. In 1900, sea level was not in equilibrium with the twentieth-century climate, and there is a continuing, but diminishing, contribution to sea-level change from this historic variability
3. The anthropogenic contribution increases during the twentieth century, and becomes the dominant contribution by the end of the century. Our twentieth-century number of 37 ± 38% confirms the anthropogenic lower limit of 45%
4. This would increase even further if increased ice-sheet dynamics were considered to be a consequence of increased anthropogenic forcing (to 83% in 2000) and if reservoir storage and groundwater extraction were included (to 94% in 2000)
5. Our results clearly show that the anthropogenic influence is not just present in some of the individual contributors to sea-level change, but actually dominates total sea-level change after 1970
- Glaciers are growing
John Hartz at 04:19 AM on 28 March, 2019Supplemental reading:
Preliminary data reported from the reference glaciers of the World Glacier Monitoring Service (WGMS) in 2018 from Argentina, Austria, China, France, Italy, Kazakhstan, Kyrgyzstan, Nepal, Norway, Russia, Sweden, Switzerland and United States indicate that 2018 will be the 30th consecutive year of significant negative annual balance (> -200mm); with a mean balance of -1247 mm for the 25 reporting reference glaciers, with only one glacier reporting a positive mass balance (WGMS, 2018).
Alpine glaciers: Another decade of loss, Guest Commentary by Mauri Pelto, RealClimate, Mar 25, 2019
- Greenland is gaining ice
Daniel Bailey at 09:56 AM on 14 March, 2019Surface melt and snowfall mass balance are not the sum of the total mass balance equation by far. Because calving and discharge from the margins are not factored into that.
Per ther DMI:
And
Which brings it into good agreement with NASA:
"Data from NASA's GRACE satellites show that the land ice sheets in both Antarctica (upper chart) and Greenland (lower) have been losing mass since 2002. Both ice sheets have seen an acceleration of ice mass loss since 2009. (Source: GRACE satellite data)
Please note that the most recent data are from June 2017, when the GRACE mission concluded science operations. Users can expect new data from GRACE’s successor mission, GRACE Follow-On, in the summer of 2019."

- Greenland is gaining ice
MA Rodger at 05:56 AM on 8 March, 2019The silly fellow Molsen managed not to link to his two DMI said 'thises', so here are the links to the two 'thises' I assume were intended. They are both CarbonBrief posts of the date stated by guest authors Dr Ruth Mottram, Dr Peter Langen and Dr Martin Stendel from DMI.
The first 'this' (16/10/17) actually says of the 2017 melt year "This year, thanks partly to Nicole’s snow and partly to the relatively low amounts of melt in the summer, we estimate the total mass budget to be close to zero and possibly even positive." The "main culprit" was thus named as the snowfall brought to Greenland by Hurricane Nicole in October 2016.
The second 'this' (27/10/18) declines to be drawn on the 2017/18 total mass balance, deferring to GRACE-FO which was expected to be soon up-&-running in Oct 2018 although at time of writing GRACE-FO output data (rather than data collection) is yet to show itself.
So no sign of pronouncements that Greenland ice sheet "likely grew" throughthese years. Then perhaps there are other 16/10/17 & 27/10/18 Greenland news posts that do pronounce on Total Mass Balance, Or is Molsen misinterpreting Surface Mass Balance data?
- Greenland is gaining ice
scaddenp at 05:52 AM on 8 March, 2019Molsen - perhaps you could share the link which demonstrates your point? Knowing Heller, there are a no. of ways to cherry-pick data. Deniers often jump on Surface mass balance which is always positive (even in 2012) and last two summers have been high. The ice sheet gains more ice from precipation than melts every year. However, SMB doesnt take acount of calving losses which are what determine ice sheet mass. Your statement does not appear to be backed by the ice mass data seen here.
- A Green New Deal must not sabotage climate goals
RedBaron at 07:21 AM on 2 February, 2019@15 William,
With all due respect both your options listed are analogous to little more than rearranging the deck chairs on a sinking Titanic. This problem is not only about emissions. This is a carbon cycle. Trying to fix this by eliminating carbon emissions is tackling the problem with one hand tied behind our backs. It won't work, and several researchers have made the claim we already passed the point where that alone cant work. There are two sides to this and BOTH must be improved, less emissions and more sequestration.
You need to go back to basics and rethink what causes AGW to begin with.
- We are burning fossil fuels and emitting massive amounts of carbon in the atmosphere as CO2 mostly but also some CH4 and a few other greenhouse gasses.
- We have degraded the environmental systems that would normally pull excess CO2 out of the atmosphere. (mostly grasslands)
- By putting more in the atmosphere and removing less, there is no other place for the excess to go but the oceans. They are acidifying due to absorbing just part of the excess. (roughly 1/2)
- That still leaves roughly 1/2 of emissions that are building up in the atmosphere and creating an increased greenhouse effect. (from ~280 ppm to 412+ppm CO2)
So this leads directly to the way we must reverse AGW:
- Reduce fossil fuel use by replacing energy needs with as many feasible renewables as current technology allows.
- Change Agricultural methods to high yielding regenerative models of production made possible by recent biological & agricultural science advancements.
- Large scale ecosystem recovery projects similar to the Loess Plateau project, National Parks like Yellowstone etc. where appropriate and applicable.
TL;DR We need to reduce carbon in and increase carbon out of the atmosphere to restore balance to the carbon cycle.
Consider a third option,verified carbon offsets
- Money into the hands of farmers and land managers sequestering carbon in the soil
- Stimulates the economy
- Reduces food costs
- Improves food security for both rich and poor alike
- Simultaneously AGW adaptive and mitigation strategy
- Must be done anyway, so this is a simply way to fund it. 2 birds 1 stone
- Far more effective than either of the two you listed.
- Far less cost than either of the two you listed.
- Obtainable right now without the need for new unknown technologies.
- Not a redistribution of wealth scheme, but rather a public works project capable of gathering conservative political support as well as liberal political support.
In short, the carbon emissions sources will be paying for land managers to sequester their carbon footprint back into the earth where it belongs. This is a paid service, not a tax and liberal spend scheme with an ulterior social agenda.
And best of all? It's already set up and ready to go at the local government level. Just awaits funding. Pass the legislation and even in the most conservative of states it goes off and running immediately.
- The Methane 'Time Bomb': How big a concern?
Doug_C at 06:29 AM on 31 January, 2019Evan @7
Unfortunatley we are now in a position of triage having to decide what we can save and what resources we have to do so.
The loss of coral reef systems alone is going to have a profound effect on how life in the oceans behave. One quarter of marine species are dependent on coral reefs for some or all of their lifecycle. The oceans are the main lungs of the planet and home to most life here.
The loss of glaciers is going to also have major impacts on us and the ecosystems around us in many places. I'm from British Columbia and have been familiar with glaciers all my life and the rivers and lakes they feed. It's really sobering to think of a BC... and many other places... with little or no glaciers.
As a kid in the early 1970s I remember a family trip through Glacier national park on the Canada-US border and the many glaciers that gave the park its name. Most are now gone in a pattern repeated globally.
The polar ice sheets have already lost their stability and are losing ice at an incredible rate, far faster than models that treat them as solid blocks melting from the outside predicted.
And it goes on an on, we have upset a fundamental balance that determines one of the most important factors on Earth, how warm it is on the planet's surface. And it is still treated as a relatively minor issue by far too many people, many of them in positions that need to take responsible action, not keep promoting the same activities that have brought us here.
I also have family who work in the oil industry in Alberta and I get how important it is to people there. But it is incredibly frustrating to try to explain to people how what they are doing right now to meet their immediate needs is going to make it very difficult to impossible for them and their kids to meet those needs in just a few decades. With major emergencies along the way like the record flooding in southern Alberta in 2013 and the massive wildfires that burned down Fort McMurray in 2016.
There are real actions and solutions to this growing catastrophe but they require a willingness to change. Sadly something that is still lakcing in many people, who are somehow able to ignore the fact that the Earth is already changing now for the worst.
Real change to a low carbon sustainable energy and economic model has so many benefits that it no longer makes any sense at all to talk about fossil fuels as anything else but a disaster on a scale that makes CFCs, DDT and many other human created ecological and social problems minor in comparison.
- Republicans call for 'innovation' to tackle climate change, but it's not magic
John S at 11:23 AM on 12 January, 2019Evan@2 absolutely it is time for individuals as well as governments to take action, but I’m glad you said “as well as governments” because individual action is not enough. I don’t own a car and live in a small apartment downtown; but if I needed a car, I couldn’t afford an electric one. That’s an example of a government policy we need to “pull” (as Dana said) the market so that ordinary folks who must drive can afford to do so cleanly. In this case, it’s the capital cost not the fuelling cost that is a barrier, so it is the prime example, often quoted by Marc Jaccard, where we need a policy in addition to carbon pricing, e.g. to incent, nudge, coax, coerce or whatever is needed to get the auto makers to put more affordable EV’s on the market (including for non-personal transportation, i.e. buses, trucks, trains, ships and mobile equipment for mining, construction, forestry and agriculture). Some might also say subsidize them; but that becomes a reverse Robin Hood, which the previous government in Ontario learned to regret.
At the same time, still give carbon pricing some credit for providing part of that incentive if it is designed well, by which I mean increasing every year transparently, predictably and significantly until the problem is solved. This gives all planners firm, forward numbers for business plans. (Yes, the social cost of carbon is a straw-man, often quoted by those opposed to carbon pricing. It’s an academic red herring – what we really want to get to is the price that nobody will pay – we don’t know what it is, but know we’ll reach it if we keep increasing sufficiently every year). And, yes, the price will (should) get quite high, which is another reason all the revenue must be distributed to citizens, otherwise politics will prevent the price rising sufficiently high.
nigelj@3 quite right the issue is not innovation or regulation; the issue is how to incent both deployment of existing alternatives (as Dana said) and innovative development and deployment of new. There are 3 basic methods: regulations, subsidies and carbon pricing. I prefer the latter and could doubtless annoy the moderator with the number of words by which I could describe the inevitable pitfalls of the other two, which is not to say some may never be needed and I gave what I believe is the prime example of one we need above, i.e. some type of mandated quota for producing and selling zero-emission EV’s.
OPOF@7 paragraph 4, an example of the social cost of carbon straw-man fallacy to criticize carbon pricing in the first sentence, then the rationale of what is actually the carbon fee and dividend strategy in the second. As James Hansen said ”As long as fossil fuels appear to be the cheapest fuels out there, they will continue to be burned”.
RedBaron@9 distribution of dividend is not a flaw but essential to secure political future proofing. It’s also ethically sound (check out “Who owns the sky – our common asset” by Peter Barnes (2001), which is where the idea came from).
Even supposing that siphoning off revenue to fund the green illusions of the government of the day would prove to be politically secure (which it wouldn’t so I am over-arguing here) the effective, efficient use of such “apparently free money” is highly questionable. As the old saying goes “governments can’t pick winners, but losers can pick government’s pockets”.
OPOF@10 paragraph 1, in agreeing with RedBaron@9 you are (both) totally missing the point that rising costs of fossil fuels (due to carbon pricing) puts a bull’s eye, so to speak, on every product and service that relies on fossil fuels (and not just in the energy sector) for entrepreneurs/intrapreneurs to target with better and cleaner alternatives and the rising carbon pricing schedule gives them invaluable competitive information to develop and deploy those alternatives.
But then the balance of your comments seems to agree with the ideas I expressed above with the additional twist that you seem to suggest diverting dividends that would go to the wealthy to other actions. And I don’t have a big problem with that; in fact, I’d suggest the “just transition”, e.g. re-training if necessary, those fossil workers not ready to retire. I’d leave the development and deployment of products and services, especially products, to those who know what they are doing and are honestly incented by the higher prices available, driven by carbon pricing.
nigelj@11 I generally find myself in agreement with most of your (very frequent) comments but here’s one I’d challenge (partly); that carbon pricing can do nothing about draw-down. Sure, it may be a government subsidy, but the prevailing carbon pricing schedule provides a good bench-mark e.g. alerting potential proponents to the value of certain possibilities. There may also be a role for off-sets.
OPOF@17 paragraph 3, “rich people can pay … investors still profit”; I’d like to, again, stress the impact of carbon pricing is not only on consumers but also, and more importantly, in my view, on the producers or providers of goods and services; e.g. rich people may still be willing to pay top $ to fly around, but the airlines will have invented clean ways to enable them to do that; e.g. non-fossil derived jet fuel from biomass via methanol.
nigelj@18, notwithstanding how I introduced my comment on nigelj11, here is another one – the big failing of cap and trade is that it does not provide a clear, transparent, long-term forward price, which is invaluable for planners and investors in all types of alternatives to fossil fuels.
- Climate Change Cluedo: Anthropogenic CO2
alonerock at 10:40 AM on 17 December, 2018Excellent! Thanks very much for your clearification. I was confused because I would consider atmospheric emmissions as anthropogenic emissions. My apologies. My expertise is biogeochemistry and Holocene forsest ecology dynamics of the Central New Hampshire Region and as such, the climate change issue is of grave concern to me concerining abundance and distribution of species- so much so, that I have about 200 pages addressing it in one chapter of my book I have been writing for the past 20 years based on document, field and parol evidence of in excess of 500 sites I am studying.
The massive inertia of the ocean appears to be a serious problem for which naysayers do not account, enabling a huge lagtime for consequences. They will someday learn, nature bats last.
This is some non-scholarly text that I recently wrote for our local paper concerning climate change that you might enjoy:
Real Eyes Realize Real Lies
The True Story of Climate Change, Part I
Historically, the natural changes in global climate have occurred at rates that enable species to either survive by adapting, evolving, or relocating, or in the case of extreme events, species perish. With extinction comes consequences of reduced biological diversity and many other ecological problems.
The biological species that live on Earth are able to do so largely in part due to many complex biogeochemical relationships which include the precarious balance of energy coming into Earth from the Sun with that of the heat radiated back out into space.
Irrefutable scientific evidence indicates that commencing with human activities associated with the the industrial revolution, there has been an anthropogenic induced trend of more energy coming in to Earth than is being radiated back out into space. Until this energy balance is restored, the planet will continue to warm, and will do so at a non-typically increased rate.
The major reason for present climate warming is the elevated level of atmospheric CO2, which has not existed at current levels for in excess of 600,000 years. Destructive events associated with continued increasing atmospheric CO2 concentrations will include continually increasing global temperatures, increased intensity and frequency of storms and wildfires, increasing drought and flood events, rise in sea level and if carrying on business as usual, a mass extinction of species.
The climate change issue is a grave inter-generational matter in which the present generation, through their current production of comparatively inexpensive fossil fuel emissions, benefit briefly, while burdening future generations with the long-term negative and perhaps irreversible destructive ecological effects resulting largely from an irresponsible, decadent behavior.
The climate change issue is clouded by misinformation. The confusion stems largely from ignorance or greed. Most non-scientists lack the time, desire or ability to acquire a collective in-depth knowledge of chemistry, biology, physics, geology, botany, mathematics, oceanography, thermodynamics and meteorology which form the basic foundation necessary for understanding climate change. In recent decades, due to ignorance or dishonesty, the issues have been in many cases, tragically corrupted into a political tool to promote many socio-ecological failures involving concepts of world government, denial of problems associated with over- population and destruction of entire terrestrial ecosystems along with a re-distribution of wealth, all the while exhibiting a blatant disregard of long-term environmental consequences involving the burning of fossil fuels. Much of the misinformation peddled by scientific impostors and those of morally questionable economic interests or dark political agendas is carelessly accepted by people, many of whom lack the understanding, are unwilling to sacrifice their perceived luxuries, find the truth too disturbing to accept or fail to acknowledge a planet of finite resources and limited resilience. Such people often become easy prey for self-appointed climate change “expert” skeptics. Additionally, it is often difficult to get a person to accept the truth when their livelihood depends on denying it. The “American Dream” is in fact, largely based on the erroneous concept of unlimited natural resources.
Furthermore, a great deal of confusion regarding the understanding of climate change results from comparing unrelated temporal or spatial scales of weather and climate or cherry-picking data to support a particular position as well as a general misunderstanding of terms or concepts. It is all about statistics/trends- not individual events. Make no mistake, the distribution of extreme events is swiftly shifting inward on the “bell-curve”. Additionally, the delayed response of the climate system in and of itself further clouds the grasping of the immediate, necessary concerns to be recognized by the present generation.
Past global and national governmental “attempts” to successfully address the climate change issue have shared similar fates of failing miserably. The Clinton and Obama administrations were complete failures regarding this issue, as were the Kyoto Protocol and the Paris Accord. Nothing but talk, half-measures, corruption or irrational concepts at various levels… Ironically, the Montreal Protocol, with its successful goal of reducing Freon emissions to save atmospheric ozone, likely did more to slow the problem of global warming than all other attempts combined.Many conservatives appear to be worried about a failing economy and filling their coffers while most liberals are more interested in grabbing money for themselves, their friends and their favorite failed social agendas. This climate change issue is however not a political issue and in the absence of radical change in the near future, will devastate all, regardless of political aspirations. There is hope and there is still time to fix the problems, however the clock is ticking.
Suicidal policies of past executive and legislative branches of the United States are largely influenced by the fossil fuel industry and their influential lobbyists. Perhaps a wiser approach would be to address the matter through the U.S. Supreme Court based on language of the 5th Amendment of the United States Constitution of clearly challenging if not outright denying future generations of their “Life, liberty and pursuit of happiness”.
The United States has always been and will always be the greatest political experiment to exist in the history of the world due to its foundation of documents which embrace the concepts of the celebration of the human spirit, freedom, and accountability.
The United States, with many of the greatest minds in the world, has the ability to lead the world in a gradual shift toward cleaner energy which will lead to a stronger, stable economy and more importantly, a far improved environment. Anyone who thinks the economy is more important than the atmosphere should try counting their money while holding their breath.
. Wendell Berry once stated: “Nature is party to all our deals and decisions, and she has more votes, a longer memory and a sterner sense of justice than that of man.”
Anyone who thinks otherwise is gravely mistaken. Anthropogenically induced climate change is not a political issue. It is not a debate. It is a scientific fact. It is all about quality of life and leaving the place better than how we found it. We truly borrow the future from our children. Sometimes choices require sacrifice of perceived luxuries. We all have choices and those choices define us as a species.As Edmund Burke once suggested, “…evil prevails only if good men sit back and do nothing…”
Similarly, Gene Brewer stated in his book, “K-Pax”; a purported “alien” warns humans of their accountability by stating, “...the Universe will expand and collapse on itself...repeating this process forever...and every mistake you will live through again and again forever, so my advice to you is get it right this time around, because this time, is all you have.”
Perhaps the greatest legacy that this generation can pass on to the next is the acknowledgement that we “got it right with climate change.
In conclusion, the Earth will survive regardless of what humans do to it. Its survival however, might not include humans.Tick-tock, tick-tock….
- Breathing contributes to CO2 buildup
Lasterday at 23:08 PM on 7 October, 2018As a chemical engineer I feel it's misdirection to talk about the carbon cycle and say that an increase in human resperation does not add to atmospheric CO2. It may turn out to be a trivial amount, I'd have to find some numbers to guage it, but this post is meant to give a little background.
If all the carbon on earth were solid carbon and suddenly you changed it all to gaseous CO2 (this can't actually happen according to the gas law) and did this back and forth and back and forth according to the "carbon cycle" argument since there's no change in net carbon we are supposed to ignore atmospheric carbon going from nonexistant to "lots" and back again. "Hey - the cabon cycle is balanced." If more CO2 is put into the atmosphere from breathing the "cycle" itself gets bigger, the partial pressure of CO2 increases. Since biomass is a scrubber of CO2 (plants eat CO2) then there could be a net effect if the additional CO2 isn't eaten by plants. That's the issue. So to me, whipping out the carbon cycle doesn't make a whole lot of sense. My quick take is figure the volume of the atmosphere and the CO2 percentage and get that amount (huge # of moles) and then figure the amount in the resperation of 8 billion more people and see if the CO2 exaled from people is of the same order of atmospheric CO2. And keeping in mind that everything is an estimate - we don't know how many moles of carbon or anything else are on Earth. We don't know the exact volume of the atmosphere - they are estimates.
It may not factor in, but saying "the carbon cycle accounts for more breathing" is misdirection, it is just saying the net amount of carbon on Earth is staying the same, and that's not what the issue is. The net amount of gold on Earth is staying the same, too. Everything is - excepting new material from meterites and junk we send away in rockets that reaches outer space. We should be arguing about the partial pressure of CO2 in the atmosphere.
'Ol Wikepedia says this "The oceans of the world have absorbed almost half of the CO2 emitted by humans from the burning of fossil fuels." It's like soda pop - if the ocean warms slightly, CO2 is released into the atmosphere increasing the partial pressure of CO2. Since the CO2 level seems to be cyclic
https://climate.nasa.gov/climate_resources/24/graphic-the-relentless-rise-of-carbon-dioxide/
perhaps periodic ocean warming is the culprit. People argue that the older peaks are not as high as the current peaks, but remember the latest data is from direct measurement, the older values are taken from ice core samples and perhaps while the samples show higher CO2 values the peaks are lost from gas loses at the sample boundries, handling issues, etc.
Of course, industrial CO2 factors in. Let's run some real numbers!
- State of the climate: 2018 set to be fourth warmest year despite cooler start
Bob Hoye at 00:09 AM on 22 August, 2018Lengthy article.
I keep it simple for myself by following the Danish Met Institute (DMI) stuff. Their temperature of "North of 80" has been below the mean for most of the melt season. Their Surface Mass Balance of ice on Greenland has been well above the mean, and their chart of the rate of melt is shutting down fast. Well, this is on schedule.
The Canadian Cryogenic chart of NH and NA snow-cover extent for July and into August has been above the mean.
I think that these numbers are reliable, but my issue for the snow cover is that the charts are not updated every day. Seems to be every ten days.
- Should we be worried about surging Antarctic ice melt and sea level rise?
scaddenp at 13:08 PM on 13 July, 2018Tony, the figure is Fig 2 of Shepherd 2018 "Mass balance of the Antarctic Ice Sheet from 1992 to 2017".
Or here for open version.
- Trump should inspire us all, but not in the way you might guess
sauerj at 14:34 PM on 30 June, 2018@ villabolo #10
Thanks for the feedback. Very good point! Yes, from one person, I did encounter the reaction you describe.
Outcome of a small sample of verbal reactions: I have verbally given my "atom bomb" story to about 10 people (though I think it works better in written form, as in my FB note, linked above). Side Note: Most of these 10 people are either technical people (chemical engineers), or else folks already immersed in climate science & action (so, a very skewed slice of the overall population). It did "move" about half of them; "ho-hum" for another 1/3. But, for one notable person, my wife, it caused the exact same reaction that you described. She adoringly said, "You don't mean for me to believe that there are actually 10,000,000 atom bombs exploding all over the world every hour?" (so she got hung-up, right away, on step #1 of the story; without even getting to step #2, the thermal imbalance part (18k/hr); or step #3, man's consumption part (1k/hr)).To clearly describe the steps of this story (if you haven't yet read the FB note):
Step #1: The sun delivers to the earth 10mm hiro atom bombs of incoming energy per hour. All of this energy must leave for temperatures to remain constant [This latter part is another sticky, somewhat technical point, that I had to figure out for myself, as I was hung-up on the photosynthesis chemical energy (no-heat) part. But, eventually it dawned on me that even this chemical energy does become thermal energy, assuming equal bio-mass over time [when the chemical energy is converted to thermal energy by biological processes]. Presently, my write-up doesn't address this photosynthesis part of the energy balance story.]
Step #2: 18k hiro atom bombs per hour of the sun's incoming energy is restricted from getting out due to the increase in GHG's (primarily CO2). This part is easy to understand.
Step #3: 1k hiro atom bombs of energy is all of the energy that man consumes in 1 hour. … This puts #1 and #2 into perspective (which my write-up then goes on to give examples of perspective). This #3 perspective part is usually what gets a reaction out of people; here they start to put the scale of the thermal imbalance story into mental terms that they can viscerally relate to. And if they follow along so far, then, all of a sudden, the science becomes not just dry non-visceral words on the page, but a real, tangible kick in the gut, hopefully enough to ignite more impassioned energy toward climate action.My wife's reaction was not something that I had anticipated; it was completely different compared to my reaction in how this sequence (#1, #2, #3) profoundly (viscerally) affected me.
To fix this, I could try to explain the scale of what real, point-concentrated hiro atom bombs going off would be like. One option: Proportionally scale the sun's energy (10mm/hr bombs over the sunny side of the globe, 1/2 of its surface) down to 1 sq mile (the coverage of 1 real hiro bomb) and also down to 1 second (its blast duration, being conservatively long). How many hiro atom bombs of energy is the sun delivering to that 1 sq mile in 1 second of time? Answer: 0.0000283 equivalent bombs (or, maybe better said, 1/35000 of a real hiro bomb).
Another wording (I might try to figure out how to wiggle this into the document): "The sun delivers to a sq-mi plot of land in 10 hours what a real hiro atom bomb would deliver to that same sq-mi plot in 1 second." For me, that makes the sun's energy density sound like a lot; but, quite frankly, it is! But, obviously, NOT enough to decimate the land.Until I came up with the #1,#2,#3 atom bomb story, I was a bit foggy in having a deep technical understanding, in a visceral way, of the thermal imbalance, which is the fundamental basis for understanding what is causing global warming. I understood it in my head, but not in a scaled perspective sort of way, and also not in a way that I could convincingly explain it to others. Hansen has a picture of his grandchild (in his 'Storms' book) holding a 1-watt xmas tree light bulb, and he points out how this amount of thermal imbalance per sq meter is enough to cause huge instabilities to climate change. … This was a very endearing & tender picture, but this really didn't help me put the scale of the total thermal imbalance into clear perspective of scale. Was he trying to say that it was a lot of energy per meter, or that it wasn't a lot of energy per meter? … Now, with the help of the epiphany of my atom bomb story, I now know that 1-watt/sq-meter is not a lot of energy for that sq-meter, but is a lot of total energy over the whole globe (18k atom bombs/hr, and, more so, is 18x more than all the energy that man consumes) … [NOTE: 18k atom bombs is technically 0.6w/sq-meter (which I am getting from HERE).] But, without this, the lack of scale of perspective made it hard to put Hansen's story into relatable, useable or meaningful terms for me.
Although the atom bomb story (as stepped thru above) may not be effective for everyone, I have hope that it is effective for some people (maybe even many people). Enough so that it is one possible viable tool to help viscerally explain the fundamental science of global warming, yet still in a very scientific, factual way (no hyperbole). If it does work for anyone, it does so by giving people a meaningful scale of perspective that they can tangibly relate to and therefore internalize. … However, your constructive concern is very valid and is probably more of an issue than my small sample bias (w/ a skewed population) would lead me to believe. Thanks for the feedback!
- Sea level rise predictions are exaggerated
NorrisM at 09:47 AM on 1 April, 2018Bob Loblaw, Eclectic and michael sweet,
This has been an interesting journey, exploring what I will describe as the “conflicting views” on the future sea level rise “predicted” for the remainder of the 21st century. Let me say that I appreciate that my use of the term “predict” is used in a general sense and that many of what I refer to as “predictions” are in fact “projections” because they are predictions based upon certain assumptions relating to a number of things but most importantly, the level of CO2 emissions based upon the various pathways assumed by the IPCC.
The relevance of the views of a lawyer are on such a technical subject as “sea level rise” is certainly questionable but I suspect the interest of Bob Loblaw is simply because there are a number of legal cases that will be coming before the courts of the United States over the next few years and these cases will be adjudicated by lawyers and not physicists or other scientists. Having said that, there are many lawyers who have an engineering or scientific background before entering law so there may be some hope of having a scientist hear the case. In my case, my undergraduate degree was in the “dismal science”.
In researching this topic, I have largely focused on Chapter 13 of the IPCC Fifth Assessment (Fifth Assessment) and those portions of Chapter 3 dealing with sea level rise as well as blog information contained on this website on the subject as well as blog information on one other website (which does not carry much weight from most of the commentators on this website). I have also read the US Climate Science Special Report published in late 2017 (US Climate Report) as well as the very good RealClimate article on the Fifth Assessment (suggested by Bob Loblaw).
But before I delve into my impressions from these sources, I would also like to reference the discussion of “uncertainty” both in the Fifth Assessment and the US Climate Report. In both reports, the extent of understanding (and certainty or uncertainty about that understanding) is based upon levels of confidence (dealing with the consistency of the evidence and degree of agreement within the literature) and likelihood expressed probabilistically (based upon the degree of understanding or knowledge).
What I want to focus on are the levels of “Confidence”:
“Medium Confidence” means suggestive evidence (a few sources, limited consistency), competing schools of thought.
“High Confidence” means moderate evidence (some sources, some consistency) medium consensus
“Very High Confidence” means strong evidence (established theory, multiple sources) high consensus.
All of the definitions for uncertainty are found in the US Climate Report in the “Guide to this Report” which is easily located.
I think it is very important to keep these measurements in mind when analyzing the findings of the Fifth Assessment. When they use “Medium Confidence” they do not mean “medium consensus” because that term is reserved for “High Confidence”. Unless the term “Very High Confidence” is used then there is considerable uncertainty remaining.
So to commence this research the most logical place to begin is the Fifth Assessment projections found at Section 3.7.6:
"It is very likely that the global mean rate was 1.7 [1.5 to 1.9] mm yr–1 between 1901 and 2010 for a total sea level rise of 0.19 [0.17 to 0.21] m. Between 1993 and 2010, the rate was very likely higher at 3.2 [2.8 to 3.6] mm yr–1; similarly high rates likely occurred between 1920 and 1950."
Figure 3.14 of the Fifth Assessment shows the “bump” in sea level rates in the period 1920 to 1950. Given that the accepted view is that the rapid increase in the use of GWG’s only started after 1950, it seems incumbent on scientists to explain the “bump”. The only explanation I could find in the Fifth Assessment was that this “bump” was ”likely related to multi-decadal variability”. See Section 3.7.4. However, the natural question is if “multi-decadal variability” caused the increase in rates in the 1920-1950 period then why cannot the increase in rates found since 1993 of approximately 3.2 mm/yr also be attributed to multi-decadal variability? Or should not at least a portion be attributed to this internal variability, if only a portion, then how much?
So the Fifth Assessment found that it was “very likely” (read 90-100%) that the average rate of sea level rise since 1901 was 1.7 mm/yr. But before we get into the 3.2 mm/yr rate, we now have a number of papers since the Fifth Assessment that have suggested that the Fifth Assessment’s 90-100% assured estimate is all wrong and the real rate for 1901 to 1990 is 1.1 to 1.2 mm/yr. (Hay 2015 Dangendorf 2017). When asked by others how the IPCC could have got this so wrong, the answer seems to be that everyone is entitled to be wrong, that is science. I fully agree but it does not necessarily engender confidence in other “Very Likely” predictions or projections of the IPCC in the Fifth Assessment.
Perhaps the IPCC will, in the Sixth Assessment actually maintain its 1.7 mm/yr rate which I understand was similar to the AR4. Why do I say this? Because my understanding is that these “new” lower estimates are largely based upon a reanalysis of VLM. But here is what the Fifth Assessment has to say about VLM adjustments:
"High agreement between studies with and without corrections for vertical land motion suggests that it is very unlikely that estimates of the global average rate of sea level change are significantly biased owing to vertical land motion that has been unaccounted for. {3.7.2, 3.7.3, Table 3.1, Figures 3.12, 3.13, 3.14}"
So now on to the $64,000 question as to whether the observed acceleration in sea level rise since 1993 is an increase in the long term rate or is reflective of decadal variability or only reflects “apples and oranges” measurement issues with satellite altimetry compared to tide gauges.
We have disagreements both on the rate of acceleration and the causes of the acceleration.
Firstly, we have a disagreement between the Fifth Assessment estimates of what the acceleration rate is and the recent Nerem 2018 paper. From the Fifth Assessment, the acceleration is quite small with Ray & Douglas (2011) at -.002 to .002 mm/y, Jeverejeva (2008) at .012 mm/yr and Church & White (2011) at .012 mm/yr. Then we have Nerem (2018) re-evaluating things and coming up with .084 mm/yr. I do not propose to get into the technical disagreements that I have read on the Nerem (2018) paper but even extrapolating his acceleration, his projected 2100 sea level rise is somewhere around 65 cm close to the low range of the IPCC RCP8.5 estimate. Although I am not qualified to make any judgments, I suggest that anyone who is qualified should at least read the comments made by FrankClimate on the other website under the Part IV discussion on sea level acceleration. Without question, FrankClimate is technical. His comments have now been incorporated into the Part IV discussion. Would be interested to hear from Eclectic as to whether he disagrees with FrankClimate.
Secondly, we have questions of what is the cause of this recent acceleration since 1993. I had to ask myself why 1993 and not 1990? The obvious answer is that it is in 1993 that satellite altimetry came into the equation with the launch of the TOPEX satellite. Although I think there is general agreement that there are serious questions about whether the data from TOPEX for the first six years should be used at all (or for that matter even the remaining period for that satellite), my sense from looking at the NASA website is that the satellite altimetry is pretty well matching the tide gauges. I think there are a number of people who disagree with me on this but the average rates seem to match. But it is curious that where we see this very large increase in SLR is not at the land-based tide gauges but out in the middle of the oceans. It at least led me to ask myself whether this significant difference between the tide gauge measurements and satellite altimetry measurements in the middle of the oceans would have always been there if we could have measure it with satellites much earlier. I fully appreciate that the tide gauge measurements have shown an upward trend since 1980 (Section 3.7.4) but my understanding is that the large average increase during the satellite era can be attributed to the large increases found in the middle of some of the oceans, especially the Indian Ocean.
But back to attribution. A number of authors have suggested that the way to reconcile the “bump” in 1920-1950 and the increases since 1990 is to link these climate changes to multi-decadal variability, and specifically the AMO or the PDO. Here is what the Fifth Assessment has to say about this at 3.7.4:
"Several studies have suggested these variations may be linked to climate fluctuations like the Atlantic Multi-decadal Oscillation (AMO) and/or Pacific Decadal Oscillation (PDO, Box 2.5) (Holgate, 2007; Jevrejeva et al., 2008; Chambers et al., 2012), but these results are not conclusive."
Others have said that the increase in SLR since 1990 is not “statistically relevant” when looking at the long term sea level rise. In that respect, the Fifth Assessment does make the following statement immediately following the above quotation:
"While technically correct that these multi-decadal changes represent acceleration/deceleration of sea level, they should not be interpreted as change in the longer-term rate of sea level rise, as a time series longer than the variability is required to detect those trends."
For those who say that the acceleration should be attributed to AGW, they largely point to the increased rates of melting in the glaciers and the Greenland ice sheet and potentially catastrophic impacts relating to the West Antarctic Ice Sheet (WAIS). I cannot obviously get into discussing these topics without clearly being “snipped” for too long a post. In my view, having read the Fifth Assessment, the risk of “dynamic changes” in WAIS (there is virtually no risk with the topography of Greenland bedrock) are minimal. Here is what the Fifth Assessment has to say about the MISI hypothesis relating to WAIS at 13.4.4.3:
"In summary, ice-dynamics theory, numerical simulations, and paleo records indicate that the existence of a marine-ice sheet instability associated with abrupt and irreversible ice loss from the Antarctic ice sheet is possible in response to climate forcing. However, theoretical considerations, current observations, numerical models, and paleo records currently do not allow a quantification of the timing of the onset of such an instability or of the magnitude of its multi-century contribution."
As to the evidence of a retreat of WAIS, see Chapter 13 at 13.5.4.1:
"Although the model used by Huybrechts et al. (2011) is in principle capable of capturing grounding line motion of marine ice sheets (see Box 13.2), low confidence is assigned to the model’s ability to capture the associated time scale and the perturbation required to initiate a retreat (Pattyn et al., 2013)."
What this tells me is that there is a “theoretical” danger but so far we do not have any evidence of an actual retreat or the time frame over which this could occur. We cannot base our rational responses to AGW based upon theories which have not been supported with observational evidence.
As for the Greenland ice sheet, we know that the major warming was caused by warm waters appearing around Greenland and the impact that this has had on the melting of the ice sheet in the peripheries around the ocean at least from 1990 to 2012. My understanding is that this has been attributed to a decrease in cloudiness associated with the NAO which would mean that it was the increased insolation which caused the increase in the melting. Here is the discussion in FAQ 13.2 regarding the Greenland ice sheet:
"Although the observed response of outlet glaciers is both complex and highly variable, iceberg calving from many of Greenland’s major outlet glaciers has increased substantially over the last decade and constitutes an appreciable additional mass loss. This seems to be related to the intrusion of warm water into the coastal seas around Greenland, but it is not clear whether this phenomenon is related to inter-decadal variability, such as the North Atlantic Oscillation, or a longer term trend associated with greenhouse gas–induced warming. Projecting its effect on 21st century outflow is therefore difficult, but it does highlight the apparent sensitivity of outflow to ocean warming. The effects of more surface melt water on the lubrication of the ice sheet’s bed, and the ability of warmer ice to deform more easily, may lead to greater rates of flow, but the link to recent increases in outflow is unclear."
With the above information, the question that has been posed to me is where would I place the estimate of GMSL at 2100 compared to the Fifth Assessment (RCP 8.5) projection of .59cm to .98cm?
Firstly, it seems to me that during the 20th Century we had an almost linear rise in sea level as is acknowledged by the Fifth Assessment at 13.3.6 at p. 1159:
"GMSL rise during the 20th century can be accounted for within uncertainties, including the observation that the linear trend of GMSL rise during the last 50 years is little larger than for the 20th century, despite the increasing anthropogenic forcing (Gregory et al., 2013b)."
Here is a larger quote from the same Gregory paper:
“The largest contribution to GMSLR during the twentieth century was from glaciers, and its rate was no greater in the second half than in the first half of the century, despite the climatic warming during the century. Of the contributions to our budget of GMSLR, only thermal expansion shows a tendency for increasing rate as the magnitude of anthropogenic global climate change increases, and this tendency has been weakened by natural volcanic forcing. Greenland ice sheet contribution relates more to regional climate variability than to global climate change; and the residual, attributed to the Antarctic ice sheet, has no significant time dependence. The implication of our closure of the budget is that a relationship between global climate change and the rate of GMSLR is weak or absent in the twentieth century. The lack of a strong relationship is consistent with the evidence from the tide gauge datasets, whose authors find acceleration of GMSLR during the twentieth century to be either insignificant or small.”
This is consistent with the “Munk enigma” that he saw a near linear increase in GMSL during the 20th Century notwithstanding the impact of AGW only in the second half.
The Fifth Assessment RCP 8.5 assumes that in the second half of the 21st Century we will have what at least are “quadratic increases” if not “exponential increases” in the GMSL rate. I have no understanding of how a “quadratic curve” differs from an “exponential curve” and I do not have to notwithstanding all of the debate that I read on this issue on the “other website”. What I do know is that it is much steeper than a linear increase.
From Table 13.5 the Fifth Assessment has acknowledged that in the case of RCP 8.5 that in the period 2018 to 2100 they project an average sea level rate of 11.2 mm/yr for the mid-case and for the high case of .98 m the projected average rate is 15.7 mm/yr. See Section 13.5.1 at page 1180:
"The rate of rise becomes roughly constant in RCP4.5 and RCP6.0 by the end of the century, whereas acceleration continues throughout the century in RCP8.5, reaching 11 [8 to 16] mm yr–1 in 2081–2100."
Notwithstanding this projection, the Fifth Assessment acknowledges that this would exceed the average rate of 10 mm/yr during the deglaciation after the Last Glacial Maximum when there were massive ice caps over North America and Europe and Asia to supply the melt water (Chp13 pg. 1205):
"For the RCP8.5 scenario, the projected rate of GMSL rise by the end of the 21st century will approach average rates experienced during the deglaciation of the Earth after the Last Glacial Maximum."
The IPCC clearly understood this but did not explain how this could be achieved given the lack of such volumes of ice now (Chp 13 pg. 1185):
"The third approach uses paleo records of sea level change that show that rapid GMSL rise has occurred during glacial terminations, at rates that averaged about 10 mm yr–1 over centuries, with at least one instance (Meltwater Pulse 1A) that exceeded 40 mm yr–1 (Section 5.6.3), but this rise was primarily from much larger ice-sheet sources that no longer exist."
Grammatically, the phrase “but this rise ….” modifies the reference to 10 mm/yr and not 40 mm/yr.
The IPCC projection of sea level rise attributes the largest rise to thermal expansion, secondly to glaciers, and thirdly to the Greenland ice sheet mass balance loss and with a negative contribution by the Antarctic ice sheet.
As to the IPCC’s ability to adequately model dynamic changes to the Greenland and Antarctic ice sheets here is what the Fifth Assessment says at 13.5.4.1 pg 1187:
"As discussed in Sections 13.4.3.2 and 13.4.4.2, there is medium confidence in the ability of coupled ice sheet–climate models to project sea level contributions from dynamic ice-sheet changes in Greenland and Antarctica for the 21st century. In Greenland, dynamic mass loss is limited by topographically defined outlets regions."
Note the use of the term "Medium Confidence".
With all of the above research, given that I could not accept some of the projections of the IPCC for RCP8.5 (leaving alone the fact that RCP 8.5 is probably unrealistic given the changes we see in a move to renewable energy sources at least in the developed world) the question came down to what would I guesstimate the GMSL for 2100 if for some reason I was asked my opinion (which I was by Bob Loblaw).
For me, I would go back to the observations and look at where the sea level has moved since 1900 and assume that it will follow along the same largely linear path that it has pretty well followed since we have kept records in tide gauges. Taking Figure 13.27 of the Fifth Assessment and applying a ruler to the line, it projects out to about .4m by 2100. In other words, whatever impact CO2 emissions have had they are “baked in the cake”. What we see is what we will get.
Using the most recent date online at NASA, as of December 2017, we have had an 87.5 mm rise since 1993 representing an average rate of 3.2 mm/yr according to the NASA website. If we multiply this figure of 3.2 mm times 82 years, we arrive at around 26.24 cm of further rise if the rise continues to be linear. If you add this 26.24 to the .19 cm for the period 1900 to 1990 it totals 45.24 cm.
So my guess is that we probably will have a further 21 to 26 cm from now until 2100 representing somewhere around 8 to 10 inches of sea level rise. Unfortunately, I will not be around to see if I am right!
- Antarctica is too cold to lose ice
Onpimon at 01:35 AM on 30 March, 2018I agree with this article.I also had read an article from Boston globe, it’s an article about severe melting of ice sheet that is found in Antarctica. It’s said that a team of European scientists has found some ice sheet melting in East Antarctica during the summer months, in an area that is supposed to be too cold for perceptible ice loss. The ice sheets is weak throughout its structure. The glaciers is a large mass of ice, so it’s very hard to melt or it will take a long time to melt. But now it not take long time as in the past to melt. The glaciers are melting because of warming ocean water. Warming ocean water is caused by global warming. We have to solve this problem straightforward. In this article it’s said, we should all now at least remotely understand that mass balance changes in Antarctica aren’t reliant on surface melting but rather depend on dynamic responses such as the 2ndmechanism. I also have a question. Is it possible for melted ice to form its original ice form again?
- Greenland is gaining ice
Daniel Bailey at 21:01 PM on 27 March, 2018"But why Greenland is highly sensitive to warmer temperatures?"
Partly because, due to its latitude, it gets a lot of summer insolation from the sun (much more so than does the Antarctic Ice Sheet), and partly due to its proximity to warming ocean currents. Poleward convective energy transportation systems do the rest (helping to raise the ablation line higher up the ice sheet, driving further mass balance changes).
- How blogs convey and distort scientific information about polar bears and Arctic sea ice
ImaginaryNumber at 15:48 PM on 14 March, 2018Thank you all for your patience. I'm away from home, and have to fit in this extra-curricular activity whenever I can.
First of all, I haven't read a lot of what Crockford has written about polar bears. And I haven't read much of what her critics say about what she has said about polar bears. I'm hoping you won't mind just sticking, as much as possible, to the Pagano paper, and those Crockford papers that deal most directly with the Pagano paper. Thanks :)
Now back to the Pagano paper --
As I understood it, the study by Pagano, et al, was primarily designed to determine the how much energy polar bears expended during the yearly time period (late spring and early summer) when they typically put on the most fat. Nine female bears were caught and monitored for between 8 and 11 days, each year, in April of 2014, 2015, and 2016. During the study period, four bears gained 5% to 15% of their initial weight, four bears lost at least 10% of their initial weight, and one bear lost a very slight amount of weight. Pagano notes that--
"Bears that successfully killed and ate adult or subadult ringed seals either gained or maintained body mass, whereas bears that only scavenged or showed no evidence of eating lost mass."
From my reading of the Pagano paper, the major conclusion of the study was that polar bears expend about 1.6 times the amount of energy, during late spring/early summer, as had been previously estimated. Thus, to put on the fat needed to fast through the summer/autumn months, when they are land-bound and fasting, they need to be able to capture and eat more seals than other researchers had previously estimated. Clearly, not all of Pagano's polar bears were able to capture enough seals to meet their energy needs, at least during the observation period. This later point is important, because Pagano also noted that --
"previous researchers reported that 42% of adult female polar bears in the Beaufort Sea during the spring from 2000 to 2016 had not eaten for ≥ 7 days before capture."
— suggesting that historically polar bears are not always able to find food when they want it. Pagano then goes on to say that --
"This rate of fasting was 12% greater than measurements from 1983 to 1999, suggesting that spring ice conditions are affecting prey availability for polar bears even before the summer open water period."
Pagano concludes by saying that --
"These studies suggest that an increasing proportion of bears are unable to meet their energy demands. Our results indicate that further increases in activity and movement resulting from declining and increasingly fragmented sea ice are likely to increase the demand side of the energy balance ratio."
^^^^^^^^^^^^^^^^^^^^^^^^^^^^^^^^^^^^^
Now to Susan Crockford's critique.
Her primary concern with Pagano's paper was a lack of explaination for why the Beaufort polar bears were having trouble catching seals? Crockford claims that in the spring of the year ringed seals have their birthing lairs on the ice, and that in good years they should be relatively easy for bears to raid. But Pagano's paper only mentioned eating adult or subadult ringed seals (for the healthy bears), or carcasses (for the unhealthy bears) — but no pups.
Crockford provides a link to another paper she wrote in which she discusses the snow conditions under which ringed seal births are either successful or unsuccessful. She cites various research papers which show, for example, that when snow cover over the sea ice is deep, seal lairs are well-protected, bear predation is low, and bears became malnourished. Conversely, when snow cover is light, or when there is rain, seal lairs are easy to locate and break into, and bears are better fed. In that same paper Crockford also cites research which shows that when sea ice is very thick polar bears also have trouble finding enough to eat.
Now back to Crockford's more recent paper. She notes that Pagano makes no mention of ringed seal lairs or sea ice conditions in their paper. This seems to me to possibly be a critical omission.
Crockford then posts US Navy sea ice thickness maps for the Southern Beaufort Sea, for April 2014, 2015, and 2016. In all those years, but especially for 2014, there was a band of very thick (up to 5m) sea ice along the coast of Alaska. She suggests that this thick band of sea ice may have been critical to the study polar bears not finding sufficient nourishment.
Crockford also quotes from another paper (by Stirling) --
"Polar bears prey mainly upon ringed seals and, to a lesser degree, on bearded seals. Polar bears appear to be more abundant in polynya areas and along shoreleads, probably because the densities of seals are greater and they are more assessable. For example, between March and June in the Beaufort Sea from 1971 through 1975, 87% of the sightings of polar bears were made adjacent to floe edges or in unstable areas of 9/10 or 10/10 ice cover with intermittent patches of young ice.”
Stirling also says in the same paper:
"the influence of rapidly changing ice conditions on the availability of open water, and consequently on populations of seals and polar bears, has been observed in the western Arctic. Apparently in response to severe ice conditions in the Beaufort Sea during winter 1973-74, and to a lesser degree in winter 1974-75, numbers of ringed and bearded seals dropped by about 50% and productivity by about 90%. Concomitantly, numbers and productivity of polar bears declined markedly because of the reduction in the abundance of their prey species. … If the shoreleads of the western Arctic or Hudson Bay ceased opening during winter and spring, the effect on marine mammals would be devastating."
This suggests that polar bear foraging is best when there is a reasonable number of open leads, which is less likely when there is very thick sea ice. Again, is seems that Pagano was remiss in not including more information about sea ice conditions, and seal lair conditions.
^^^^^^^^^^^^^^^^^^^^^^^^^^^^^^^^^^^
My thoughts and questions:
Now that I've read Pagano's complete paper, and not just the abstract; and now that I've read two relevant papers by Crockford, it seems to me that Crockford is raising valid questions as to why some, but not all, of Pagano's polar bears were malnourished? Maximim sea ice extent occurs in mid-March, and maximum sea ice volume typically occurs in the later part of April. So lack of sea ice is certainly not the problem.
Did Pagano provide an answer in their paper that I (and Crockford) missed, or was their analysis of polar bear dietary habits and processes less than complete?
Likewise, has Crockford misunderstood seal breeding cycles, or misinterpreted the polar bear research that she cites?
As I understand it, if Pagano (and the news media which reported Pagano's findings) has just stuck with saying that their research showed that polar bears expend 1.6 times more energy than previously thought, Crockford might not have found anything to criticise. As it was, many concluded that because half the bears in Pagano's study were malnourished (at least during the 8-11 day study window, which apprently happens quite a lot — sort of a feast or famine situation for bears), that it must be true that all polar bear populations, at all times of the year, were also not finding enough to eat. While that concievably may be true, it appears to me that you can't infer that from Pagano's study, as Pagano didn't include a number of relevant factors in their study (e.g. sea ice thickness; snow thickness; number of open leads; relative abundance of seals, etc).
- Actions today will decide Antarctic ice sheet loss and sea level rise
chriskoz at 11:58 AM on 2 March, 2018Antarctica is now discharging 1.93 trillion tons of ice each year, up from about 1.89 trillion tons per year in 2008
When talking about SLR contribution, you should look at the ice mass balance, i.e. difference between accumulation and discharge. Accumulation number by itself is meaningless, esp. if warming sub-zeroC temperature results in higher snow precipitation. There is an abrupt tipping point though, when air temp reaches freezing point and snow turns to rain but Antarctica is far away from that point yet.
The only sentence about the ice balance in the article
When accounting for snow accumulation, the continent is losing about 183 billion tons of ice per year
Doesn't say how much the balance has been changing in the last decade and if the loss's been accelerating. Hansen 2012, for example claims that the loos has been doubling every 7-10 years and that's the number we should concentrate on here as we talk about SLR prediction as antarctic IS loss wil be dominant contribution to future SLR. But the number's missing in the article.
The interesting number to note though, is that ice mass exchange due to melting from below and accumulating from above is ATM 10 times bigger than the ice loss (simlarly to CO2 exchange with the ocean). I wonder if it's going to stay that way (i.e. snow precipitation steadily increases in the warming weather until an abrupt tipping point metionaed above) or we are going to see the ratio lowering as the gap in favour of melting inevitably increases. So far, the ratio is big enough so that, theoreticaly at least, we could slow down the melting by inducing more precipitation of we knew how (aerosol spraying?) before the radiation balance & climate is stabilised.
- Antarctica is gaining ice
Daniel Bailey at 07:44 AM on 22 February, 2018
"a outlier paper (Zwally 2015)"
Let's look at that:
Zwally et al 2015 took an unconventional approach to assessing the mass balance of Antarctica. Unlike other studies, before and since, that used satellite altimetry or satellite gravimetric methods, Zwally’s team chose to compare net snowfall accumulation to estimated ice discharge to the ocean in a dataset that ended in 2008. In order to do this type of analysis properly, 3 main things are needed:1. It is critical to use the most optimal corrections for instrument biases (the ICESat data used need to have the appropriate saturation bias corrections to get real-world answers that are reproducible)
2. The most-accurate densities of snow have to be used
3. The most-optimal values for changes in bedrock elevation (GIA) in response to ice sheet mass changes have to be usedAs has been since determined by multiple studies (A, B, C, D, E, F and G, listed following):
1. The ICESat bias corrections used by the Zwally team were appropriate for measuring sea ice, but not for measuring high altitude land-base ice sheets like found in Antarctica (the values returned for Lake Vostok alone were so unphysical that they should have made the entire study DOA)
2. A value for snowfall density different than that determined by decades of land-based research was used
3. The values used by the Zwally team to correct for GIA were too high by a factor of 2As such, their results cannot be reproduced using well-established bias corrections, known snow densities and more appropriate values for GIA.
Looking at even more recent studies, per Gardner et al 2018:
"Including modeled rates of snow accumulation and basal melt, the Antarctic ice sheet lost ice at an average rate of 183 ± 94 Gt yr−1 between 2008 and 2015."
Results from the recent IMBIE Team from 2018 show that Antarctic ice sheet mass losses are accelerating, tripling their contribution to global sea level rise since 2012.

Lastly, Bamber et al 2018 subtly but firmly savages Zwally et al 2015:
"Issues with the approach used for calibration of the altimetry by Zwally et al have been identified (Scambos and Shuman 2016) and an attempt to replicate the trends using similar assumptions for the physical mechanism could not reproduce the large positive balance they found (Mart´ın-Espanol ̃ et al 2017). For these reasons, we believe that the estimates from this study are likely erroneous"
The values for the Antarctic ice sheet mass balance from NASA GRACE are the most current available (to January 2017). An ever-strengthening, consilient body of research using multiple methods all point to that conclusion.
Reference studies:
A. Scambos et al 2016 Comment on Zwally et al 2015
B. Martín-Español et al 2016 - Spatial and temporal Antarctic Ice Sheet mass trends, glacio-isostatic adjustment, and surface processes from a joint inversion of satellite altimeter, gravity, and GPS data
C. Schröder et al 2017 - Validation of satellite altimetry by kinematic GNSS in central East Antarctica
D. Martín-Español et al 2017 - Constraining the mass balance of East Antarctica
E. Gardner et al 2018 - Increased West Antarctic and unchanged East Antarctic ice discharge over the last 7 years
F. The IMBIE Team 2018 - Mass balance of the Antarctic Ice Sheet from 1992 to 2017
G. Bamber et al 2018 - The land ice contribution to sea level during the satellite era
Interestingly, previous research has shown that ice sheet mass contributions from land-based ice sheets have exceeded thermal expansion as the biggest contributor to global sea level rise. Recent research now has isolated the individual ice sheet contributions to global sea level rise.
Per Hsu and Velicogna 2017, between April 2002 and October 2014, the mass component of global mean sea level grew by about 1.8 millimeters per year, with 43 percent of the increased water mass coming from Greenland, 16 percent from Antarctica, and 30 percent from mountain glaciers. There is an additional ~1 mm per year of SLR coming from thermal expansion (H/T to Victor Zlotnicki).
- Why remote Antarctica is so important in a warming world
Daniel Bailey at 07:39 AM on 22 February, 2018Zwally et al 2015 took an unconventional approach to assessing the mass balance of Antarctica. Unlike other studies, before and since, that used satellite altimetry or satellite gravimetric methods, Zwally’s team chose to compare net snowfall accumulation to estimated ice discharge to the ocean. In order to do this type of analysis properly, 3 main things are needed:
1. It is critical to use the most optimal corrections for instrument biases (the ICESat data used need to have the appropriate saturation bias corrections to get real-world answers that are reproducible)
2. The most-accurate densities of snow have to be used
3. The most-optimal values for changes in bedrock elevation (GIA) in response to ice sheet mass changes have to be usedAs has been since determined by multiple studies (A, B, C and D, listed following):
1. The ICESat bias corrections used by the Zwally team were appropriate for measuring sea ice, but not for measuring high altitude land-base ice sheets like found in Antarctica (the values returned for Lake Vostok alone were so unphysical that they should have made the entire study DOA)
2. A value for snowfall density different than that determined by decades of land-based research was used
3. The values used by the Zwally team to correct for GIA were too high by a factor of 2As such, their results cannot be reproduced using well-established bias corrections, known snow densities and more appropriate values for GIA.
The values for the Antarctic ice sheet mass balance from NASA GRACE are the most current available (to January 2017). An ever-strengthening, consilient body of research using multiple methods all point to that conclusion.
Reference studies:
A. Scambos et al 2016 Comment on Zwally et al 2015
B. Martín-Español et al 2016 - Spatial and temporal Antarctic Ice Sheet mass trends, glacio-isostatic adjustment, and surface processes from a joint inversion of satellite altimeter, gravity, and GPS data
C. Schröder et al 2017 - Validation of satellite altimetry by kinematic GNSS in central East Antarctica
D. Martín-Español et al 2017 - Constraining the mass balance of East Antarctica
Interestingly, previous research has shown that ice sheet mass contributions from land-based ice sheets have exceeded thermal expansion as the biggest contributor to global sea level rise. Recent research now has isolated the individual ice sheet contributions to global sea level rise.
Per Hsu and Velicogna 2017, between April 2002 and October 2014, the mass component of global mean sea level grew by about 1.8 millimeters per year, with 43 percent of the increased water mass coming from Greenland, 16 percent from Antarctica, and 30 percent from mountain glaciers. There is an additional ~1 mm per year of SLR coming from thermal expansion (H/T to Victor Zlotnicki).
- In 2017, the oceans were by far the hottest ever recorded
MA Rodger at 08:13 AM on 2 February, 2018sidd @6,
The missing energy is as described by scaddenp @7&9. And the basic numbers set out by Incognitoto @RealClimate are fine although some of the subsidiary numbers are well off the mark.
Incognitoto is suggesting the net climate Forcing back 10-15 years ago was +1.6Wm^-2 (which is possible) which he equates to an energy imbalance of 800TW (actually 816TW) and that would be 25Zj/yr. He also speculates about today's net Forcing being +2.0Wm^-2 but goes nowhere with it.
Incognitoto then suggests ΔOHC would have been 8Zj/yr, so accounting for a 250TW energy imbalance. The 0-2000m ΔOHC for 10-15 years ago (from NODC/NOAA although they don't list back to 2003 for 0-2000m any more. The earliest 5 years comes to 43.7Zj ΔOHC between 2005 & 2010) gives 39.3Zj ΔOHC between 2003 & 2008. That yields 7.86Zj/yr or a 249TW energy imbalance.
Incognitoto adds on "less than" 10TW for melted ice and 40TW for added atmospheric H2O. The Ice estimate is probably about right for 10-15 years ago. 10TW would equate to 950Gt/yr of melt. GRACE data for Greenland & Antarctica (graphed here) suggests about 400Gt/yr. And according to PIOMAS Arctic Sea Ice would add about 300Gt/yr and a similar amount from other glaciers. The H2O is badly wrong. It would be about 2.4TW with an additional 3.0TW heating up the air. A final component is the heat required to warm the land which would be roughly similar in size to Ice & Atmosphere. (Note the SkS graphic here dates back to 2007 would predate GRACE results.)
So the energy flux back 2003-08 exiting planet Earth to space due to the AGW temperature rise (if the 1.6Wm^-2 is accepted as a net Forcing) would be something like 525TW.
- Antarctica is gaining ice
scaddenp at 06:22 AM on 26 January, 2018matt - as per JH comment, you need to take notice as to which ice you are talking about. Sea ice extent appears to be influenced by katabatic winds bring cold air from the interior over the surrounding sea. These increase outward dispersion of sea-ice was well as freezing the surface so you can increase seaice extent despite a warming ocean as per papers cited in article. The strength of the katabatic winds seems to be influenced by the ozone levels in the stratosphere. However, more observations are needed before this can established with certainity.
Land ice is a more complex picture. Early models (TAR I think), predicted Antarctic land ice would increase as warming seas resulted in more moisture being blown over Antarctica and falling as snow. However, this is balanced by substantial ice sheet losses on margins especially in West Antarctica as calving rates accelerate. You can see the pictures/videos of land ice mass change over here. Broadly it is mass gain around EAIS and mass loss of WAIS, with overall net mass loss.
- Greenland has only lost a tiny fraction of its ice mass
Daniel Bailey at 10:28 AM on 29 November, 2017"For the last 18 months, DMI shows Greenland ice increasing significantly"
Nope. Does-not-pass-the-sniff-test.
Per the DMI, the authority in charge of tracking the Greenland Ice Sheet:
"Over the year, it snows more than it melts, but calving of icebergs also adds to the total mass budget of the ice sheet.
Satellite observations over the last decade show that the ice sheet is not in balance.
The calving loss is greater than the gain from surface mass balance, and Greenland is losing mass at about 200 Gt/yr."
Embolding added.
So the DMI is in perfect agreement with NASA:
"Data from NASA's GRACE satellites show that the land ice sheets in both Antarctica and Greenland [below] have been losing mass since 2002. Both ice sheets have seen an acceleration of ice mass loss since 2009. (Source: GRACE satellite data [to January 2017])"

Debunked.
- Greenland is gaining ice
MA Rodger at 20:40 PM on 12 November, 2017To clarify the situation regardingGoddard/Heller's use of DMI graphics.

He shows the DMI Accumulative Surface Mass Balance graph (the lower one of the above) in two of his November posts (so far). In the first of these posts (Nov 1) he says "Greenland ice growth is close to last autumn’s record high." (His screen-shot of the graphic does not past Nov 1.) This strongly suggests Heller/Goddard doesn't understand AccSMB.
This was preceeded by a graphic showing the differences between two NOAA SIE graphics aserting "Arctic sea ice extent is up 16% from last year."
This is perhaps no surprise. 2016 was jaw-droppingly un-icy through the Autumn, setting new records for low ice. Using JAXA daily data, 2017 was 14% above 2016 on 30 Oct (& almost 16% up on 2016 on 18 Oct. Yet a percentage is a little silly as a measure - SIE grows over 50% through the month of October). And of course, the whole comment is silly as 2017 remains a very un-icy year, as shown in this JAXA SIE anomaly graphic (usually 2 clicks to 'download your attachment'). 2017 SIE is at present in 3rd place behind 2012 & 2016.
In a second post (Nov 9) Goddard/Heller again posts the DMI Acc SMB graph saying "The last two years have seen near record ice gain in Greenland." Additionally, to back his primary assertion that there has been a massive expansion of thick ice over the last decade, he blinks two DMI graphs (below) but with the thinner sub 1.5m blue and purple sea ice whited out. While the areas of thick ice may be greater 2007-17 as Heller/Goddard says, PIOMAS shows a healthy drop in total sea ice volume between Oct 2007 and Oct 2017 of 990 cu km.
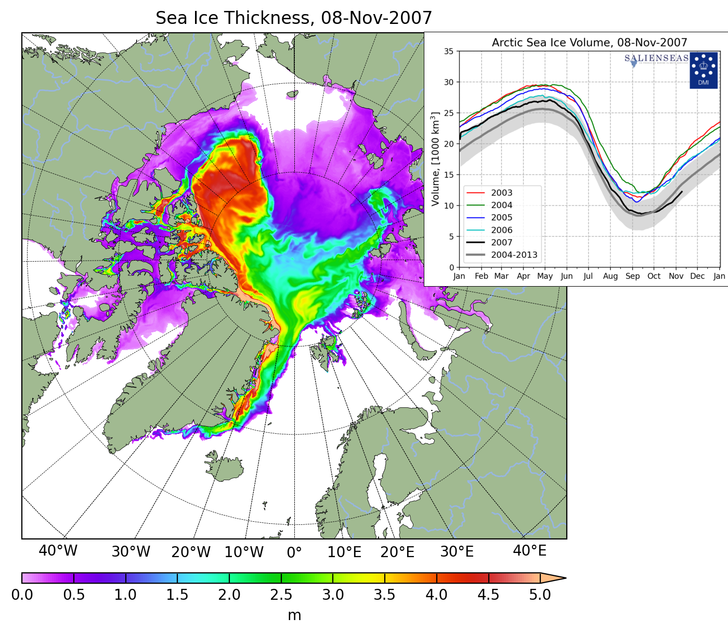
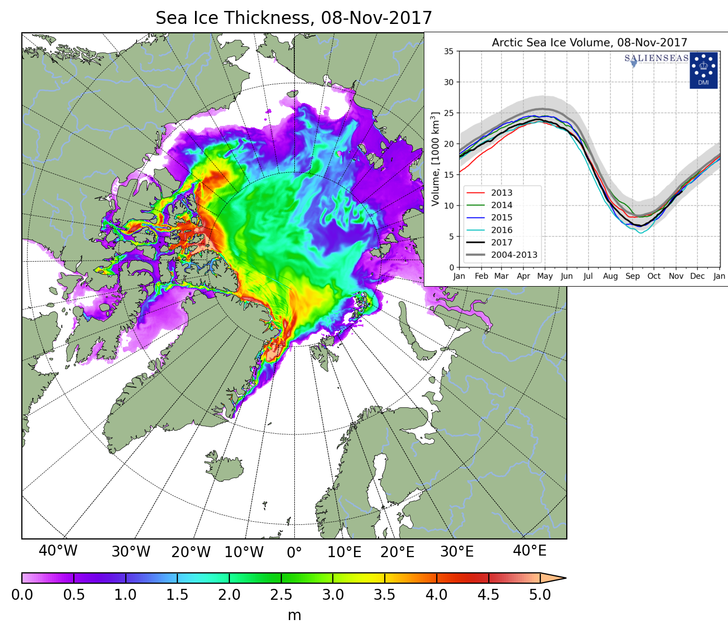
- Greenland is gaining ice
Cedders at 18:47 PM on 12 November, 2017Sorry, there was an important word missing in my post 16 - Goddard Heller 'misrepresented' the graph, but I was going to be charitable and write 'misinterpreted'. However, it's possible he personally understands the difference between surface and total mass balance but has avoided explaining it.
The minimal text in 'Massive Growth In Arctic Ice Since Last Year' (Nov 2017) concerns both sea ice and the Greenland Ice sheet - it makes no claim the two things are related but leaves readers to draw a conclusion. Previous uses of the DMI graph includes 'Greenland Ice Growth Ahead Of Last Year’s Record Pace' (Oct 2017) which seems oddly careful to specify that DMI does show surface mass balance given that it goes on to talk of 'criminals in the press and academia'; 'Record Greenland Ice Growth Continues' (Sep 2017); 'Scientists Discover That Their Imaginary Greenland Meltdown Is Not Having Any Effect' (June 2016); and over at NTZ 'Danish Meteorological Institute Moves To Obscure Recent Record Greenland Ice Growth' (Gosselin, April 2017) mentions 'massive ice growth' without any sign of being aware of calving loss.
On 24 April Goddard Heller tweeted 'Contrary to the lies of government scientists, Greenland has gained a record 600 billion tons of ice this winter.' I pointed out the possible source of confusion, and Goddard blocked me shortly thereafter.
- Greenland is gaining ice
Cedders at 23:33 PM on 11 November, 2017I've noticed new claims that Greenland is gaining ice. It seems Steven Goddard (Tony Heller) a graph by Danish researchers on a web page 'Current Surface Mass Budget of the Greenland Ice Sheet'. It was picked up in Goddard's "Deplorable Climate Science Blog" as "Massive Growth In Arctic Ice Since Last Year" and that has been amplified by contrarians who in this case prefer to believe models to satellite data (eg "Grace data update reveals NASA Greenland mass-loss fraud").
The confusion is simply resolved by reading the explanatory text.
Over the year, it snows more than it melts, but calving of icebergs also adds to the total mass budget of the ice sheet. Satellite observations over the last decade show that the ice sheet is not in balance. The calving loss is greater than the gain from surface mass balance, and Greenland is losing mass at about 200 Gt/yr.
- Americans want a tax on carbon pollution, but how to get one?
One Planet Only Forever at 01:19 AM on 29 October, 2017A carbon tax could help reduce the rate of GHG pollution, but ultimately more responsible leadership action is required to terminate the creation of increased harm by pursuers of personal benefit from the ultimately unsustainable burning of non-renewable fossil fuels.
Global humanity is suffering from an epidemic due to the infectious pursuit of private interest benefits that is made more virulent by misleading information delivery. The symptoms of the disease include democracies failing to ensure that their leadership deliver Good Results. The Winners in games of popularity are often the characters without Character, people focused on unjustifiably getting away with obtaining self-interest benefits for only a portion of humanity to the detriment of current day Others and to the detriment of all of future humanity.
My Professional Engineering thoughts enlightened by my MBA training plus decades of observation, and too many other sources of information to practically list (including this OP and the comments made 'in reaction' to it), are that "understandably unacceptable options must not be allowed to compete for popularity or profitability".
Popularity and profitability contests can be seen to result in less acceptable competitors getting a competitive advantage and Winning until/unless effective external limits are imposed on their behaviour. And more freedom for people to believe anything and do whatever they want makes it worse. That free-for-all competition can result in competition to be the least acceptable in even the 'supposedly most advanced nations'. And it can develop the related delusions that the less fortunate 'deserve their fate'.
As a Professional Engineer I experienced many cases where I had to say No to objectively unacceptable options (options that were contrary to the public interest), that were desired by clients as well as executives in the companies I worked in. In some cases people even tried to claim that how much cheaper or quicker an unacceptable option was needed to be considered, implying that the protection of the public interest from the potential actions of a pursuers of personal benefit should be compromised/balanced with a private interest for more personal benefit.
Correcting/restraining the likely harmful results of competition is a responsibility of Regional Governments (leaders governing the behaviour of a regional sub-set of global humanity). That responsibility of governing groups makes the Objectives of their actions the important measure. How big the government is in terms of tax funded actions does not matter. How effectively the government accomplishes Good Results is the key measure.
Good results are sustainable improvements of the living circumstances of the least fortunate and future generations. Making an already more fortunate person even more fortunate because of the Dogma that 'lower taxes are better' (or taxes are bad) is not a solution. And collecting a tax that does not achieve the required Good Result/Objective is also not a solution.
Freedom should be limited to those who responsibly self-limit their actions to things that are not harmful to future generations or the less fortunate (particularly the least fortunate). Without that understood limit on Freedom democracy or the freedom of people cannot be expected to develop Good Results.
For the climate science/change issue the Objective is the rapid termination of the creation of new excess GHG combined with efforts that effectively reduce the already over-developed, and still increasing, level of GHGs.
Irresponsible leadership resulting in a lack of proper education of global humanity has pushed humanity to the current daunting requirement for massive rapid corrections of what has developed, including the increased challenge of education regarding the massive required correction of incorrectly developed perceptions of prosperity and opportunity.
Winners trying to limit awareness and proper understanding of climate science through misleading marketing are among the greatest threats to the future of humanity that have ever developed, and they need to be treated as the threats that they actually are.
Education of the population about the importance of self-limiting their behaviour, understanding ethical limits to achieve Good Objectives, is the most sustainable solution. The 2015 Sustainable Development Goals are a globally applicable presentation of the measures of ethical/good objectives. These goals are open to improvement if Good Reason is provided to substantially alter part of the developed awareness and understanding that is already the basis for the Sustainable Development Goals.
Ultimately, regions/groups of people cannot be allowed the freedom to continue to believe and do things that are contrary to achieving the Sustainable Development Goals. And like all other globally unacceptable behaviour the education of the global population will ultimately have to include effective sanctions on any regional group that attempts to persist in believing that they do not need to change their minds and behave more responsibly.
The inevitable result of the persistent reluctance of people to behave better is effective penalties that they angrily refuse to accept because they demand 'No restrictions on their freedoms of belief or actions'.
Constantly improved objective understanding, not just climate science, is strengthening the objective basis for ethical behaviour. It also clarifies the basic understanding of equality for subjective beliefs while reinforcing that a subjective belief does not over-rule, and should not even be allowed to compromise, an objective understanding.
That strengthening objective evidence and understanding makes it harder to maintain subjective beliefs or dogma. That has angered many people who want to benefit by holding on to subjective personal interest beliefs (dogma's and ideologies) that are contrary to constantly improving understanding of Good Objectives - Public Good. Anger is one response to the anxiety of the cognitive dissonance they face. But learning to change their minds is the only way to resolve the anger causing anxiety.
The angry people pursuing personal interests that are contrary to the Public Good Objectives can be seen to be gathering together to support each others' understandably unacceptable wants and desires. This can be seen to be the fundamental core of many Unite the Right movements like the one growing inside the Republican Party in the USA. Rather than setting up an additional option for voters, Unite the Right groups hope to take over established conservative brands and fool responsible conservative minded people into voting for them by claiming the Conservative name/brand.
Responsible people would disagree with the understandably unacceptable beliefs and desires of those new members now entrenching themselves inside the disguise of the 'taken-over Brand'. The hope is that those who are strongly inclined to simply like the brands 'Conservative or Libertarian' will see no choice but to support what they can understand is unacceptable. And that tactic works very well in a population raised to respond to misleading marketing messages and develop powerful Brand, Religion or Nationalist loyalty (Powerful for ISIS. Powerful for Unite the Right).
As John Stuart Mill warned in "On Liberty": “If society lets a considerable number of its members grow up mere children, incapable of being acted on by rational consideration of distant motives, society has itself to blame for the consequences.”
The future of humanity requires the Leaders of global humanity to understand their obligation to educate the global population and minimize the number of people who 'grow up mere children'. Climate Science and the tragic examples of the responses of people based on the 'freedom to think and do as they please' have developed a great Case Study for that education. Hopefully, sooner rather than later, the Winners who understandably do not deserve to be Winners will be effectively Re-Educated/Corrected or be restricted from significantly impacting others or the future of humanity.
The Winners who fail to act responsibly to Sustainably Develop the Public Good are developing damaging results and will persist until they are educated/corrected to 'sustainably change their minds'.
- We're heading into an ice age
Daniel Bailey at 23:14 PM on 3 September, 2017No guesswork needed. The Earth's climate doesn't change significantly without a change in factors capable of forcing it to change. When climate is in balance, seasons come and go at their usual times and polar ice cover stays within range of natural variations. As do ocean pH and global temps. If global temps and ocean pH are changing, which we can measure and verify that they are, then there must be a change in the composition of those gross factors which can affect climate.
The gross factors affecting climate are: Milankovitch cycles (orbital factors), solar output, volcanoes (typically a negative forcing), aerosols, surface albedo and non-condensable greenhouse gases (water vapor plays the role of feedback). Orbital forcing has been negative for the past 5,000 years (since the end of the Holocene Climate Optimum), solar output during the past 40+ years has been flat/negative, volcanoes exert a short-term (up to several years) negative forcing (but none of note since Pinatubo), aerosols (natural and manmade) are a net negative forcing over that time period. Albedo is a net positive forcing due to the ongoing loss of Arctic sea ice; cloud albedo effects are thought to be in general a net zero forcing.
Which leaves the non-condensable greenhouse gases, primary of which are carbon dioxide (CO2) and methane (CH4). Atmospheric levels of both are rising, and have been for literally centuries now, so they are a net warming. While the concentration of CH4 is rising, and it is a potent GHG, the warming from it is overall less than that of CO2 due to the much more massive injection of previously-sequestered, fossil-fuel-derived bolus of CO2 humans are re-introducing back into the carbon cycle.
Still no guesswork neded. Scientists have researched that very subject. What they've found is that the next ice age has been postponed indefinitely.
Per Tzedakis et al 2012,
"glacial inception would require CO2 concentrations below preindustrial levels of 280 ppmv"
For reference, we are at about 400 right now and climbing, so we can be relatively sure the next glacial epoch won't be happening in our lifetimes.
But what about further down the road? What happens then? Per Dr Toby Tyrrell (Tyrrell 2007) of the University of Southampton's School of Ocean and Earth Science at the National Oceanography Centre, Southampton:
"Our research shows why atmospheric CO2 will not return to pre-industrial levels after we stop burning fossil fuels. It shows that it if we use up all known fossil fuels it doesn't matter at what rate we burn them.
The result would be the same if we burned them at present rates or at more moderate rates; we would still get the same eventual ice-age-prevention result."
and
"Burning all recoverable fossil fuels could lead to avoidance of the next five ice ages."
So no ice ages and no Arctic sea ice recovery the next million years...
Also covered by Stoat, hereThis Nature article offers an interesting summary
- Models are unreliable
NorrisM at 08:59 AM on 27 June, 2017
I would first like to state that I have finally found a website that is balanced on this very emotional issue. I also want to thank SemiChemE and Tom Curtis (along with a few others) who have engaged in a very fascinating discussion on climate models.
My intention is to pose a question on climate models in keeping with this blog, however because this is my first post, I would like to explain my background. I am a lawyer by training and have a very limited base in physics (took Latin in Grade 12 rather than physics) although I always did well in science. I will also disclose that I do have an involvement in the Canadian oil and gas industry notwithstanding that I live in Vancouver, BC.Ever since the issue of global warming came to the fore in the late 1990’s and since, I have to admit that I have tended to accept the “scientific consensus” if only because I had no reason to question it. Climategate shook my confidence in 2009 but if Neil DeGrasse Tyson still believes that the principal causes are anthropogenic then far be it for me to question it. However, it always seemed logical to me that a first step in reducing the effects of CO2 should be to move from oil and coal to natural gas (especially for electrical generation) which puts about one half of the pollutants into the air compared to coal and oil. After spending enough holidays in France, I have also thought that a switch to nuclear energy made more sense than disfiguring our planet with massive wind turbines and great areas of solar panels. Driving from LA to Palm Springs is not a pretty sight. But I do appreciate that there are real concerns relating to disposing of nuclear waste and issues of terrorists getting their hands on nuclear fuel. However, someone as significant as James Hansen believes that we will not achieve our goals without a turn to nuclear energy.
In any event, my recent interest in the causes of global warming really came about because I have two sisters who are just about no longer on speaking terms owing to their disagreements on global warming. When one sister called me asking where I stood on climate change and if I truly believed that this was all a “global conspiracy of the left” to increase taxes and government control over our lives, I promised her that I would buy some books on both sides of the argument and get back to her. Needless to say, I do not believe in conspiracy theories of any sort.
So the two books I located were The Science & Politics of Global Climate Change by Dessler and Parson and Climate Change the Facts edited by Alan Moran.
By the time I was finished with Dessler’s book I was convinced of the science. Then I read the essays in the Moran book and found myself at least questioning some things.I actually then went back and re-read Dessler’s book to see where the gaps were. I have to say that when I found that Mark Steyn had an essay in the Moran book I almost did not read the book because of his extreme views. Just to make my political views clear, I think Donald Trump poses a major threat to liberal democracy in the US and to the world in many ways. But it does look like the US institutions may be able to withstand him and his cohorts. I also follow Sam Harris’s podcasts “religiously”.
Since reading these two books I have largely pursued my research on the web even reading the submissions of the four climatologists on March 25, 2017 to the House Committee on Science Space and Technology.
Based upon Judith Curry’s reference in her submission, this led me to the most fascinating discussion of the topic of climate models by a panel of physicists formed by the American Physical Society (APS) which posed questions to six (6) well-known climatologists having “different perspectives”. Three (3) of them (Collins, Santer and Held) are IPCC climatologists and the other three (3), Curry, Christy and Lindzen are on the other side of the debate. This was the 2014 Workshop sponsored by the APS as part of its 5 year review of its Climate Change Policy Statement.
As a lawyer, I have to admit that if I treated (i) the IPCC 2013 Assessment as an appellate lawyer’s factum, (ii) the Workshop Framework posed as questions from the bench, and (iii) the 600 page transcript of the panel hearing as the “give and take” between the judges and lawyers during the oral argument of the appeal, I would have predicted a “win” for Curry, Lindzen and Christy and a “loss” for Collins, Santer and Held. Both the Workshop Framework questions and the transcript are on the APS.org website. Just search “Climate Change Statement Review”. If anyone has read any legal transcript of a hearing you know it is a simple read so don’t be put off by the “600 pages”.
The APS panel consisted of six (6) arm’s length physicists (with no axe to grind) chaired by Steve Koonin who were asking hard questions of both sides. What actually struck me as very astounding was how honest Koonin was about his previous lack of understanding as to how uncertain climate science is owing to the uncertainties underlying the climate models.
This panel hearing took place in February 2014. By November 2015, the judgment of the Board of Directors of the APS was in. The connection between increases in CO2 and global warming was “compelling”. However, the APS did acknowledge that there were significant uncertainties in the science and urged sustained research in climate science.
Where my comparison with an appellate hearing breaks down is that no appellate court would render a significant judgment without providing its reasons. We do not get any reasons from the panel as to why it recommended to the Board of Directors (as I assume it did) that the APS “stay the course” with its policy statement notwithstanding the serious reservations you could see in Koonin’s and other panel members questions to Collins, Santer and Held and the weak answers provided by them. The IPCC climatologists in effect admitted that Christy’s now famous chart showing how far apart the average predictions of the climate models were from actual observations was “old information” and did in fact represent the existing state of models predictions versus observations. See Santer page 504. The IPCC climatologists effectively said that they could not trust the observations! Koonin’s rhetorical question to Held to this "observational" response earlier was: “So the ability then to reproduce historical data is neither necessary or sufficient to predict the future. Is that what I understand?” See page 453 of the transcript. Held effectively avoids answering the question. See page 454. Read it yourself and see if you disagree with my view of his response.
So here is my question.
From everything that I have read so far, other things being equal, a doubling of CO2 in the atmosphere from pre-industrial levels of CO2 of around 280 ppm to 560 ppm will increase the global surface temperature by about 1 to 1.2C and the balance of the predicted range of 1.5C to 4.5C of the IPCC 2013 Assessment is based upon “positive feedbacks” resulting from increased water vapour that is assumed will form arising out of the 1C increase by CO2. I accept (or understand) that the 1C increase is “solid physics” or “hard science”.
Is it “solid physics” that:
1. Water vapour will in fact increase as modelled?
2. Water vapour will cause the predicted additional increase in temperature by a factor of 2 to 3 times?Although this next observation is not specifically focused on the climate models, what also troubles me in everything that I have read so far on climate change is the following:
1. The Mediaeval Warming Period had temperatures for at least 200 years in at least Greenland and Northern Europe close to or equal to our present temperature.
2. During the 1600's and 1700's there was a "Mini-Ice Age" when they were skating on the Thames. We were just coming out of this cold period at the beginning of the American Revolution (good timing).
3. From 1990 to 1940 we experienced about .3C warming; then from 1940 to 1975 there was a levelling off or cooling period; then from 1975 to 1998 we experienced .5C warming; and then there was a levelling off (termed the “hiatus” by the IPCC) of now about 17 plus years that may or may not have ended in 2015 (El Nino event 2015-2016). I appreciate that 1998 was an El Nino year but the IPCC 2013 Assessment recognized the “hiatus” up to that time.
If climatologists cannot explain why these other warming and cooling periods occurred which, other than the 1975-1998 period, were primarily or completely caused by natural climate change, then why can they so confidently claim that this one warming period was primarily caused by the CO2 rise? Just because there was a concomitant rise in CO2? What about the rise of CO2 from 1950 to 1975?
The models predicted that our temperature would increase on a linear basis. There were no “waves” in the models. I guess based upon Michael Mann’s most recent testimony the most recent peer reviewed papers are now suggesting that we will be going up in steps or waves. Can we now expect that the new models with show the steps or waves?So where did the “warming” go during this “hiatus”? If the answer is into the oceans, then why did the “warming” not come from the oceans during the period 1975-1998? Could we have had a cooling period during the “hiatus” that offset the warming from CO2 during this period? What are the impacts of a decrease or increase in low clouds caused by natural factors which impacts the amount of sunlight hitting the earth? Because of computer capacity issues, we can only make “parameterizations” of clouds in the models. These are the kinds of questions that make me question the validity of the models.
When we talk of the difference between weather and climate we say we cannot predict weather but we can predict climate because we know that next July it will be warm. But why do we know that? Not from models, from observation. If observations and models do not correspond, when do we admit that the models do not have sufficient predictive value to be relied upon? It is OK for science to say “we just do not presently understand the science sufficiently to make reasonably accurate predictions”.
On the other hand, here are the major science societies of the world like the APS, the US National Academy of Sciences and the UK Royal Society coming out strongly in support of the proposition that man-made global warming is a serious problem and is going to get worse. My worry is that they got on a band wagon in the early 2000’s before the “hiatus” was apparent and they now find it very difficult to get off even when they see that these models are not predictive.
I apologize for such a long-winded initial blog. If you think I have to reduce it, please advise.
- Reflections on the politics of climate change
nigelj at 08:24 AM on 7 June, 2017OPOF @24, the puritanical / ascetic sorts of beliefs have been tried so many times and are still being tried, ironically right now by jihadist islamic fundamentalists like ISIS. Most people reject such beliefs as they are so miserable to live with, but they presumably give comfort to certain personality types. But fortunately they appear to be in a minority.
Of course when systems of belief like puratinism have been tried and failed, theres always a danger of going to the other extreme, which is not always a good thing.
For example the authoritarian culture of the west in 1950s was probably too repressive, and lead to the more liberal generation of the 1960s and following this, but this generation exhibited its own range of problems. (However this in no way invalidates a basically liberal mindset)
Another example: The combined western capitalist / socialist economic structure of the post WW2 period produced some good results, but stagnated and lead to the neoliberal revolution of the 1980s onwards, but this was quite an extreme change, and has developed some severe problems of its own. The good elements of the previous period were all thrown out with the flawed elements.
Humanity seems to progess in a haphazard fashion, from one extreme to another, often failing to find a sensible balance, when ironically that balance is so obvious to so many of us. I suppose experiment is needed and this involves extremes, but it would be better to try to model these things more on paper, rather than experiment with entire countries and cultures.
The culture of character has moved from work and duty to image and glamour, however it's hard for me to see it as an either / or choice to consciously make. Its hard not to conclude that a mix of both seems desirable.
Of course there is a huge negative, trash side to image and glamour, for me epitomised by the Kardashians. You mentioned the massive and corrosive power of marketing. But Ironically the move to characteristics of image, and glamour etc is seen negatively, but its people like actors and artists who are loudest in questioning the irresponsibility of corporate behaviour and climate denial! This suggests there is a lot of nuance and complexity going on.
So what is the ideal global citizen? Well I can't think of better than hard work, maturity, and good character, combined with some pleasure, fashion, and amusements. Its a balancing act, and I see nothing wrong with that.
- Why is Greenland's ice loss accelerating?
grindupBaker at 16:16 PM on 22 May, 2017The incorrect comment #2 RSVP and responses of John Cross both miss the most overwhelming piece of science regarding this fallacy of melting ice cooling the ocean's well-mixed layer and this is ironic because the piece ignored is the mechanism of Earth's Energy Balance and the massively overwhelming quantity of the Sun's input and Earth's cooling output to all other energy sources and sinks in the ecosphere, the very essence of "global warming" that this site and discussion everywhere is all about. The details (but unquantified) in this case are:
1) Ice melts and, lets say, spreads over a surface ocean layer of several hundred thousand square kilometres that is colder than it would have been had the ice not melted onto and into it.
2) So now (Stefan Boltzmann t**4 and all that) that ocean layer transmits less LWR up than it would have been had the ice not melted onto and into it. I should think less evaporation and sensible also.
3) None of this affects the solar radiation input so the ice melting and this spreading over a much vaster area than if it had stayed as ice mostly hidden from the Sun by other ice above simply increases Earth's energy imbalance at TOA over that ocean area. The sun warms that colder water back to whatever average temperature was the balanced average temperature for that region, as though ice had not melted and ocean surface not cooled.To put it simply, melting the ice simply spreads it out thinly over an enormous area and makes it vulnerable to the overpowering energy of the Sun, no sustained cooling occurs. That concept is a fallacy. First point of quantification is how long it takes Sun to warm 12 months of ice loss back to the prior ocean surface temperature. Obviously, if it takes the Sun 10 years, or even 2 years, to warm 12 months of ice loss back to the prior ocean surface temperature then I am incorrect and there is sustained cooling. However, I did a quick calculation a few months ago by spreading the annual Greenland ice loss over that famous Cold Blob (rather arbitrary I know) and found that it takes Sun 7 months to warm 12 months of ice loss back to the prior ocean surface temperature. Therefore there cannot be any cooling of the ocean's well-mixed layer by melting of ice at a rate less than about double the present rate. It isn't just a matter of the cooling being a tiny portion of OHC +ve anomaly, the cooling is not happening at all.
Second point of quantification is how deep the ice melt mixes. I didn't mix it at all and I only computed it for whatever depth (175 mm) matches 350 Gt / yr ice loss ans a 2,000,000 km**2 spreading area, which gives 175 mm depth of non-mixed ice water. I can see that mixing to various depths would slow the rate at which Sun re-heats it but I didn't do a selection of semple computations. Somebody might want to do that some time.
If the melt water from ice plummeted down into the thermocline in the North Atlantic where temperature is >0 degrees then I can see it cooling the ocean but I seriously doubt that fresh water does that.
- Humans are greening the planet, but the implications are complicated
LinkeLau at 19:15 PM on 6 May, 2017Dear Tom@4
Thank you for your extensive answer and elaborations.
1) In general I think it is a very hopefull message that additional plant growth could eventually drawn down all anthropogenic CO2 emissions, but I also understand that 'the price is high' for many plant and animal types. On the other hand - and maybe it is a form of my ignorance - I somehow trust that nature will find a new balance which will be positive for some plant and animal types and negative for others. Is it too bold to state that more vegetation in the long term means more biomass and also a wider variety of species? If we take a look at the dense rainforrest we are all happy about the variety of species that live there. Why couldn't that happen in large parts of lets say Australia, the Soviet Union, Canada or the US? With current agro technology development (agro towers, led light spectra, meat production based on stem cells, etc.) most of these lands will probably become obsolete for food production in the near future (30-100 years). So, reforrestry could at least sequester a lot of the access CO2 we pumped in that air. Lets 'built' forrests on agro ground that is no longer needed. It is already done in the Netherlands where obsolete grounds are 'given back' to nature.
2. I don't have any expertise in this field and also based on logic reasonining it is hard to find an answer, but given the very cloudy atmospere in the rainforest I would guess that a lot of temperature will be trapped near surface, but as a compensation extra clouds reflect incoming solar. What the net effect will be? I can only guess. If I take a look at the maps that NASA produced it seems that the rainforrest could also have been a dessert without the forrest (assumption: the forrest keeps the forrest although solar irradiance is very high in some of those areas)
3. Probably without these resistance to aridity the world would have been as it is now. Maybe this is one of the reasons (a miricle?) why the earth did not experience a runaway greenhouse effect before: plants adapt to a large extend if temperature as well as CO2 in combination increase to a high level by creating their own biotope? The cloudiness that follows (see reainforrest) helps re-radiating solar irradiance and that could start a new cooling phase?
- Humans are greening the planet, but the implications are complicated
Tom Curtis at 10:31 AM on 6 May, 2017LinkeLau @3:
1) All coal and peat used to be plants as some time. It follows that, at least in principle, all anthropogenic CO2 emissions could be drawn down by additional plant growth. It is not clear, however, that that could be done without forests colonizing much, or all of current agricultural land, plus land opened up by global warming (ie, former areas of perma frost, or areas formerly lying under ice caps).
Having said that, if you look at the last time the Earth approximated to those conditions, ie, the Carboniferous 300 million years ago, you had a situation where trees were able to colonize much of the land surface because of the complete absense of vertebrate grazers. The energy stored as sugars by photosynthesis approximately balance the energy given up by respiration by the plants and their predators. To a first approximation, a joule of energy stored as sugars can support either 10 tonnes of plant biomass, or a tonne of animal biomass. That is significant because the Earth currently supports what is probably the greatest level of animal biomass it has ever supported - which greatly limits how much carbon sequestration due CO2 fertilization is possible. It is also significant because any growth in plant biomass for CO2 fertilization will drive a corresponding increase in plant grazers which will also significantly limit the possibilities of sequestration.
2) Two complex for me to say. Given that stomata will shrink, that will to some extent compensate for the increased leaf area. Once you also through increased predation into the mix the change in evapotranpiration is, I suspect, not predictable.
3) The increased resistance to aridity is the one clear benefit from the CO2 fertilization effect. The effect of increased vegetation is to reduce temperature fluctuations (primarily because of the heat capacity of their retained water mass) but to warm the planet because plants have a lower albedo than do most soils (particularly arid soils) or sand.
I agree that CO2 fertilization is likely a positive effect, but it is not straightforwardly so. Remember that increased plant growth will also apply to weeds. Further, increased leafy mass will increase the populations of insects that predate on plants, making it more difficult to protect crops.
- Increasing CO2 has little to no effect
Tom Curtis at 09:13 AM on 1 May, 2017vatmark @312, sorry for my delayed response. I am suffering from poor health at the moment, and am finding it difficult to respond to involved posts in a timely manner. Unfortunately this may mean a further delay in responding to two other posts directed to me by you on another thread, for which I also apologize.
1)
"This does not convince me that climate models are doing it right by using backwards calculations where emitted radiation is causing the temperature of layers below."
I should hope not, as that is not what General Circulation Models (GCM) do. Rather, they divide the ocean and atmosphere into a number of cells, and for each time step solve for all energy entering, absorbed and emitted from that cell, including energy transfers by radiation, latent heat, diffusion and convection. In doing so, they maintain conservation of energy and momentum (or at least as close an approximation as they can maintain given the cellular rather than continuous structure of the world). When they do this, properties of the simplified models of the greenhouse effect used primarilly for didactic purposes are found to emerge naturally, thereby showing those simplified models to capture essential features of the phenomenon.
2)
"He says that observed heat from the earth is not in balance, the heat flux from the sun that heats earth is larger than the amount of heat that earth emit to space. I find that logical, the earth is not equally warm throughout, and then it has to emit less energy. Only when the system is equally warm in every point inside, it emits as much heat to space as it receives."
You have taken a reqirement for a body, heated externally, and equally from all directions and assumed it is a universal condition. It is not.
To take a simple example, if a spherical body having the same thermal conductivity throughout, bathed in a fluid of uniform temperature, but having a significant heat source at the center. According to you it must have the same temperature throughout before energy in can equal energy out. But, based on Fourier's law of conduction, if there is no temperature gradient, there is no movement of energy by conduction. If follows that based on your theory, the heat from the heat source at the center can never leave, which must result in an infinite energy build up at the center.
Your assumed requirement does not even describe such very simple models. It has been falsified, in fact, since Fourier's experiments that led to his seminal work. It certainly does not apply to the complicated situation of an atmosphere, or a large, massive rotating sphereoid heated intensely from one side, and situated in a heat bath of near zero degrees absolute, ie, to the Earth.
Your claim is also refuted by the Earth itself, which has existed for long enough, with a very stable energy source, that it is in near thermodynamic equilibrium. If your supposed condition held, then there would be no significant difference in temperature with altitude. Despite that, ice has existed at altitude in the tropics for hundreds of thousands of years.
3)
"Hansen wrote about satellite measurements showing an imbalance of 6.5W/m^2 averaged over 5 years. Then he says it was thought to be implausible and they made instrumentation calibrations to align the devices with what the models say, 0.85W/m^2."
Satellite measurements currently suffer a disadvantage, in that while they are very accurate in showing relative changes in Total Solar Irradiance (TSI) and Outgoing Long Wave Radiation (OLR), they are fairly inaccurate in showing absolute values. This was known from design specifications, and also by comparison of the data from instruments of the same, or different design over the same period, as here:
That means, while we can know the annual change in the energy imbalance quite accurately, we cannot know it's absolute value from satellites alone. Two different methods are used to compensate for this. In the past, the values from climate models were used of necessity. Since the advent of Argos, the rise in OHC is sufficienty well known that it can be used to calibrate the absolute energy imbalance. Hanson discusses both methods (which approximately agree, and certainly agree far better than does either with the value from the satellites). Further, the specific use of computers you mention was not Hanson's, but that of Loeb (2006).
4)
"How can forcings be known accurately if they are not a result of measurements? Not any of the studies show how any numbers of forcing has been achieved."
Hanson does not say the forcings are known accurately. Rather, he shows the Probability Density Functions of the forcings:
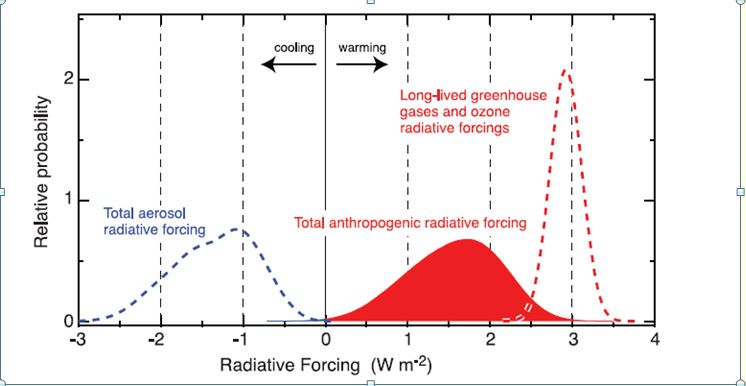
As can be seen, the 95% confidence limits of the greenhouse gas forcing amount to a range of about 1 W/m^2, or approximately a third of the best estimate forcing. In constrast, the aerosol forcing has a 95% confidence limit range of about 3 W/m^2, or just over twice the best estimate.
5)
"And I can´t find any descriptions of the heat flow the way I think it should be done, or rather, the way I like it."
Given the level of understanding of thermodynamics shown by you in your claims about equal temperature, it is neither a surprise nor a problem that you cannot find descriptions of heat flow the way you like. GCMs do use, however, the standard laws of thermodynamics, and of heat flow in its various forms.
- March against madness - denial has pushed scientists out to the streets
nigelj at 06:37 AM on 30 April, 2017OPOF @12, I'm in full agreement about the need for sustainable development goals. I just thought the link was a bit confused, or incomplete on the the forces driving the historical issues and leadership issues they discussed. It was on the right track, but confused.
I think as per my comments above, if you look at history, western society has jumped from one extreme economic or environmental ideology to another over long term time frames, and sometimes "thrown the baby out with the bathwater" in other words we are looking for simplistic answers when none exist. We abandoned capitalism too much, in the 1930's, rather than just modifying some elements, and then went on to abandon the "mixed"economy of the 1960s, not realising some elements of it were very good. "Neoliberalism" has some problems that must be fixed, but we are at risk of throwing out the good elements like free trade.
This is why I admire Scandinavia to some extent, they combine a range of ideas, rather than getting bogged down with labels like capitalism or communism. Theodore Roosevelt seems to have a similar mindset to some extent. I guess this is pragmatism, and even Trump is a pragmatist, but he is making some very poor choices especially regarding the environment (arctic drilling)
Getting back to sustainable development goals, this can embrace a whole range of environmental and economic concerns. Its a no brainer for me, just so obviously needed at a point in human history when its obvious we are having some pretty huge impacts. This is why I despise economic or political ideologies ending with "ism" because we always have to keep open minds and deal effectively with new problems, and fixed ideologies can make that very hard. That's not to say we can work without guiding principles, and government is not the answer to everything either, but it is the answer to certain things and this is where we need better agreement across countries on what this is, and what things should be regulated by governments, and what shouldn't. I'm pretty clear in my mind, and Theodore Roosevelt was.
Regarding marketing and winners. It's interesting because competition has obviously had a positive side, but tends to go wrong if there are no boundaries. It's a case of improving awareness that boundaries are healthy, and not communism or some other "ism".
In fact competition goes most wrong where there is no competition, and you have corporate entities that are monopolies, that effectively become bullies. Again if we have any sense we should put some controls in place, Make no mistake they will keep on producing the goods but their behaviour will be better. History shows this.
It is the big corporations and especially the monopolistic, corporations driving the anti environmental policies. Theres plenty of evidence of this starting with the Koch Brothers. They have huge power.
Where companies are smaller and many are in competition, this is quite effective at forcing them to also behave well enough. Its larger monopolies that can become a real problem.
The less ethical players simply take all this to another level. By legitimising "greed is good" in the 1980s, along with massive financial deregulation, we opened the floodgates to excusing unethical behaviour, that is detrimental to the public good. We saw a perfect example of all this in the 2008 financial crash.
Marketing is a tough issue because it has a good and bad side. It's the price we pay for freedom of speech and a free society. We accept people are entitled to sell their ideas and products, and this is healthy, however the price we pay is all kinds of lies and rorts, and brainwashing. Immediately anyone says we need "controls" over advertising, or some quality standards for free speech, the corporate lobby cry socialism or big government.
Yet while I deplore ideologies like communism, there is nothing wrong with rules of conduct if we want a stable, prosperous society that balances production of goods with honesty of marketing, and a sustainable environment etc. Even our rights to free speech, which I strongly support, come with some unspoken responsibilities, such as a need to avoid verbal abuse and bullying or inciting violence.
- A Perfect (Twitter) Storm
nigelj at 07:59 AM on 18 March, 2017Doug C @31 thank's, and I agree with your comments, mostly anyway.
I can see you have really got into this thing in some depth, probably more than me to be honest although I read a lot on the subject. But it encourages me to look more deeply.
However the average person doesn't need to go into that level of depth and probably won't have the time. There are some good books out there that cover the basics, and both sides of the debate fairly, and then explain why the denialist side is so weak. Those are the ones to hunt out because they are balanced. One is "Poles Apart" by Gareth Morgan ( I have no connection with the author or anything) and there are others.
You say "trying to describe a very complex global system in a period of rapid transition, "
And that sums it up very well in just one sentence. While there's a place for healthy scepticism, scientists need to be respected for the difficult challenge they face figuring this thing out, and trying to provide explanations that lay people can understand.
Regarding your mass media comments, very true. I would add there are lots of groups who present themselves as "ordinary people" , "citizens and tax payers" etc but some of these have been analysed in my country, and they are just fronts for business lobby groups, and sometimes very extreme ones. All this adds up, and distorts everything.
A lot of the money funding denial comes from fossil fuel companies and business interests like the Koch Brothers who are billionaires, and have strongly libertarian leanings and oppose government programmes on principle etc. This article is on the Koch brothers:
www.greenpeace.org/usa/global-warming/climate-deniers/koch-industries/
But these days there are a lot of concealed donations from both large and smaller players. The following article in Scientific American notes "A Drexel University study finds that a large slice of donations to organizations that deny global warming are funneled through third-party pass-through organizations that conceal the original funder"
www.scientificamerican.com/article/dark-money-funds-climate-change-denial-effort/
- A Perfect (Twitter) Storm
sauerj at 00:13 AM on 16 March, 2017Yes, nearly all of Scott Adams points are misinformed or flat-out wrong. And, as for his general state of mind, his past explanations of why Trump is "persuasive" (see YT) does not, in the least, resonant w/ me. I don't get his logic whatsoever (so I think his reasoning skills are 'in question').
But, there is a very small piece of what Adams is saying that has a thin veneer of truth to it, and I think we should step back and consider this point. I might get slammed on this point. Here it is: I think, in many cases (though not always), that scientists explain the science in a way that is a bit obtuse, in a way that simply doesn't register to the average person, it doesn't speak in a language that "means" anything to them.
Here are a couple examples: 1) a recent article (HERE) put the heat imbalance in terms of zeta-joules (yes, it explained that's 10^21 joules, even saying that's 10 with 21 zeros after it), but that still doesn't really mean anything to people. Yes, it's a big number; but it still doesn't speak in ways that people can relate to. The author probably thought this was an effective way to get the point across, sorry, not so! It's still just a big black box of numbers to the average person.
Another example: 2) When James Hansen & many others talk about the heat imbalance, they will say things like, it's 1watt/m^2 (Storms book). And, then they will step back like that means something to people. Sorry, not so. It's like they just said something in greek.
This is partly why ridiculous gimmicks like James Inhofe's snowball is so effective. It speaks on the level where the average person is at. And, when you compare that to complicated charts that explain the heat imbalance or else charts that dissect the details of the satellite surface temperature data or an array of model predictions, people just tune out. The silly but direct Inhofe presentation wins the day for the average person. ... Unfortunately, we have to cross this chasm (& I think we can) if we want to build political will that truly gets us where we need to be, transition to a sustainable economy.
It is hard to dumb-down the science so that it talks in the same language as the average person but I do believe it is possible. You just have to re-think your presentation into a way that talks in a language that they can relate to. And you have to do it in a way that is very respectful (genuinely so), and not in overly "alarmist" terms either (let the alarm bells go off in their own minds).
I have done something like this, and have personally voiced this to the engineers that I work with. Prior to my explanations to these technically savvy people, they had not spent any quality time delving into the science mainly because it hadn't grabbed their attention (well, enough for them to fret out the right from the wrong). And, they were like Adams, full of lots of right & wrong misinformation, but none of the truth potent enough to lure them into digging deeper. We have to grab their attention in a way that is both truthful but instantly talks their language & instantly gets past the murkiness of the darts of confusion that compete with the truth.
True, these engineers, that I have spoken to, speak in a "technical language" so my 'new language' speaks in their 'engineer' language, but I have given this same explanation to a few non-engineers, and it seemed to be moderately persusaive too (jury still out though). After hearing my spiel, many of these people have expressed a new & clearer understanding of the science with this sort of explanation; and I think it genuinely broke thru the web of misinformation that blocks truth from coming in, and peaked their possible acceptance of the truth (of the body of science) so to get them to genuinely to think twice on the matter.
Yes, this message/style is dumbed down, but it is still truthful. It works because it puts what's going on into terms that the average people can relate to. And, that maybe is the worthy take-away here from Adams' implicit (if only unconscious) points buried behind his words. I think, in one small way, if the presentation was put in this way, that then even folks like Adams might (that's a big might) not get so confused & tripped-up on other misinformation that clouds their understanding.
HERE is link to my recent written down point-by-point summary on how I try to "get the point across" in the most persuasive means possible. I am in the process of massing publishing this out to local & state community and policital leaders with the hope of building political will (pending local CCL chapter approval).
- Electric Cars are the Missing Link to a Zero Carbon Energy Grid
chriskoz at 08:14 AM on 5 March, 2017Tthereaer two issues ignored in this OP.
1. Amount of power transfer between grid and EV batteries needed to balance the grid. To achieve zero emissions, substantial part of the total power output of the economy (in US it's a staggering verage 10kW/person) must be supplied by car betteries overnight when the sun is not shining and in the event the wind is not blowing. That drawdown at night must be ballanced by twice the production during the day (20kW/person) even ignoring seasonal/weather fluctuations. If taken into account, those fluctuations (e.g. extreme heat or winter snow when days are dark/short) multiply the demand on the grid several folds. How much solar pannels installations do we need to supply that energy - at least an average power of 20kW/person? How big the transmissions lines need to be to supply that energy from car batteries to hungry energy customers, e.g. alluminum smelters? Then comes the question of energy security: what happens if majority of population forgets to "re-plug-in" their cars in the evning, or decides not to do it because of some massive hysteria (e.g. inspired by an irresponsible presidential tweet), or simply in the name of american freedom to drive their car wherever and however they want as Henry Ford thought them? The result: total grid collapse. I think from the energy security standpoint alone, the idea of substantial grid backing by EV batteries is just pure utopia.
2.Energy density of oil/petrol and associated convenience of its transport and almost instantanous re-energising at the bowser cannot be replaced by the existing EV technology. The miracle of that energy density compressed into oil (and to coal) by 100Myear long geo-processes is difficult to reproduce in a timescale of days (e.g. by solar panels) needless to say a few minutes by a customer at the bowser. At the moment, the only imaginable solution would be to lift the battery with a crane and replace it with another one. Say, it's about 400kWh of energy (equivalent of 8litres of petrol/2gallons of gasoline for a very, very efficient car). If a servo station performs about 100 such operations per hour (average traffic on petrol stations I witness arround my neighbourhood) then each of them must have the rechyarging power supply of 400kWx100=4,000kW. That's a signifficant infrastructure. Until it is not built, we are stuck with proverbial EV "runing on coal".
- 2nd law of thermodynamics contradicts greenhouse theory
MA Rodger at 21:11 PM on 21 February, 2017Rob Honeycutt @1491,
I agree that when explaining the GH effect, at a minimum there is a willful prejudice being employed when an immutable counter-argument wielded against both "blanket" and "greenhouse" as an analogy (or metaphor or whatever) is of the form as presented @1482 (ie - "One is a solid and one is a gas.").
But my thought is to break that immutable nonsense rather than live with it. Thus my position trying to revitalise both the "blanket" and the "greenhouse" as strong analogies for the GH effect.
Thus I would argue as follows.
Note the follow-on comment @1482 "A solid object like a blanket will impose on the rate of heat loss through the loss of convection." A blanket does not trap air anything like as well as the lower atmosphere. The plume of hot gas passing through a blanket is travelling at quite a rate (as this test shows - note 400ft/min =2m/s) And greenhouses are not hermetically sealed but are actually far more leaky that the lower atmosphere, even commercial ones. The lower atmosphere retains parcels of air for a week or more. The same cannot be said for either any blanket or any greenhouse.
And this slow action of the atmosphere circulation is probably best explained by the planet Earth being so big and tha atmosphere so shallow. In the tropics a latitudinal band measuring say 1,000 km is heated and so it is wanting to rise up and displace the cooler air above it. This creates a Walker Cell which will flow away from the tropics at the top of the atmosphere where it cools by radaition into space and so cooled drops back down to the surface outside the tropics. The problem for the "big convetion" argument is that the longitudinal winds at the top of the atmosphere (and the balancing ones in the lower atmosphere) are much less than 10m/s. This speed of wind is the result of the upward convetion flow from the tropics but the <10m/s represents a massive acceleration from the vertical convetion speeds - because comparatively the tropics are very broad but the atmosphere is rather shallow. If the vertical motion feeding this <10m/s is 1,000km wide, the upward speed has to be <0.02m/s which means the air in any "big convetion" cooling circulation will take >600,000 seconds or seven days to reach the top of the atmosphere. Radiation, on the other hand, is flying about at the speed of light. So it's not much of a contest, is it? Thus the values of the various fluxes in the Earth Energy Balance diagram as shown @1488 show very small quantities of convection in operation.
Now this last bit referring to the diagram is a bit of a throw-away remark. The diagram in its original form did describe the sensible heat flux as "thermals" (eg in Trenberth et al 2009 figure 1) which is wrong. But I'm not sure it is entirely wrong.
- 2017 SkS Weekly Climate Change & Global Warming Digest #3
One Planet Only Forever at 14:44 PM on 23 January, 2017The Story of the Week is a comprehensive presentation of how damaging just one USA Presidential term of deliberate delay on climate action can be. However, the clear precedent for the concerns was not mentioned. The USA anti-Leadership of the Bush Administration on this matter is clearly a major reason the challenge today is so much larger.
During those 8 years some very smart people deliberately trying to get away with behaving as unacceptably as they could get away with. THeir actions had major impacts on the magnitude of the challenge being faced today. The developing nations were given plenty of good excuses to refuse to consider that they had any responsibility to commit to behaving better than the already developed nations, particularly the leadership of the USA, had behaved. It also derailed efforts by other developed nations that wanted to be more helpful, because being more helpful was clearly a global competitive disadvantage to the deliberate trouble-makers encouraged and excused by the likes of the Bush Administration.
Another point not clearly presented is that the added actions to try to mitigate the climate impacts are costs and challenges being imposed on future generations, other people. Many of the people benefiting from creating the future costs, and potentially insurmountable challenges of trying to correctly determine exactly how to adapt to the rapid climate changes in every region of the planet, will not suffer the consequences. Some of the most powerful people benefiting today likely only care about benefiting for a short period of time (maximizing their image and personal rate of return during their personal lifetime. They really do not care what people in the future think about them. Why should they?).
Particularly troubling are the statements that if things get built on the gamble that they will be gotten away with, they actually become activities that deserve protection. It is as if the investors who gambled on getting away with behaving unacceptably get protected from losing on their bad bets because of some implication that getting 'Leadership Permission' to go ahead somehow grants them immunity from personally losing Big Time when the unacceptability of what they is better understood.
Since the end of the 1980s it has been clear that every wealthy powerful person understood the unacceptability of already fortunate humans trying to get even more benefit from an activity like the global burning of fossil fuels. Only the less fortunate deserved an opportunity to benefit. And even their opportunity to benefit from burning fossil fuels would need to be limited. The exact global limit was not as clearly understood then, but the gist of it was undeniable.
I will present my perspective of the case of Alberta Bitumen Extraction (since it is what I am intimately familiar with, having lived here through those years). The understanding that there would be global limits on fossil fuel burning, and understanding that the less fortunate would be considered to be the only ones allowed to really benefit, was likely a major motivation for the Alberta efforts to rapidly accelerate the extraction of buried ancient hydorcarbons, particularly the massive amount of Bitumen in the sands of Northern Alberta. Those efforts included setting incredibly low Royalty rates and giving other incentives to get investors to bet on getting away with profiting from extraction of Alberta Bitumen. Future Albertans clearly could have gotten more value out of the buried ancient hydrocarbons but that was not a serious consideration. The key action was rapidly building a popular impression of economic activity that could be claimed to be deserving of protection and further growth. Don't all those people who have jobs deserve to continue doing what they were doing for as long as they can get away with? More importantly, don't the investors deserve to get their 'expected' return on their investment?
The expansion of the rate of extraction is now being claimed to be the reason that pipelines must be built. The threat is that if the new pipelines for the unjustifiably expanded, but 'permitted', operations are not allowed then that larger rate of extraction will be shipped in more damaging ways. And the Conservative Federal government deliberately weakened the permission process for pipelines, making it a quicker process and far more difficult for the unacceptable permission of such pursuits to be 'legally' blocked. And the regional popularity and profitability make it even more difficult to stop because 'why should anyone care about the future problems other people may face?'
A sad part is the recent claims of Alberta leadership on climate action. The claims being made are that by taking nominal action regarding CO2 emissions Alberta is granted social license and support for pipelines (or continuing to benefit from the extraction of the bitumen as long as can be gotten away with). It is sort of like claiming that since you properly stop at a stop sign you get the social licence to speed through playground zones, or from a business perspective if you donate to the Food Bank you can pollute the river. No amount of good action grants permission to behave less acceptably, yet popular opinion in Alberta (and outside of Alberta), clearly indicates those ways of thinking are indeed common, and many people actually consider such thinking to be sensible.
That is just the case of what happened in Alberta since the end of the 1980s. Many similarly damaging developments of undeserved perceptions of prosperity have been gotten away with. And it is undeniable that the Trump Administration will try to develop popular support for even more undeserved perceptions of prosperity.
Such actions are claimed to be the proper balancing of economic interests with other considerations. But they deliberately exclude future considerations or any considerations of unacceptability that clearly should Trump any “demand for balance'. The reality of what goes on was well presented in the 1987 UN commissioned report “Our Common Future”. That report made it clear that any reasonably aware wealthy powerful person no longer had any excuse to try to get away with benefiting from an activity that likely created problems for future generations. The following quote from that document states it undeniably:
“.25. Many present efforts to guard and maintain human progress, to meet human needs, and to realize human ambitions are simply unsustainable - in both the rich and poor nations. They draw too heavily, too quickly, on already overdrawn environmental resource accounts to be affordable far into the future without bankrupting those accounts. They may show profit on the balance sheets of our generation, but our children will inherit the losses. We borrow environmental capital from future generations with no intention or prospect of repaying. They may damn us for our spendthrift ways, but they can never collect on our debt to them. We act as we do because we can get away with it: future generations do not vote; they have no political or financial power; they cannot challenge our decisions.
26. But the results of the present profligacy are rapidly closing the options for future generations. Most of today's decision makers will be dead before the planet feels; the heavier effects of acid precipitation, global warming, ozone depletion, or widespread desertification and species loss. Most of the young voters of today will still be alive. In the Commission's hearings it was the young, those who have the most to lose, who were the harshest critics of the planet's present management.”The future for life on this planet is clearly the responsibility of every generation of humanity. And every 'today' is the result of how responsible or irresponsible previous generations were. Real leaders understand their responsibility for the future. Many Winners like Trump care more about 'Appearing to Win any way they can get away with'. The USA is now clearly being governed by Winners for at least 2 years (the mid-term election could change control of the Senate, and maybe even the House). Hopefully the Winners who care less about the future will be encouraged to change their minds and becoming Responsible Leaders. If they don't then the future of humanity loses; It becomes more difficult for other Responsible Leaders to succeed if they have to compete with “People who don't care how they Win”.
- Global weirding with Katharine Hayhoe: Episode 7
nigelj at 07:22 AM on 6 January, 2017Daniel Mocsny @ 18, ok I concede taxation relates to self interest and weighing costs and benefits.
However I'm a pragmatist, and carbon taxes are highly likely to work at least to some extent! Remember rates of smoking have declined from almost 50% of the population in the 1960s to 15% (in my country), and theres strong evidence tobacco taxes form a large part of that drop.
Humans are indeed self interested creatures. I just think this is pretty deeply coded in our genes, and won't be changing fast. Therefore we might as well target this with something like a carbon tax.
However we also have evolved to have an altruistic tendency that helps us make moral choices. However you give no indication of how you would promote this. So far appeals to consider the third world or future generations "fall on deaf ears" with some people.
I dont think its an "either or" situation where we must go with self interest or altruism. It is more likely to be a combination of both. They are not mutually exclusive and history shows they have co-existed for a long time. However right now we probaly have the balance a bit too tilted to self interest.
I think the air travel argument is wearing very thin. This is the only option to attend multinational conferences. I also know for a fact plenty of greenies do take personal responsibility and have voluntarily made some better lifestyle choices.
Of course there are also hypocrites who talk about the need for climate action but do precisely nothing, but not everyone is like this.
A big factor in the climate issue is renewable energy generation, and practically speaking only governments can really push this. Polls show popular support even if it does introduce some costs in the short term (and studies are showing these costs are very small or near break even). Governments however are ignoring the will of the people in some countries, maybe because they are captive to campaign donors.
My point is things are complicated.
But coming back to your moral values point, you offer no indication of how you change peoples moral values. At least a carbon tax sends the signal that fossil fuel use is considered a problem. This at least provides the information people need in order to make moral choices.
Hopefully people learn to do the right thing and rather fast! Sometimes it takes a while for people to make these sorts of decisions but if you look at history, many things in life reach "tipping points" and suddenly there is quite rapid mass change in attitudes, actions and laws.
- It's the sun
Tom Curtis at 10:45 AM on 14 November, 2016Jc @1198, the paper uses four of surface temperature over the last 1000 years to determine independent values for climate sensitivity for CO2, solar activity and volcanoes. In determining independent values, it assumes that a factors impact on temperatures is not a function of alteration of the energy balance, which is unphysical. Using the contrary assumption, based on conservation of energy, that a factors impact is a function of its alteration of the energy balance, you would generate a combined proxy of the factors altering that value and scale it against the temperature proxies. Because of this, I consider the approach of the paper physically invalid regardless of the mathematical validity of the techniques used.
Ignoring that, the uncertainties of the reconstructions of temperatures and forcings over the last 1000 years are very large relative to the uncertainties over the last 136 years. Given this, we would expect the uncertainties to be large relative to climate sensitivity estimates over the instrumental period, wheras de Larminat claims a smaller uncertainty. I would also expect the model(s) obtained over the period of the reconstruction to be tested against the more accurate data, something de Larminat fails to do.
Beyond these more general points, de Laminat uses four temperature proxies, none of which are global. Moberg 2005 is a Northern Hemisphere only proxy, as was Mann 1999. Ljungqvist 2010 reconstructs Northern Hemisphere extratropical temperatures only (30-90 North), and thus covers less than a third of the Earth's surface. Only Loehle 2007 claims to be a global temperature reconstruction, but it takes a simple mean of its (unusually small number of) proxies, and as they are not evenly distributed across the globe, that leads to a very biased coverage. Indeed, 56% of his proxies come from the North Atlantic region (just 22% of the globe), and only two come from the Southern Hemisphere extratropics (both from South Africa). Given that the proxy is generated by taking a simple mean, this is better regarded as a slightly tweaked North Atlantic temperature reconstruction than a truly global one.
Oddly, de Laminat shows a penchant for dated sources. That is clear enough from his use of Loehle 2007 rather than the corrected version, Loehle 2008. It is most obvious in his use of Mann 1999. He defends his choice "there is no reason to discard the reconstruction of Mann: scientific truth does not determine by majority"; but Mann 1999 suffers from a number of minor methodological flaws (some discovered by the original author) and uses a small number of proxies compared to modern reconstructions (other than Loehle). There can be no justification for using it rather than, for example, Mann 2008, which includes a global temperture reconstruction as well. There is even less reason for not using the PAGES 2K reconstruction, the most comprehensive global temperature reconstruction of the last 2000 years.
de Laminat's use of dated, and geographically biased data sets results in regional, particularly North Atlantic temperature variations dominating his results; and is by itself sufficient reason to discount his work.
de Laminat shows his results for what is the best of the reconstructions he uses:

Although he does not directly compare with the recent period, it can be seen his model performs poorly in resolving the 20th century. Out of interest, he also shows a version in which the response to TSI is limited to be no greater than the upper bound of IPCC climate sensitivity (1.62 C/(W/m^2)) As can be seen, so constrained the model works much better in the 20th century (when uncertainties are low), and not appreciably worse in prior periods:

On top of this, he states that for his model, "It can be seen that the output error is large, but comparable with the millennial simulations of IPCC". If comparible, then his model has no claim to superiority even on the geographically biased, uncertain data on which he bases it. It certainly performs much worse on the global, accurate data of the 20th century.
- Watch: Before the Flood
Glenn Tamblyn at 17:20 PM on 8 November, 2016RedBaron
Your numbers don't seem to add up. If carbon lost from the soils is 10 times what we see in the atmosphere, given that known human emissions from fossil fuels are only about 1/2 of what we can see in the atmosphere, that means that 10.5 times the visible extra in the atmosphere has gone somewhere else. 150 years isn't long enough for significant transport to the deep ocean so where could all that carbon be?- Upper levels of the ocean?
- Surface vegetation?
- Where?
No way the ocean could have taken up that much carbon and not be noticed. Gas exchange balance with the atmosphere would mean that concentrations in the atmosphere should be significantly higher. Or if it was organic carbon in the oceans, it would be visible. The graph Tom highlighted doesn't suggest anything like that level. And there is a balance between dissolved organic carbon in the ocean and marine biota. More DOC would produce huge blooms that metabolise a lot of it, converting it to inorganic carbon, entering the carbonate system and being detectable.
Your argument seems to violate mass balance.
What I would question, though I don't know the details, is the claim of 50% loss of topsoil in the last 150 years. Is that 50% of area or volume? Loss of top soil is certainly an issue - an oft quoted figure is 1/3rd of farmland is losing soil faster than it is created. But 50% already lost? Sounds too high. That would suggest that a reasonable proportion of the planet is back to bedrock.
Do you have a source for that number? - Greenhouse effect has been falsified
sjab at 09:04 AM on 25 October, 2016158. Tom Curtis at 08:12 AM on 18 September, 2016
1. I think you understood what he means. It is all simplification and the surface area is just a sign beside a number of importance.
2.Dividing by 4/3pi*r^3 is used when calculating mass-energy density, mostly used for very large masses on a cosmological scale.
It can also be used for radiant energy density:
https://en.wikipedia.org/wiki/Radiant_energy_density
Unit is J/m^3 remembering that Joule per second is equal to Watt. Since radiation moves at light speed TSI can switch units to J/m^3.
I don´t now how you got the very strange unit of W/m^8, as W can just be switched for Joule without problem. It is r^3 that gives the cubic volume the same way that r^2 gives m^2 when calculating effective temperature.
You just extrude the square metre into a cubic metre and switch to Joule. Or, if you are uncomfortable with Joule there are several other names for W/m^3 like spectral exposure or spectral irradiance.
You can view TSI as the bottom of a cubic metre emitting through a square metre, no doubt there is enough energy in solar radiation to fill a cubic metre with an energy density of the same amount as TSI/m^2 in one second, so there is no problem to use W/m^3.
I think that using spherical geometry volume is just the right way to do it. You point at the shrinking volume compared to a cubic metre, and I think that is what makes it work. A squaremetre at the tropopause is represented by a smaller area at the surface, shrinking to a point on the way down to the core.
4. It apparently should be done like that. It seems to work perfectly when accounting for each layer showing what happens at each absorption, first the dry atmosphere and then solid surface and the watercircuit as one body. The number 513 is double the amount of the energy balance between the surface and atmosphere, which also is the mean temperature of the gradient in the troposphere 1027.5/4= 256.875W/m^2. So that number is traceable as well, but to what use? It is of no apparent use and the reason is you not understanding what you were doing.
Interestingly, as I showed, it is not random.
You claim that it is pure coincidence that he gets 770W for the flux of two square metres of the surface. I have looked into this model a bit deeper and found more "coincidences" among other very interesting details. So I will walk you through it and see if you still think that it is pure coincidence.
The effective temperature is 279 at a flux density 343W/m^2 using the whole TSI. 1370/4=342.5
The energy density at the surface is 1027.5J/m^3. 1370-1027.5=342.5(!)
The energy stored in the solid surface mass is 770J/m^3 and the energy balance between the energy density at the surface(1027J) and the following longwave part of the system including the solid surface and atmosphere is 1027/4=257W/m^2. 1027-770=257(!)
Now when absorbed and diffused from half the sphere throughout the entire solid volume, it is more appropriate to use surface flux because we want the surface temperature and the transfer rates through the atmosphere.
Surface flux density is 385W/m^2. Using the energy balance for the irradiation at the surface, 257W/m^2, we get the rate of heat transfer from surface to the troposhere, 385-257=128W/m^2. Which is equal to a flux density of TOA radiation at the temperature 218K(!).
The heat transfer from the atmosphere using energy balance of 257W/m^2 is 257-128=129W/m^2. The exact energy balance for surface irradiation is 256,875 and the exact surface flux is 385.3125.
Using the exact values we get a transfer to the troposphere mean of 256.875W/m^2 of 128,4375 from the surface, exactly half of the energy balance, which is also the intensity equal to TOA longwave flux density.(!!!)
So, when you said that the result 385W/m^2 of surface flux calculated this way by Mr.Sheen is a pure coincidence, exactly what did you mean?
The way he does it, nails the temperature at all relevant points in the surface-atmosphere system. And it balances perfectly leaving nothing left.
An interesting detail is the connection between what is lost in the process of absorption into a new spherical layer and the energy balance between irradiation and that volume. It implies that energy density can be treated
as opposing forces "the old fashioned newtonian way". The force of incoming radiation seems to be balanced exactly on absorption, only transferring the excess into the next layer. It makes me speculate about the absorption process as a macroscopic quantized mechanism.Now, when presented to a more detailed model, accounting for all of TSI through the process of absorption and emission of both short and longwaves, arriving at values at each layer that is very close to observation and following through all the way out back to the system boundary of TOA, not leaving a single Watt left to be questioned, do you stand by that getting a correct surface flux was "pure coincidence"?
I think this has killed the GH-theory in a single stroke. If using solar radiation as mass-energy and making no distinction between them, treating earth as only a empty spherical multilayer canvas where solar energy is projected, it seems to account for every single watt in the system, putting them in the right places as well. This makes everything above the surface pure solar energy only, which of course is correct since it is the only source of energy present.
Irradiation accounts for both mass and energy at the same time. Making everything above the solid surface a pure product of E=m*c^2. Where all mass above surface is existing in space at squared lightspeed.
The sphere as the only factor explaining the energy inside the system in more detail than the GH-model, accounting for all energy and mass, means that nothing inside the system is acting, it is only reacting. Everything from temperature to albedo or glaciers is a product of energy density in relation to the electromagnetic field. The temperature cannot rise. Unless the sun increase the mass-energy density in the field where earth is positioned.
I think you just lost every bit of credibility and relevance that you imagined that you have in the discussion of climate, climate change and temperature. If you had avoided the aggressive and insulting attitude, and thoughtless throwing of words like "packed with flaws"and "a discussion so jam packed with fundamental errors of geometry", when it actually was you that was incapable of seeing the relationship that I spotted immediately when reading it, you would have spared yourself a lot of shame.
The thing is, the model performed better than GH-theory even when there only was "pure coincidence" that it got the surface flux right. Because that has been the problem all along. Gh-theory don´t even explain anything about the planet, since the effective temperature is the "blackbody", which is an isothermal body with the same temperature throughout, abosrbing and emitting at an infinately thin surface positioned at TOA. That is something that never will exist and the reason for using it as base for the distribution of energy in the system is unclear.
The model of GH-theory is a pure expression of misunderstanding all "science" included. It fails to represent century old concepts of radiation, electromagnetic field, temperature, energy density and heat transfer, claiming to stand on a base of physics.
Next time, remind yourself of carefully analyzing what conclusions that NOT can be drawn from the information you have. That was a big part of physics back when these concepts where discovered. It was probably the key to their great success.
To calculate effective temperature and then discovering the difference to observation, it is a bad idea to use that as a base for new conclusions.
You claimed in bold letters that Mr.Sheen`s formula was in error, but it is you that were in error. Mr.Sheen was exactly right. As you see, that shit is flawless and shiny perfection.
You should have continued to investigate why there was a error in your model instead of assuming that effective temperature is almighty. You only had to read the definition of a blackbody to realise that effective temperature says nothing of how hot the surface should be. It tells you the flux density that would be emitted at the tropopause if the earth had the same temperature through it´s entire volume, absorbing and emitting from a perfectly black infinately thin surface.
A model of what the opposite of earth would emit 10km above the surface was a bad choice for modeling the climate.
The comments about "pure coincidence", the flaws and implying your superior knowledge about geometry and units must seem like a bad idea now. Climate science seems to have kept you in place eating your humbleness and made you blind, leaving you with nothing left but shame.
You should at least have had a second look seeing if there were more "coincidences". I learned a long time ago that I don´t know everything, not even when I know everything.
- Global warming theory isn't falsifiable
Glenn Tamblyn at 20:10 PM on 15 October, 2016Kevan. Here is a comment I tried unsuccessfully to post on your blog
------------------------------------------------
Kevan.
I am new to your blog and I have just read through your series on the Carbon Cycle. Unfortunately your analysis misses some key issues and is quite wrong.
What you argue reflects the understanding of the oceans role in CO2 balance that stood during the 1st half of the 20th century. Even as late as the beginning of the 50's this was still the official view of the American Meteorological Society. However advances in oceanography and the understanding of ocean chemistry in the next few years overturned this. Your analysis does not reflect that.
Firstly, Oceanography understands ocean circulation quite well. The top 100 meters of so is very well and rapidly mixed through wave and wind actions. Below this the ocean is highly vertically stratified. Importantly this highly stratified ocean only allows extremely slow diffusion of any chemical, including dissolved CO2 for example, vertically. This has been confirmed by chemical tracer studies for example. By diffusion alone, major changes between the surface and the abyss would take millenia. However major vertical ocean currents in some regions mix the ocean more rapidly than this, but still on timescales of many centuries. It is said that a water molecule sinking to the sea floor in the North Atlantic wont return there for 1000 years. These two processes define a characteristic timescale for propagating changes from the surface to the depths. Changes on timescales of decades only impact the upper ocean.
So your simple model of 'a reservoir' is unphysical. The proportion of the ocean engaged with the surface is dependent on the timescale of the event. The 'size' of your reservoir is a time dependent value.
Secondly, most of your discussion portays the carbon in the ocean as all CO2. In one post you do mention it as being carbonate, but don't follow through with that concept.
The carbon content of the oceans, excluding biomass, is referred to as Dissolved Inorganic Carbon (DIC). It exists in an equilibrium between 4 states. Dissolved CO2 (CO2aqueous), Carbonic Acid (H2CO3), Bicarbonate ions (HCO3-) and Carbonate ions (CO3--). The balance between these four forms depends on the reaction kinematics of the respective reactions that convert between these forms.
CO2aqueous + H20 H2CO3 HCO3- + H- CO3— + 2H-
This link is a Bjerrum plot, showing the proportions of each form present depending on the ph of the water. CO2 & H2CO3 are grouped together. Note the vertical scale is logarithmic. [LINK]

Notice that most carbon is as Bicarbonate, with 10% Carbonate. CO2/H2CO3 is around than 0.5%. And note also the dependency of these concentration proportions on pH - this is the origin of the problem of Ocean Acidification.
This is actually more complex than this since ocean pH isn't just governed by the reactions above but other factors such as Boric acid concentrations. The detailed chemistry of this was first worked out in the 50's by Roger Revelle.
These chemical relations and the kinematics governing them constitute another partitioning of the 'reservoir' - different chemical reservoirs. Carbon as bicarbonate for example is only available to potentially be exchanged with the atmosphere as CO2 when the kinematics allow the reverse reactions to dominate.
So your hypothetical single reservoir needs to be considered as multiple separate sub-reservoirs separated spatially and temporally, and chemically. Only the surface/CO2 reservoir is engaged in gas exchange with the atmosphere
Your broader analysis may come to reasonable answers when applied to long enough timescales (multiple centuries) but still can be limited by the chemical constraints. So the long recovery times for a major CO2 increase presented in the scientific literature are based on these factors. Short term surface mixing processes, multi-centenial scale deep ocean mixing timescales and chemical reponses.
For instance, the truely long term response that recovers CO2 levels is chemical. After ocean mixing has done the maximum possible, there is still a remaining, slow chemical response that achieve the final draw down, on multi-millenial timescales.There is one final class of reactions that can occur in the ocean.
CO3— + Ca++ CaCO3.
Carbonate reacts with calcium ions and other minerals ions in the oceans to be deposited as things like Calcium Carbonate - Limestone. This is the final equilibration. The Carbon is deposited on the sea floor as rock.
The response to a major increase in atmospheric CO2 does give a very long timescale for recovery - centuries.
- Greenhouse effect has been falsified
C.Sheen at 22:16 PM on 17 September, 2016https://scienceofdoom.com/156. Tom Curtis at 07:01 AM on 25 July, 2016
You are right, it is correct to divide by four for an approximation of earth temperature as a blackbody. If one uses the irradiation combined with albedo, you get a correct energy balance.
That´s how we calculate what a body radiates to space. But I agree with fake reality that it should not be used as a surface temperature for solid mass. It is the temperature that a blackbody had when it is totally isentropic, the same temperature throughout it´s whole body, It should also be absorbing and emitting all radiation at it´s surface, which would be at the top of the atmosphere, or the point where 1370W-albedo is the mean flux.
Since we are dealing with a sphere, and it is only irradiated on half the surface area, and we know that convection and conduction dominates the surface exchange, we should use radiant energy density instead. It has the units J/m^3 and for a sphere we get that by dividing the fluxdensity with 4/3pi*r^2 instead of 4pi*r^2. It is done for all volumes in contact via surfaces, so for the earth surface it is done twice, once for the atmosphere and once for the solid surface.
In wikipedia we can read:This article is about energy per unit volume.
Energy density is the amount of energy stored in a given system or region of space per unit volume or mass, though the latter is more accurately termed specific energy. Often only the useful or extractable energy is measured, which is to say that chemically inaccessible energy such as rest mass energy is ignored.[1] In cosmological and other general relativistic contexts, however, the energy densities considered are those that correspond to the elements of the stress–energy tensor and therefore do include mass energy as well as energy densities associated with the pressures described in the next paragraph.
Energy per unit volume has the same physical units as pressure, and in many circumstances is a synonym: for example, the energy density of a magnetic field may be expressed as (and behaves as) a physical pressure, and the energy required to compress a compressed gas a little more may be determined by multiplying the difference between the gas pressure and the external pressure by the change in volume. In short, pressure is a measure of the enthalpy per unit volume of a system. A pressure gradient has a potential to perform work on the surroundings by converting enthalpy until equilibrium is reached."
https://en.wikipedia.org/wiki/Energy_density
When circumstances is that the energy exchange is dominated by conduction and convection at a surface, this is the preferred way to address the energycontent of the solid surface, which is the cause of the surface temperature.When dividing 1370W by 4/3 two times we get an absorbed amount of 770W/m^3. Like I pointed out earlier, earth only gets energy on half the surface, we need to distribute the energy absorbed to twice the volume of the sphere. That can be done in several ways, but dividing by two works good. Half the surfacemass is excited to a level equal to the mean total surface mass constantly. 2m^3 will radiate what is absorbed in 1m^3. That gives us 385W/m^3 radiated through 1m^2. Which is in line with observations.
Then we can find out what earth radiate to it´s outer shell from dividing by four, then we get the atmospheric window of 96W/m^2.
The effective temperature, the energy balance, is then 342W/m^2 for TOA-radiation. And the balance for the surface and atmosphere is 256W/m^2. The TOA-temperature we get from substracting 256W/m^2 from 385W/m^2, which becomes 128W/m^2. This is all done with simple geometry and such a simple solution seems to be correct. Especially considering what my wiki-link says, that it can be connected easily to pressure, magnetic field, enhtalpy etc. as well as W/m^2 and Kelvin. It accounts for mass, volume and the relative energy.
It seems that weather and climate are only products of geometrical functions and solar radiation.
I think your model of radiation, energy and the earth is lacking quite a bit. - Climate urgency: we've locked in more global warming than people realize
RedBaron at 14:37 PM on 18 August, 2016@saileshrao,
One solution is parallel to Freeman Dyson’s geoengineering “solution” of just plant more trees. There are many reasons this won’t work, but the basic one is that planting trees increases stocks, but doesn’t stabilize fluxes. Using the bucket analogy, you have a created a bigger bucket, but still a bucket with no drain. It helps temporarily … until the new bigger bucket gets full. We call that Saturation. It’s a temporary fix that helps, but it is not a long term solution.
However, maybe even accidently, Dyson might have stumbled onto something that can solve AGW to the benefit of all.
Atmospheric CO2 level is the primary human impact we can change that directly influences energy flows. It comes down to the carbon cycle and the CO2 fertilization effect. Dyson is correct BTW that there is more carbon in the soil than in biomass and atmosphere combined. Also correct about the fertilization effect on plant growth. This is what is called a stabilizing feedback. The debunkers of Dyson are also correct about the increasing emissions from the labile fraction of soil carbon as temperature increases. Called a reinforcing feedback.
Here is where it gets interesting. Dyson AND the vast majority of the Dyson debunking sources have focused on the wrong biome. It is NOT the forest plants that have the capability to mitigate AGW. It’s the grassland/savanna biome that actually can be a forcing for global cooling, and counter the current global warming trend.
In a forest, the stabilizing feedbacks and the reinforcing feedbacks largely counter each other, and little is done long term to mitigate rising CO2 levels. Once you reach that saturation point you are done. You might even decrease albedo. But grasslands sequester carbon very differently than forests. Most grassland carbon is not sequestered in biomass, nor labile carbon in the top O horizon of the soil, but rather the newly discovered liquid carbon pathway. Grasslands also have higher albedo.
Most terrestrial biosphere carbon storage is in grassland (mollic) soils. Where trees store most their products of photosynthesis in woody biomass, grasslands instead of producing a woody tree truck, secrete excess products of photosynthesis (exudates) to feed the soil food web, especially mycorrhizal fungi. Those fungi (AMF) in turn secrete a newly discovered compound called glomalin deep in the soil profile. Glomalin itself has a 1/2 life of 7–42 years if left undisturbed. The deepest deposits even longer with a 1/2 life of 300 years or more in the right conditions. Then when it does degrade a large % forms humic polymers that tightly bind to the soil mineral substrate and can last thousands of years undisturbed. Together they all form what is called a mollic epipedon. That’s your really good deep fertile soils of the world and they contain far more carbon, even in their highly degraded state currently, than all the terrestrial biomass and atmospheric CO2 put together. This LCP is what built those famously deep and fertile midwest soils.
Even though wood is resistant to decay, the biomass of forests is still considered part of the active carbon cycle (labile carbon) That litter layer on the forest floor is relatively shallow, and most that decay ends up back in the atmosphere, unless locked in some kind of peat bog or permafrost. Tightly bound soil carbon in a mollic epipedon is considered differently than the labile carbon pool. It is the stable fraction of soil carbon, and grassland biomes pump 30% or more of their total products of photosynthesis into this liquid carbon pathway.
The importance of this recent discovery of the Liquid Carbon Pathway (photosynthesis-root exudates-mycorrhizal fungi-glomalin-humic polymers-mollic epipedon) to climate science AND agriculture can not be stressed enough.
Glomalin: A soil protein important in soil sequestration
Glomalin Is Key To Locking Up Soil Carbon
Liquid carbon pathway unrecognised
Cenozoic Expansion of Grasslands and Climatic Cooling
So while specifically Dyson was wrong, he has identified in the most general terms the pathway forward. “Plants” is too general. Forests is categorically wrong, although we still need them for their rapid buffering capability on climate as well as many other important ecosystem services, not to mention lumber. But the forcing of CO2 mitigation long term comes from the grassland biome, now largely under agricultural management and that is plants after all. Dyson got the wrong plants and the wrong soils, but did hit on the right concept.
The real question is can this mitigation strategy work within conservative ideals so that a political coalition between both liberals and conservatives can be made to devise a plan acceptable to both? It is pretty obvious that a carbon tax has and will continue to meet with opposition.
I believe it is possible, yes. But certain areas will take dramatic change for that to happen. Most importantly energy and agriculture. Right now both those sectors have already overgrown what can be sustained. Quite predictable since they were never really sustainable since the industrial revolution anyway. Just took a while for people to realise it.
For it to happen though, agriculture production models will need to be changed to regenerative systems, energy will need technological fixes like solar and nuclear etc. and overall since population has already exceeded environmental capacity, a large amount of ecosystem recovery projects will be needed as well. So yeah, reforesting can be a part where appropriate. All of these are possible, however I personally believe they are unlikely to happen on their own given social and institutional inertia.
My focus is on agriculture. Having studied it quite intensely for years, I believe we currently have the ability to fix that one. Only a few minor gaps remain. I can only hope others committed to the other two big ones meet with similar success. But then comes the hard part, actually doing what we know how to do before these unsustainable systems currently in effect start failing world wide, collapsing even our ability to do what we know how to do! That’s the actual tricky part.
For example, if agriculture fails before we fully institute regenerative models and the infrastructure changes needed, civilization collapses. Not much going to be done about it then. AGW will see to it that all three will fail if changes are not done soon enough. Once again with the potential to collapse civilization, or at least many nations including ours. Again making it near impossible to implement what we already know how to do.
So how do we institute the changes needed in a free market economic base beneficial to mitigating AGW?
The most important leg is agriculture. The answer may be more simple than you think. The rise of “king corn” can be seen as a direct result of a series of changes in agricultural policy instituted by Earl Lauer Butz, Secretary of Agriculture under Presidents Richard Nixon and Gerald Ford. Most important to this policy change was the Buffer stock scheme (ever full granary) combined with urgings to farmers to “get big or get out”. (Which happened by the way. Now there is actually a crisis from too few family farmers, average age being 60.) That led to huge surpluses which we then were able to successfully use for many purposes, including major grain sales to Russia and China and many humanitarian aid projects.
Something has changed though. Now China has opened up beef sales. This is a value added commodity over grain. It makes more sense to drop the buffer stock scheme on grain, and instead I propose a buffer stock scheme on grass fed beef instead. You can do this on the same amount of subsidies that we currently use for grain, and instead put them on restoring the great prairies/steppes/savannas of the world….raising beef. This would positively affect carbon sequestration, pesticide use, erosion, seasonal dead zones in our productive coastal waters, biodiversity, energy budget, economic growth, international trade balance, rural economic development, etc… AND if done properly, as many case studies at the USDA-SARE & USDA-NRCS clearly show, even increase total yields of food for humans.
So to fully answer, instead of adding a carbon tax, one way to solve this is simply change what we subsidize. No need for new taxes. In agriculture instead of a buffer stock scheme on king corn, a buffer stock scheme on carbon being sequestered in soils. Just redirect the same amount of funds away from one to the other. Same goes for energy. Fossil-fuel consumption subsidies worldwide amounted to $493 billion in 2014, with subsidies to oil products representing over half of the total. Those subsidies were over four-times the value of subsidies to renewable energy. Simply redirect the subsidies for fossil fuels over to renewables. Doesn’t necessarily need to cost one penny more.
The idea that we are still subsidizing AGW, while trying to find solutions to AGW is quite frankly ridiculous. Goes to the wise old saying, “A house divided against itself can not stand.”
Now for some interesting general numbers. “Under appropriate conditions, 30-40% of the carbon fixed in green leaves can be transferred to soil and rapidly humified, resulting in rates of soil carbon sequestration in the order of 5-20 tonnes of CO2 per hectare per year.”
Liquid carbon pathway unrecognised
Fast facts: The State of the World’s Land and Water Resources
5-20 tonnes of CO2 per hectare per year x 1.5 billion hectares = 7.5 - 30.0 billion tonnes of CO2 per year AND that's just arable cropland, that doesn't even include the ecosystem recovery projects that could be done on degraded desertified rangeland mentioned by Allan Savory in his famous TedTalk. That's actually a larger area of land, but much more complicated to calculate. Because some rangeland is healthy and currently sequestering carbon in the LCP. A larger % is degraded by overgrazing and/or undergrazing, both causes of desertification and either nearly net zero flux, or actually a CO2 emissions source. Depending on the brittleness factor, they also each respond differently when properly managed. So it is difficult to quantify exactly how much more CO2 could be sequestered per year restoring these areas, but likely even more total (but less per hectare). China's restoration project of the desertified Loess Plateau early results shows just how significant this can be.
Soil carbon sequestration potential for "Grain for Green" project in Loess Plateau, China
Pasture Cropping: A Regenerative Solution from Down Under
The System of Rice Intensification (SRI)…
… is climate-smart rice productionThe next two have USDA case studies on file with the USDA, and instructional vids. I will post both.
No-Till Case Study, Brown's Ranch: Improving Soil Health Improves ...
Gabe Brown: Keys To Building a Healthy Soil
and
12 Aprils Grazing Dairy Manual
Trantham's Sustainable 12 Aprils Dairy Grazing Program: A Top Farm that Almost Went Under
As you can see, more food per acre. Little to no cost. More profitable. Large enough.
- The War on Science will change how you see the world
nigelj at 09:04 AM on 2 July, 2016I will be buying a copy of this book. I agree with your comments about post modern ideas about alternative sources of "truth" and how bizarre this is, and the resulting fake balance issues in the media especially on climate change.
Another issue is science expertise in the mass media, or the lack of this in some cases. By mass media I mean traditional newspapers and television, not websites like this. In the past the mass media, such as newspapers seemed to have science editors and quite decent science articles. I have noticed this has fallen away recently, and wonder if competition between the internet and traditional media has eroded traditional media, and people employed with some science expertise have been the first casualties of job cuts.
Of course there are excellent science based websites like this one, however most people don’t have huge time to read and get their overall impression from news articles on television or in the newspaper. I'm not sure what the answer is, other than to implore all media outlets to have some qualified science writers of repute, and having respect for mainstream science positions. It would also be great if the mass media was better aware of specialist websites like this, and referenced them more often.
Another issue is we may be a victim of our own success. Science has delivered a prosperity some people take for granted, and now feel free to indulge in their anti science conspiracy theories when it suits. They are in effect biting the hand that feeds.
Certain people also seem able to achieve the mental feat of believing in both science and creationism, and I just don’t know how they do this.
Of course we also have this attack on science from various ideologically driven groups. Ideology is about belief, and science is about evidence, and they make for uncomfortable bed fellows.
The attacks on science from groups with vested interests, or religious or political ideologies is quite vicious.
Conservative think tanks are not always friendly towards science, although doubtless some liberal ones may not be either. However the more interesting thing is what drives this. Make no mistake these bodies wield a pervasive power beyond their apparent size. Maybe the drive in recent decades towards belief in "free markets" and the private sector has created the environment that generates powerful and well funded behind the scenes lobby groups and policy foundations that become in turn quite driven by their own need to exist and prosper, the same criticism that has been made of government bureaucracies!
However the bottom line is these attacks on science are rarely soundly based, and are driven by vested interests, ignorance and fear in many cases.
- Climate's changed before
Glenn Tamblyn at 20:37 PM on 23 June, 2016Doodad - nice tag by the way :-)
Is this a drive-by or do you have specific points to make.
And by the way, current CO2 is more like 400, not 350 ppm.
Yes there are mechanisms that draw down CO2, just as there are mechanisms that can raise it. The key question is over what timescales. Come back in a million years and our disruption of the carbon cycle will have disappeared from the climate system. However its signature will be visible for 10's to 100's of millions of years in the geology.
How could an Ice Age have happened when CO2 was 5000 ppm (very approximately)? Perhaps if they dropped!
Your figures of 4% lower solar and 5000 ppm suggest you are referring to the End Ordovician Ice Age (and Mass Extinction Event). You might help discussion if you clarify that.
So using the standard definition of the impact of changing CO2 levels - similar impacts for each doubling, 350 ppm (your number) to 5000 ppm, is under 4 doublings - 700, 1400, 2800, 5600. So somewhat under the impact of one doubling. One doubling changes radiative balance by 3.7 w/m^2 so around 14.8 w/m^2 in total. Actually when we look over larger ranges of CO2 concentrations this change is lower, so less than 14.8.
Then solar was 1310.8 rather than 1365.4 watts per square meter today - your figures. The current estimates are more like 1361, the 1365 figure was likely a small calibration error from an earlier satellite. Small detail.So on your figures, a difference of -54.6 w/m^2. But we need to divide by the ratio of the Earths frontal area to its total area, so divide by 4. -13.65 w/m^2.
Hmmm... Not much difference. So if CO2 dropped back then, an ice age is entirely plausible. A drop from 280 to 180 ppm today is associated with a swing into an ice age. That is the equivalent of a swing from 5000 to 3200 ppm back then. What might trigger that? The evolution of vascular plants drawing down CO2? Major volcanic events sequestering CO2 due to weathering?
We don't know everything about the past but it sure fits with CO2 being a significant factor. - Temperature tantrums on the campaign trail
ranyl at 06:23 AM on 25 March, 2016Thanks Andy,
Interesting and informative.
One small thing...
On the second graph where the red line shows raw, the green adjusted and the dashed the adjustments, I presume that the adjustments are the corrections needed to raw data in order to derive the adjusted temperature recorded. Until ~2014 that presumption seems to match the graph. However in the very last part of the graph the green adjusted record seems to surge above the unadjusted raw data red line. For me this might give the impression that in 2014 the adjusted data set is higher than the raw data set, yet the adjustment needed to the data plot (dashed line) at the same time seems to be basically running at zero. Therefore it seems in order to give the true picture that the 2014 warmth is real and definitely not part of the complex adjustment process, that the red line should overwrite the green line as per the rest of the zero adjustment period?
Just seems strange to plot such a sudden departure at the end of the graph between the red (raw) and green (adjusted) lines, when the adjustment needed is zero?
Anyway as you say a primary message is that the adjustments needed have actually meant that the amount of global warming that has been experienced is less than the raw would suggest.
Be interesting to see where 2015 to date would lie of the graphic, suspect they would be off the scale as it is, especially this January and February.
It is also going to be interesting to see how much the Arctic sea loss albedo flip accelerates things soon, keeping in mind, in summer the Arctic gets more solar energy input than the tropics so the ice melt should be adding some warming push soon, and Arctic temperatures are racing well away already and the Arctic air mass does spread south to dissipate the heat gathered further.
I do wonder sometimes if a chaotic system coming into adjustment from a major increase in heating input might experience jumps into higher temperature states at times rather than always following a linear climb, especially if the input is rapid and leads to a sudden large energy imbalance for the earth's systems to have to adjust to.
I also do wonder what the quickest way to get heat from the tropics to the poles to realign the energy balances as quickly as possible is?
The laws of thermodynamics do mean that any energy imbalance has to return to equilibrium as quickly as possible and that is why heat always finds the fastest way to travel when going from hot to cold.
Or more to the point what convective heat transfer system will move heart from the tropics to the poles in the quickest way possible I wonder and how will affect world weather systems?
The Hadley system’s dynamics (that create the world’s weather patterns) can change apparently and even becomes a large unicellular system from the tropics to poles if the temperature differential between the two is shallow enough.
Now that would change the weather.
Interesting times... - Q&A: Is Antarctica gaining or losing ice?
Tom Curtis at 10:06 AM on 6 November, 2015Cooper13 @8, GRACE measures the mass changes due to the combined effect of Glacial Isostatic Adjustment (plus any other process effecting the altitude of the base rock) plus ice balance. If the baserock of Antartica were sinking, that would confound the results from GRACE. That said, Riva et al (2009) combine GRACE and altimetry data to determine that the GIA adjustment is positive, ie, that the base rock is rising. By their estimate, the effect of the GIA is 100 Gt/year which should be added to the direct GRACE results to get the actual loss in ice mass. That adjustment is uncertain, however. Ivins et al (2013) estimate GIA only contributes 57 Gt/annum to the Antarctic mass gain. Zwally et al list that result (and others) in table 8, having converted it to mm/year uplift. Based on that result and Whithouse et al (2012) who show (according to Zwally et al) 5.4 mm/year uplift, Zwally et al use an estimate of 8 mm/year uplift.
- Q&A: Is Antarctica gaining or losing ice?
sidd at 08:45 AM on 5 November, 2015
What about the sea level budget ? Due to the hard work by Cazenave, Leuilette, Miller and many others the budget was thought to be balanced between steric and mass components, with the latter estimated at 1.5mm/yr. Now, if this paper is to be believed, something other than Antarctica is contributing 0.5 mm/yr to mass component of SLR. This leaves Greenland melt, GIC (other glaciers and ice caps) melt, and land aquifer withdrawal as candidates. I find it quite difficult to believe that any of these was underestimated to such an extent. - Antarctica is gaining ice
KR at 07:04 AM on 4 November, 2015At this point Zwally et al is quite the outlier, both from GRACE data alone and from the collection of other Antarctic mass balance work.
- Zwally et al might be wrong (or rather, far more wrong than other estimates, outside error bounds), perhaps due to the a snow/ice compaction model that is rather different from what is generally used - a very small error there would throw off their computations.
- Zwally et al might be completely right, indicating that their compaction model is correct and nobody elses is, calling into question all those other works along with GRACE calibrations. I consider this rather unlikely.
- Or Zwally et al might be off-base, but other studies are overestimating mass loss somewhat.
We're going to have to wait and see how the science progresses. At this point, however, most of the evidence indicates some mass loss from the Antarctic continent, Zwally et al is inconsistent with both the GRACE gravity data and estimates of the sea level rise budget, and we need to be careful not to fall prey to 'single-study syndrome'.
- Antarctica is gaining ice
MA Rodger at 01:35 AM on 3 November, 2015barry @431 & peter @432.
Be mindful that this is not the first time in which Zwally has proclaimed the ERS & ICESat data as showing a net rise in Antarctic ice. A workshop paper in 2012 (abstact & video with gap in coverage - here) also resulted in calls here at SkS for revision to this post (along with more forceful demands elsewhere by the likes of the Lord Protector of Wattsupia).
This time round, the journal article is so hot-off-the-press it has yet to appear on-line so it's a little early to be getting all excited. Until the new finding is appraised, best we make do with Hanna et al (2013) which is a paper co-authered by Zwally. It broadly discusses work in-hand plus future developments before concluding:-
"However, it is unlikely that these refinements will change the consensus picture emerging: while Antarctica as a whole is losing mass slowly (assessed to be contributing 0.2 mm yr-1 sea-level equivalent by IMBIE2), Greenland, the Antarctic Peninsula, and parts of West Antarctica are together losing mass at a moderate (~ 1 mm yr -1 sea-level equivalent) rate today (~70% of this mass loss is from Greenland) and rates for each are becoming increasingly negative." (my bold)
Figure 1 from Hanna et al (2013) demonstrates this 'emergence'.
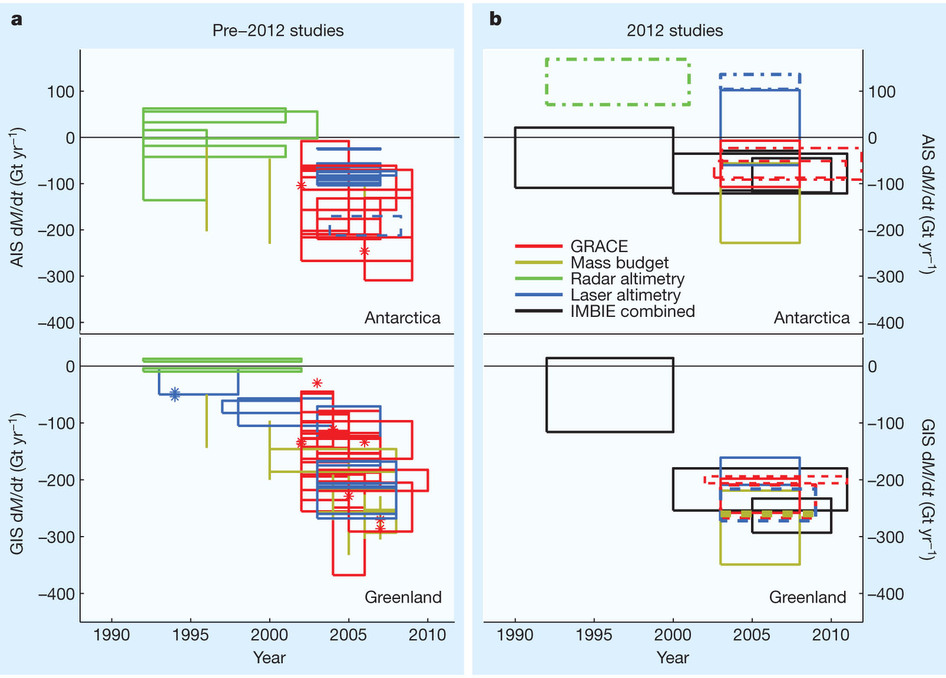
Figure 1 caption. Summary of Antarctic and Greenland mass-rate estimates. In the studies published before 20122 (left) and in 2012 (right) each estimate of a temporally-averaged rate of mass change is represented by a box whose width indicates the time period studied, and whose height indicates the error estimate. Single-epoch (snapshot) estimates of mass balance are represented by vertical error bars when error estimates are available, and are otherwise represented by asterisks. 2012 studies comprise IMBIE combined estimates2 (solid lines), and estimates by Sasgen and others16,20 and King and others11 (dashed lines), Zwally and others19 (dot-dashed lines), Harig and Simons89 and Ewert and others90 (dotted lines).
Note that it is not just a need to reconcile this most recent Zwally paper with the other methods employed to assess East Antarctic ice balance. Both the linked pages @431&432 quote Zwally pointing out that these ERS & ICESat data have to be also reconciled with SLR data.
And my answer to peter's question "Would this Zwally paper make the myth true?" that answer would be - "No". ERS & ICESat data continue to provide some evidential support for the 'Antarctica not losing ice' position which remains strongly a myth when presented as unequivocal fact, and doubly so when the mythical Antarctica ice balance is then presented as some natural global thermometer. Indeed, does it even work as a thermometer for Antarctica?
- Antarctica is gaining ice
barry at 20:37 PM on 1 November, 2015Recent study shows mass balance increasing.
http://phys.org/news/2015-10-mass-gains-antarctic-ice-sheet.html#jCp
Worth mentioning in the OP as an update? Or wait for the study to become available? - CO2 lags temperature
MA Rodger at 09:59 AM on 8 October, 2015Tom Curtis @496.
I think you are asking for more than tatelyle is capable of providing. Consider his track record down this thread & make your own judgement. Below I collate the interchange that led to your comment @496. It is interesting how often tatelyle actually argues against what is his own misunderstanding. Even tatelyle's attack on Hansen & Sato (2012) leads him to his back of a fag-packet calculation @494 which looks to me as though he perhaps also mistakenly multiplied by the number of cigarettes in the packet, because with the model tatelyle tries to use the albedo effect seems to confirm Hansen & Sato. But, of course, that would never do because with tatelyle it is ABC - anything but carbon.
☻ TC@481 "(M)ilankovitch cycles can only significantly effect global temperatures if there are, not just feedbacks, but differences in th feedbacks that depend on location and season."
☻ tl@487 to TC "(You say ) Milankovitch cycles require feedbacks?
I understand all your arguments, that overall insolation cannot change much. However, the critical season and region for Ice Age modulation is the NH summer at northerly latitudes, because of the large NH landmass, as you say. It is this insolation that will decide whether the winter ice sheets melt, and so it is this region that will modulate Ice Ages."
☻ TC@489 to tl "Causing "winter ice sheets" to melt is a feedback. Further, it is a seaonal and regional feedback. If the seasonal and regional feedbacks in all areas and seasons were equally strong, then that feedback would be balanced by other, opposite feedbacks."
☻ tl@490 to TC "(you say) feedback would be balanced by opposite feedbacks because the changes in global annually averaged insolation balance out? But that is not true is it? - because as you said the NH and SH are very different, and so there is no 'balance' or equivalence between them.
So although the Ice Age becomes a global phenomina, it is triggered and forced by northern hemisphere Milankovitch forcing and only by northern hemisphere forcing. That is an indisputable fact."
☻ MAR@492 to tl "Answers on how ice ages happen are not simple. So are you then still happy to assert "So although the Ice Age becomes a global phenomina, it is triggered and forced by northern hemisphere Milankovitch forcing and only by northern hemisphere forcing. That is an indisputable fact."? (My bold)
☻ tl@493 to MAR "I was trying to counter the previous statement by Tom that 'Causing ice sheets to melt is a feedback'. Sorry, that is wrong. There needs to be a trigger, before feedbacks can assist in that process. Tom was trying to undermine the value of NH Milankovitch forcing, and I think I have successfuly countered that argument."
☻ TC@496 to tl "The brazen assertion that "Causing ice sheets to melt is a feedback" is wrong evidently needs some clarification."
- CO2 lags temperature
Tom Curtis at 08:52 AM on 5 October, 2015tatelyle @487:
"I understand all your arguments, that overall insolation cannot change much. However, the critical season and region for Ice Age modulation is the NH summer at northerly latitudes, because of the large NH landmass, as you say. It is this insolation that will decide whether the winter ice sheets melt, and so it is this region that will modulate Ice Ages."
Causing "winter ice sheets" to melt is a feedback. Further, it is a seaonal and regional feedback. If the seasonal and regional feedbacks in all areas and seasons were equally strong, then that feedback would be balanced by other, opposite feedbacks because the changes in global annually averaged insolation balance out (for all intents and purposes). It would follow that there would be no net change in GMST. That is the point of the arguments above. Ergo, when you say "I understand all your arguments" but "feedback", which is essentially what you have said, you clearly do not understand the arguments at all.
"And as that Milkanovitch graph shows, the critical summer NH insolation can change by up to 25% during the Milankovitch cycle. Not a few wm2 here or there, but a whopping 90 wm2. So why would the 4 wm2 provided by CO2 be significant, in comparison to the 90 wm2 of the Milankovitch cycle?"
The Earth has 46 million kilometers squared of area North of 55 North, out of a total of 510 million kilometers squared. That represents 9% of the Earth's total surface area. Further, Summer constitutes just 25% of the year. Ergo, your 90 W/m^2 at 65 North in Summer is equivalent to 2 W/m^2, globally averaged. So why would the 3.7 W/m^2 globally averaged forcing from a doubling of CO2 by more significant than the 2 W/m^2 globally averaged milankovitch forcing when we ignore everything but the milankovitch forcing in Summer in the high NH? Or the less than 0.4 W/m^2 globally averaged forcing if we include the full milankovitch forcing?
Your original question was why do we need to infer strong feedbacks given that the seasonal/regional milankovitch forcing was strong. Even only considering that forcing (ie, ignoring the opposite milankovitch forcings in other regions or seasons), the globally averaged mean annual temperature would only change by 0.65 C without feedbacks. In practise it changed by about 5 C. Further, the SH temperature changes have the same sign, and approximately match the size of the NH temperature changes. That would be impossible unless at least one of the feedbacks was necessarilly global in nature, and quite strong (to counteract the opposite signed local milankovitch forcings in the SH).
- Antarctica is gaining ice
MA Rodger at 02:28 AM on 12 August, 2015Antarctic ice loss is certainly accelerating. A plot of the rate of change of mass balance from the data graphed below (two clicks down the link) perhaps is starting to show an increase in that acceleration, LINK , although it is early days for anything more than speculation.

- Global Commission Finds Economic Growth Can Close the Emissions Gap
ranyl at 02:15 AM on 10 July, 2015Deforestation Free:
"be traceable to the plantation where it was produced;
- come from plantations whose expansion does not threaten High Conservation Value (HCV) forests (*);
- come from plantations whose expansion does not threaten High Carbon Stock (HCS) forests (*);
- come from plantations whose expansion does not threaten any tropical peatland, of whatever depth;"
Does that mean it can be labelled deforestation free and chop down non HCV's forest areas?
Also apparently plantations greater than 10 years old are now deforestation free.
Maybe if oil (much less than Palm oil) could from regeneration tropical forests and peatlands that might actualy help?
For sure deforestation, (unless as part of a long term sustainable rotation with periodic full regneration over several hundreds of years to provide materials, food and naturla zoos (e.g. Oak coppice woodland with clearings and paths)), needs to be halted, however don't we need to urgently regenerate tropical rain forests and peatlands and maybe put less oil in our diet and products?
Do Indonesia's native rainforests have any useful products that can be harvested within an overall ecosystem balance?
Wonder if using Palm oil for fuel will become classified as deforestation free?
Or is deforestation free the BAU mentality massaging the fields of perception or is there hope?
- Antarctica is gaining ice
KR at 05:11 AM on 3 June, 2015bozzza - The differences in the Arctic are perhaps 1/4 the ocean thermal mass as global ocean averages, small overall size (the smallest ocean), being almost surrounded by land (which warms faster), more limited liquid interchanges due to bottlenecking than the Antarctic, and very importantly considerable susceptibility to positive albedo feedbacks; as less summer ice is present given current trends, solar energy absorbed by the Arctic ocean goes up very rapidly.
Given the land/ocean balances alone, the northern pole should warm ~10% faster than the southern.
Regarding warm/cold water exchanges, as scaddenp recommended I suggest reading up on global thermohaline circulation.

While these overall effects may not be intuitive, they are very well established.
- Breathing contributes to CO2 buildup
Tom Curtis at 07:59 AM on 22 May, 2015Art Vandelay @51, there a couple of reasons to treat photosynthesis as the primary process (so that the CO2 is treated as initially coming from the atmosphere). First, historically that is what happened. Ie, before there were multicellular animals, there was photosynthesis, and indeed multicellular animals only became possible because of the existence of photosynthetic plants (or microbes) on which to feed. Second, food consumption can be treated as a flow of energy from low entropy to high entropy. As such the conversion from the lowest entropy energy supply generally available on Earth (sunlight) to the next lowest entropy source of energy generally available (sugars in plants) is the primary process. So, thermodynamically photosynthesis (and hence extraction of CO2 from the atmosphere) is primary.
However, these are not reasons directly related to the accounting of carbon flows. For that purpose we can take several approaches. The simplest approach, and the one in fact used by climate scientists, is to ignore churning. That is, to only take account of change of carbon in biomass reservoirs. If we account for carbon in that way, the human respiration is closely balanced by photosynthesis absorbing almost the same amount of Carbon. As this is just churning, it is ignored, and the only thing that is accounted for is the slight increase in carbon storage in humans due to increasing population and obesity.
Alternatively, you could consider human respiration as a relevant emission, but only if you consider all photosynthesis a relevant sequestration.
Looking at the IPCC graph I posted @42, we can either consider net land flux (=4.3 GtC per annum sequestered), or we can consider the two fluxes seperately, and say there are 118.7 GtC per annum emitted and 123 GtC per annum sequestered. It makes no difference in the end. What you cannot do is consider treat the total respiration as emissions, but consider only excess photosynthesis as sequestration, which is what the denier argument rebutted above tries to do. That is similar to their similar dishonesty in suggesting anthropogenic emissions are very small because they are only 4.3% of total emissions because they are only 4.3% of total CO2 flux into the atmosphere while ignoring that the natural components of that flux are almost exactly balanced by natural fluxes from the atmosphere so that the net increase is entirely due to anthropogenic emissions.
These figures are for the entire terrestial biosphere, but the same point applies to human respiration and the photsynthesis of the carbon content of human food. Further, because that photosynthesis is a continuous process (as is the respiration), the two components almost exactly balance at any point of time, and certainly the time averaged processes do.
- Models are unreliable
Klapper at 02:27 AM on 16 May, 2015@Klapper 908:
In addition to the atmospheric component of global heat changes, I've worked up a graph showing the ice melt component. Arctic sea ice is from PIOMAS data, Greenland and Antarctica are from GRACE data and before that some "generic" estimates of ice mass loss for these 2 continental sheets. Antarctic ice melt is my own model based on average thickness and the delta in ice area. Crude but as you can see, either way ice melt is not a big component of the global heat flux equation.

Compare this with Hansen et al 2011 Figure 12. Ice melt is a very small contribution to the global TOA energy imbalance and recent increases in ice sheet melt are to a degree cancelled out by recent increases in global sea ice. Note I am using the same method as Hansen, a rolling 6 year trend to calculate ice mass changes, and thereby heat fluxs on a global TOA basis.
More than 100 comments found. Only the most recent 100 have been displayed.

More than 100 comments found. Only the most recent 100 have been displayed.


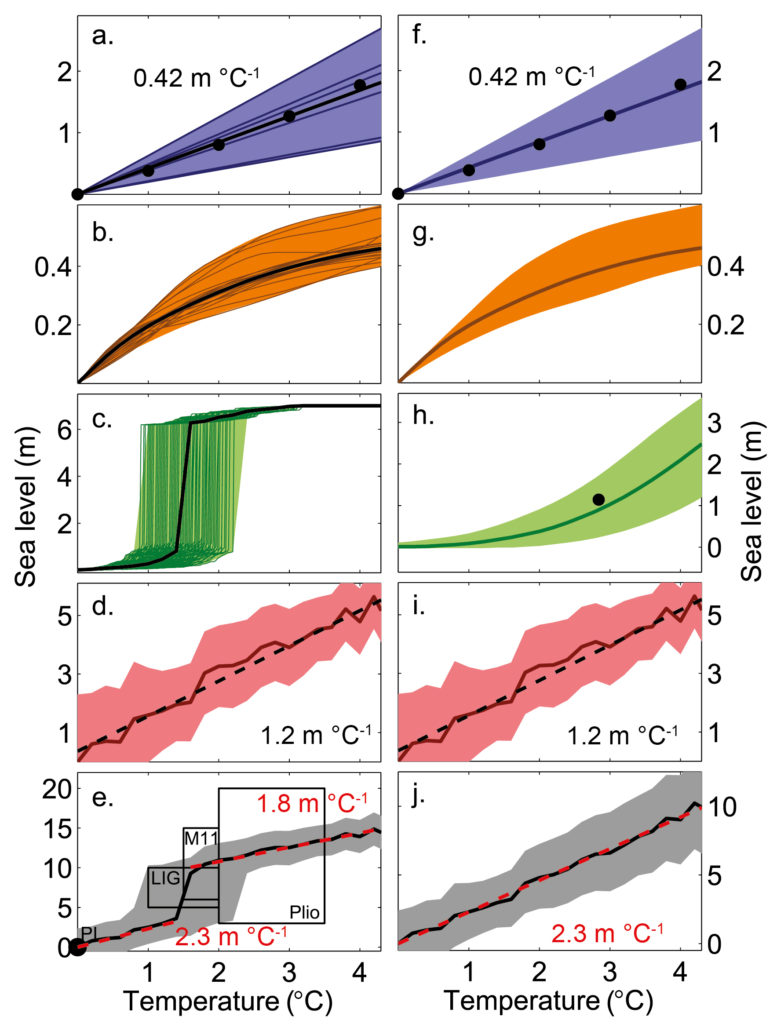
THE ESCALATOR

(free to republish)