


 Arguments
Software
Resources
Comments
The Consensus Project
Translations
About
Support
Arguments
Software
Resources
Comments
The Consensus Project
Translations
About
Support
![]()
![]()
![]()
![]()
![]()
![]()
![]()
![]()
![]()
![]()


![]()


Latest Posts
- EGU2024 - An intense week of joining sessions virtually
- Skeptical Science New Research for Week #16 2024
- How extreme was the Earth's temperature in 2023
- At a glance - Is the science settled?
- What is Mexico doing about climate change?
- 2024 SkS Weekly Climate Change & Global Warming News Roundup #15
- Fact Brief - Did global warming stop in 1998?
- Skeptical Science New Research for Week #15 2024
- EGU2024 - Picking and chosing sessions to attend virtually
- At a glance - The Pacific Decadal Oscillation (PDO) is not causing global warming
- Climate Adam: Is Global Warming Speeding Up?
- 2024 SkS Weekly Climate Change & Global Warming News Roundup #14
- Gigafact and Skeptical Science collaborate to create fact briefs
- Skeptical Science New Research for Week #14 2024
- How can I make my retirement plan climate-friendly?
- At a glance - Global warming and the El Niño Southern Oscillation
- A data scientist’s case for ‘cautious optimism’ about climate change
- 2024 SkS Weekly Climate Change & Global Warming News Roundup #13
- Skeptical Science New Research for Week #13 2024
- You can start applying for the American Climate Corps next month
- At a glance - Human fingerprints on climate change rule out natural cycles
- Want clean electricity? These are the overlooked elected officials who get to decide.
- 2024 SkS Weekly Climate Change & Global Warming News Roundup #12
- Climate - the Movie: a hot mess of (c)old myths!
- Skeptical Science New Research for Week #12 2024
- Climate Adam: Could the Amazon Rainforest Collapse?
- At a glance - Does CO2 always correlate with temperature?
- The U.S. has never produced more energy than it does today
- 2024 SkS Weekly Climate Change & Global Warming News Roundup #11
- Skeptical Science New Research for Week #11 2024
Comment Search Results
Search for it's the ocean
Comments matching the search it's the ocean:
- Welcome to Skeptical Science
Bob Loblaw at 11:22 AM on 4 April, 2024Cookclimate @ 118:
Your paper link seems to be broken.
Google Scholar finds multiple links to papers by you with that title, but it's hard to tell if they are all the same paper. Most links seem to be pre-prints, not actual peer-reviewed publications. One of them states that it was submitted to Earth and Space Science in 2020. Another seems to indicate that it was published in late 2023, in Journal of Marine Science Research and Oceanography, which is a title published by Opast. That journal's web page seems to use a DOI: 10.33140/JMSRO prefix, but searching for "Eugene Cook" fails to find the paper.
Opast is listed on Beall's List as a predatory publisher. As such, it appears to have little or no proper review. Can you tell us anything about the efforts you have made to publish your work, and what any reviewers have told you (if there have been any)?
So, by all appearances, you have pointed us to a "paper" that has not been peer reviewed. Perhaps between 2020 and 2023 you had the paper rejected by other journals? And finally managed to "publish" it in a pay-to-play journal?
Anyway, your 1470-year cycle looks awfully close to previous efforts that have identified 1500-year cycles. Skeptical Science has a page that covers this:
https://skepticalscience.com/1500-year-natural-cycle.htm
I'd hate to waste time looking at a pre-print that may have been changed before publication, so if you can properly point us to the correct copy of the paper, that would help.
...and please post anything else on the correct page, linked above. And read that post, and give us some reason why you think that your magical 1470-year cycle is any different from the many other cycles that people have failed with.
Eclectic is most likely correct: your analysis probably has some serious errors.
- Climate - the Movie: a hot mess of (c)old myths!
Eclectic at 05:09 AM on 4 April, 2024Gentlemen ~ "Climate The Movie" is currently being featured and featured "bigly" , at the WattsUpWithThat [WUWT] blogsite. WUWT has the topic "pinned" for consideration and comments. Comments are currently numbering 422. Yes, 422.
However, please do not waste your time by seeking through the 422 for any sign of perceptive & intelligent comments. I assure you that I have skimmed the 400-ish . . . and it's merely the typical WUWT "usual suspects" who are angrily venting into the WUWT echochamber.
Jimsteele , it sounds like you are completely unfamiliar with the WUWT website. It is full (well ~ at the 95% level) of commenters who deny the greenhouse effect ~ either directly or indirectly. Yes, I view the website to "educate" myself . . . mostly about the follies of Motivated Reasoning which are on display there daily. WUWT manages to be both interesting and tiresome. But the cynical reader will see some amusing comments there ~ of egregious fatuities & unintended ironies.
Jimsteele @91 ~ please go back and carefully re-read my comment @84. No, I did not state or allege that you "denied the greenhouse effect". But among your convoluted statements on ocean warming/cooling, you both allege and imply that CO2 contributes little or nothing to the (presently unfrozen) temperature of the Earth's ocean. Do you see the irony/incongruity of your position ?
- Climate - the Movie: a hot mess of (c)old myths!
nigelj at 05:38 AM on 3 April, 2024Two Dog @65. All that additional heat energy accumulating in the oceans has to come from somewhere. Possible candidates are anthropogenic warming, increased solar activity, and an increase in sub sea geothermal or volcanic activity.
Scientists have ruled out solar forcing and geothermal or volcanic activity. It's really hard for me to see where else that quantitiy of energy could come from if not those three possibilities. Just waving your hands and saying there may be something else isnt remotely convincing to me. Its just so implausible and such a vanishingly small possibility and so unlikely.
- Climate - the Movie: a hot mess of (c)old myths!
John Mason at 09:42 AM on 29 March, 2024Re - post #36:
The second questions's rhetorical and since I neither own nor moderate Skeptical Science it's irrelevant to me.
Thr first question is more interesting. On a geological time-scale, the answer is no.
Earth has continually rearranged itself through slow processes such as plate tectonics that operate over tens of millions of years. Since landmasses and oceans move around during such goings-on, climate is bound to be affected, but the fossil record indicates no big problems because of the time factor. Stuff could adapt.
However, rapid change is and has been dangerous.
Past instances of rapid change fall into two camps with a spectrum in between. We have bolide impacts (instant major change) at one end and Large Igneous Provinces (thousands to tens of thousands of years of major change) at the other.
Large igneous province events only occur every few tens of millions of years. Humans have never seen one. It's volcanism on another level.
The trouble with such rapid events is they are associated with mass-extinction with rapid climatic changes having a big role. The geological record preserves clear evidence for such things.
What we've done with carbon since pre-industrial times is directly comparable to a Large igneous province in terms of pollution created and dispersed around the globe. This current climate change may not feel fast - you may not see remarkable events on a daily basis - but geologically speaking it is going along at breakneck speed. I guess I could now ask a question back:
Just HOW bad do you want things to become before you take notice? - It's a natural cycle
John Mason at 02:11 AM on 22 March, 2024Re - #38: if you look at heat content graphs with uncertainty range included, it's possible that even more heat went into the oceans this past few years than we thought. For example:
Could it be that being well on the high side of the central estimate is sufficient??
- John F. Clauser: the latest climate science-denying physicist
Rob Honeycutt at 06:32 AM on 28 October, 2023TWFA... "It's not that I don't care about surface temperature, I care about whether the models for surface temperature have been applied to predicting temperatures above and below, a perfectly logical query."
Yes, this is a perfectly reasonable and logical query. So, pause right there before you move forward with any assumptions.
The answer to the best of my understanding:
Yes, climate models are applied to the surface and up through the various layers of the atmosphere. Once you get above the surface you run into challenges with measuring those various layers. The surface has the advantage of extensive direct data, above that you have to rely on either balloon data (which is sparse) or satellite data (which is an indirect measure of temperature and actually poorly measures some layers, like the mid-troposphere).
For deep ocean models, I'm unsure. But I would imagine those would have little affect on shorter time scales and is more important measure as a longer term reservoir for accumulating heat energy.
For sea surface or near surface modeling, there is a lot of coupling between the ocean and atmosphere, thus those are going to be inherent to climate models.
The other important point to understand about climate modeling is that they are, as mentioned earlier, "boundary conditions" modeling.
You can think of "initial conditions" modeling like the hurricane storm tracks you see on the news. We know where the model is and the models project the likelihood of where it will track over the following days.
Climate models are different. What they're doing is running model ensembles. Essentially, they're doing longer term weather/climate runs, over and over, in order to see what the mean state is. As they say, "All models are wrong, but they are skillful." We're not asking models to tell us whether this year will be warmer or cooler than the last. We know that's inherently noisy. We're asking climate models to tell us, over time, how much warming we can expect to see.
Understand that? They're wrong because one model run will say next year is warmer and another will say it's cooler. But they are "skillful" because they can tell us, with a high degree of confidence, the longer term trend for the climate system.
- John F. Clauser: the latest climate science-denying physicist
TWFA at 06:09 AM on 28 October, 2023It's not that I don't care about surface temperature, I care about whether the models for surface temperature have been applied to predicting temperatures above and below, a perfectly logical query.
If we have a model that can replicate historical data there is a good chance it can predict as well, but if the models have only been devloped using surface data, adjusted to match history, then you should be able to take the exact same model and run it to replicate historical and predicted data for temperatures aloft or level of thermocline below.
Sure the values and rate of response will be different, but the trends should not, and that is what I am looking to see. As you know, any temperature observtions at flight levels would be at pressure altitude and need to be corrected to true altitude. There are decades of oceanic route position reports, I seem to recall it was typically four or five on the North Atlantic tracks, probably there are double that on the Pacific, don't know if that data is in a silo somewhere or integrated into other, but it is historical and of interest to me.
At one site on "the other side" they showed data that indicated temperatures aloft at 200 hPA have NOT been increasing above 1.7 per century but the models predicted 4-4.5, so of course ALL the models are crap.
When I explained to them I would not expect them to if the readings were at pressure altitudes because I know from experience that unless there is a significant diversion from the standard lapse rate, weather, they will not... even if all the forests on earth were afire, at a 200 hPA pressure altitude of about 40,000' I would expect virtually no variation, and at 5,000' without including the world inferno lots of noise in the signal and would want to look deeper at such a data set to make sure it was as closer to standard atmosphere conditions as possible and corrected to AGL.
As you can imagine, I got the same kind of crap there, what does it matter, I don't have a clue, all the studies studying all the models of the other studies show them all to be wrong, etc., etc. Nobody is right all the time, but nobody is wrong all the time either, even if they turn out to be right for the wrong reasons.
So, my search will go on, if there is anybody else here who understands what I am looking for and has something to offer other than, "Get a PhD in climate studies, otherwise believe what we say" I would love to hear from you.
- John F. Clauser: the latest climate science-denying physicist
TWFA at 01:28 AM on 28 October, 2023Rob, with the PIREPs it was not bizarre at all, I was meaning for historical oceanic data that predates the modern technology, in my day position reports on HF always included wind and temperature. Attack, attack, attack... it's amazing.
Anyway, you keep repeating the same thing, "You obviously are a numb-nuts who hasn't read anything, there are tons of studies and everybody is in agreement, get lost".
I know how to read, have been reading clinical and technical papers all my life, I don't want to screen abstracts or read tons of studies, I am just looking for a few that have run the models against some mid tropospheric level data set, or deep ocean temperatures, or anything other than surface temperatures. You claim to be the expert, presumably you have read all the studies so you should be able to know right where to look, perhaps cite from memory. I am not the expert, but that does not make me a potted plant.
I am not here to argue, nor am I here to cheer or circle-jerk, I came here hoping to learn, there are plenty of advocacy sites on both sides, lots of noise, I was hoping this was not one of them.
There are two areas where I need more information, one is the whole cloud reflectivity and convective energy transfer process, and the other is whether the models we are relying upon work with data sets other than surface temperature, you can't have surface temperatures going up but everything else remaining the same and claim "the planet" is getting warmer.
I have children and grandchildren who look to me for advice because they know I am an independent thinker who has done pretty damn well so far thinking independently, I am looking for information, not confirmation, if this site is just another cheering section I will be happy to move on, nothing new to learn here.
- John F. Clauser: the latest climate science-denying physicist
TWFA at 02:47 AM on 27 October, 2023I seem to recall that Bill Gates and Steve Jobs did not have any peer reviewed papers on computer science when as teenagers they charted the future of computing and communications and folks invested millions into their unproved, non peer reviewed theories.
I think it is healthy to get outside observation and critique from folks with good minds that may not be "set". One does not have to be a specialist or have studied the field all his life to ask why if none of the current models can accurately reproduce what has happened over the last century why should we have faith in their predictions for the next?
And "faith" is what it is all about, because nobody can "prove" the future while in the present, but we can hopefully understand the present with results from the past... if we choose to pay attention to them, and that applies to far more than climate science.
When folks accuse others of being "deniers" it means they themselves must be "believers", neither can prove their case with facts, neither can prove something will or will not happen in the future until the future arrives, meaning until then we are talking about religion and not science. "Show me a video of God and I will believe" vs "How could all of this come to be without Him?" If 99% of alleged scientists agree on something either it is no longer science or they are not scientists, it is either religion or they are evangelists.
As a non-peer reviewed entrepreneur, renaissance man and pilot flying ABOVE clouds I have always marveled at the weather, the incredible energy conversion and transmission capacity of phase change and latent heat, for decades before Clauser came along I have been screaming about cloud reflectivity because I have seen it first hand... all that light beneath me is going back to space. 70% of the Earth's surface is water, from which clouds will form, temperature goes up, more clouds form, more reflection, less insolation.
It's not rocket science, or even computer science, put a pot of water on the stove, no matter how high the heat the water temperature never gets above boiling. If what Al Gore said at Davos this year were true, that the oceans are boiling, presumably not just where magma is erupting, it would have defied the laws of physics and thermodynamics, it would be impossible to capture and retain such heat with the 100% cloud cover we certainly would have.
- 2nd law of thermodynamics contradicts greenhouse theory
Likeitwarm at 04:18 AM on 30 September, 20231600. Rob Honeycutt et al
I'll wear that name proudly!
I'm just looking for the most plausible reasons for climate change.
I have found a number of theories. You will call them all quackery because they are not your theory.
I like Peter Ward's. Scroll down the page you sent me and read Peter's responses to his challengers. He makes a lot of sense. His challengers did not prove him wrong, only disagreed with him.
What I find wrong with your version of the science is that you say the small amount(less than 8% of all IR from the surface) re-radiated IR from a colder part of the atmosphere causes warming of the surface per Trenberth chart. That cannot happen. Your radiated photons from all emitting gases carry wave length and amplitude dependent on temperature emitted from. Not enough energy to heat the surface there. Per Ward 2015 colder IR is reflected by warmer object, not destroyed.
Magically, your chart shows the down welling radiation is greater, almost double, than what the sun supplies. Satellites see 255k for the temperature that is radiated from about 5-6 km altitude, not from the surface. The surface is warmer, not from the GHE, but from gravity doing work on the atmosphere causing adiabatic heating. This is why near surface temperatures are ~33c warmer than Planck equations predict. That makes sense unlike the GHE raising the temperature that much.
There is no experiment showing co2 warms the atmosphere.
There is no measurement showing human emissions of co2 cause the recent warming.
All you have is a correlation that doesn't prove anything.
The extra UV-B radiation reaching the surface warms the ocean and the warmer ocean emits more co2 per Ward 2015 makes sense and he does have a correlation with ozone levels and temperatures. Read his paper I linked to.
I know you like labels, but get the label right.
It's "CO2 causes climate change science denier" not "climate science denier". - Climate Confusion
Markp at 21:50 PM on 1 September, 2023Not sure how to respond to comments to my comment... There is no "reply" etc., featured in those comments, so I'll just say to Eclectic that I'm sorry you find my last paragraph unclear, and to Bob Loblaw and Rob Honeycutt: I'm clear on the difference between different types of "zero" CO2 scenarios, whether they imply constant concentrations or not. And Zeke's "explainer" is nice but is only a case in point: too many people simply assert that under a complete end to human emissions scenario, whereby natural uptake through oceans and trees continue drawing down CO2, heating will stop. Almost immediately. And they seem to base that belief purely on what has been modelled. And as everyone should know about models: garbage in, garbage out. The models don't reflect reality, though they try. Their inputs aren't complete, but merely partial. For example, ZECMIP is only CO2. The fact is, when we talk about hypothetically achieving no more human emissions, we're talking about a time in the future that is not tomorrow or next year or next decade, but at the very least, several decades, at least going by the extremely lazy response by humanity thus far. Correct? So by that time in the distant future, as emissions have continued, and tipping points have tipped, many things will have likely changed that our current thinking (or modeling) does not account for. So it is a bit silly to claim that temperatures will just stop IF/WHEN/? we ever manage to end human emissions, or "net" end them through the net zero concept. We place far too much reliance on models here, or rather I should say, those who are cheerleaders for net zero do.
So to Eclectic, I'm not proposing an alternative to reducing emissions. We need to reduce emissions. But that won't be enough. We also need to try the best form of SRM we can manage, which in my view is land-based mirrors, because the tech is here now, it's low tech, non-toxic, completely scalable, does not block sunlight from reaching our flora and fauna, and has an immediate effect on warming, unlike all the downstream GHG management methods.
- 2023 SkS Weekly Climate Change & Global Warming News Roundup #29
nigelj at 07:17 AM on 29 July, 2023wilddouglascounty
"When the severity and frequency of extreme weather increases, the sea level rises and gets more acidic, wildlife populations move and wildfires abound, it is not because of Climate Change. It's because fossil fuel use that has changed the atmospheric and oceanic chemistry, allowing it to store more heat, changing the climate. Everyone who watches the weather needs to be reminded of that, too."
I'm sympathetic to what WDS wrote and what OPOF says. One reason. Apparently the link between fossil fuels and climate change is not mentioned in the IPCC summary for policy makers (or rarely mentioned I just forget which), because the oil exporting companies lobbied vigorously to keep it out. And in hindsight I've noticed our news media doesn't explicilty mention the link very often.
The counter argument is that almost everyone on the planet must know by now that fossil fuels are the main cause of climate change in recent decades. You would have to live a very isolated existence not to have heard by now.
But I think the link should always be mentioned more often and when appropriate. ( I hear what BL is saying) Reinforing the facts is arguably a good idea and cannot be a bad idea.
- 2023 SkS Weekly Climate Change & Global Warming News Roundup #29
wilddouglascounty at 15:01 PM on 24 July, 2023The term "climate change" has buried the lead for too long, so it's time to correct this. When Sammy Sosa, Barry Bonds and Mark McGuire were not voted into the Baseball Hall of Fame, it was not because of Home Run Change, it was because of Performance Enhancing Drugs. And everyone who watches baseball knows that.
When the severity and frequency of extreme weather increases, the sea level rises and gets more acidic, wildlife populations move and wildfires abound, it is not because of Climate Change. It's because fossil fuel use that has changed the atmospheric and oceanic chemistry, allowing it to store more heat, changing the climate. Everyone who watches the weather needs to be reminded of that, too.
It's time to stop using euphemisms that don't explicitly connect the changing climate to fossil fuel use so that folks understand in the same way that folks understand the role of performance enhancing drugs in sports. Everyone needs to be reminded of the role fossil fuels has in climate change, just as they know about the role of performance enhancing drugs in turbocharging the natural talents of the users. Whenever discussing any of the things related to Climate Change we should make that link explicit by using phrases like:
- Fossil fuel induced Climate Change
- Increased greenhouse gases from Fossil Fuel use
- Climate Change caused by Fossil Fuel use
- Changed atmospheric chemistry through the widespread use of fossil fuels
and the like. And if someone says that you're politicizing the weather, tell them that this isn't just political; it's based on overwhelming scientific evidence. Refer them to the IPCC or skepticalscience websites if they are still deniers, and change the focus to how to become more energy efficient first, replace fossil fuel use with renewables second, and nurture local ecosystems third. We don't have a choice but to make things super-clear if we are to have a chance to turn the ship away from almost unimaginable disasters for future generations.
- How big is the “carbon fertilization effect”?
daveburton at 01:45 AM on 14 July, 2023Eclectic wrote, "Daveburton @22 ~ Please explain more of your first chart [ IPCC's decadal Carbon Flux Comparison 1980-2019 ]. The natural sink flux figures… show a rather steady proportionality to the total carbon emissions."
Glad to. Any two things which steadily increase are thereby correlated. There's only a possibility that the relationship might be causal if there's a possible mechanism for such causality.
There's no possible mechanism by which the rate at which CO2 emerges from chimneys could govern the rate at which CO2 is taken up by trees & absorbed by the oceans, or vice-versa, so the relationship cannot be causal — just as this famous relationship is not causal:

Eclectic wrote, "The land sink shows about 30-35% of total emissions, while the sum of land & ocean remains around 55-60%."
Yes, I usually say "about half," as in, "If our CO2 emissions were cut by more than about half then the atmospheric CO2 level would be falling, rather than rising."
It is important to recognize that the relationship is merely coincidental, not causal.
Eclectic wrote, "as the decades progress, the natural carbon sink flux in absolute terms rises with the rising emissions ~ but does not show a proportional increase."
The rate at which natural processes, such as ocean uptake, uptake by trees and soil ("greening"), and rock weathering, remove CO2 from the air, is affected in minor ways by many factors, but in a major way by only one: the current amount of CO2 in the air.
Our CO2 emission rate does not and cannot affect the natural removal rate, except indirectly, in the long term, by being one of the most important factors which affect the amount of CO2 in the air.
Eclectic wrote, "looking back in time ~ as the atmospheric CO2 level decreases, the size of the natural sink flux decreases also."
That is correct. It will also be correct looking forward in time, when CO2 levels are falling, someday.
Eclectic wrote, "this directly contradicts your hypothesis of 'if emissions were halved ... atmospheric CO2 level would plateau.'"
If you'll allow me to use "halved" as a shorthand for "reduced to the point at which emissions merely equal current natural removals, rather than exceed them," then those two statements are both correct, and perfectly consistent. It's pCO2 (level), not the rate of CO2 emissions, which (mostly) governs the rates of all the natural CO2 removal from the atmosphere.
Of course there are also minor factors which affect the removal rates. For instance, as we've already discussed, a 1°C rise in water temperature slows ocean uptake of CO2 by roughly 3%. Conversely, a rise in air temperature accelerates CO2 removal by rock weathering. (Sorry, I don't have a quantification of that.) But the main factor which controls the rate of CO2 removals is pCO2.
Eclectic wrote, "While the nutritive components of some food crops may reduce slightly as CO2 rises…"
Oh boy, another rabbit hole! That's the Loladze/Myers "nutrition scare."
It is of little consequence. That should be obvious if you consider that crops grown in commercial greenhouses with CO2 levels as high as 1500 ppmv are as nutritious as crops grown outdoors with only 30% as much CO2.

≥1500 ppmv CO2 is optimal for most crops. That's why commercial greenhouses typically use CO2 generators to raise daytime CO2 concentration to well above 1000 ppmv. It is expensive, but they go to that expense because elevated CO2 (eCO2) makes crops much healthier and more productive. (They don't typically supplement CO2 at night unless using grow-lamps, because plants can't use the extra CO2 without light.)
If elevating CO2 by >1000 ppmv doesn't cause crops to be less nutritious, then elevating CO2 by only 140 ppmv obviously doesn't, either.
Better crops yields, due to eCO2 or any other reason, can cause lower levels (but not lower total amounts) of nutrients which are in short supply in the soil. But that doesn't happen to a significant extent when agricultural best practices are employed.
I had an impromptu online debate about the nutrition scare with its most prominent promoter, mathematician Irakli Loladze, in the comments on a Quora answer. If you're not a Quora member you can't read it there, so I saved a copy here. He acknowledged to me that food grown in greenhouses at elevated CO2 levels is as nutritious as food grown outdoors.
Faster-growing, more productive crops require more nutrients per acre, but not more nutrients per unit of production.
Inadequate nitrogen fertilization reduces protein production relative to carbohydrate production, because proteins contain nitrogen, but carbohydrates don't. Likewise, low levels of iron or zinc in soils cause lower levels of those minerals in some crops. So, it is possible, by flouting well-established best agricultural practices, to contrive circumstances under which eCO2, or anything else which improves crop yields, causes reduced levels of protein or micronutrients in crops.
But farmers know that the more productive crops are, the more nutrients they need, per acre. Competent farmers fertilize accordingly.
Or, for nitrogen, they may plant nitrogen-fixing legumes — which benefit greatly from extra CO2.
If you don’t fertilize according to the needs of your crops, negative consequences may include reductions in protein and/or micronutrient levels in the resulting crops. The cause of such reductions isn't eCO2s, it's poor agricultural practices.
The nutrient scare is an attempt to put a negative "spin" on the most important benefit of eCO2: that it improves crop yields.
Eclectic wrote, "it is (as you state) beyond argument that higher CO2 benefits overall crop yield & plant mass."
That's correct. Moreover, agronomy studies show that for most crops the effect is highly linear as CO2 levels rise, until above about 1000 ppmv (which is far higher than we could ever hope to drive outdoor CO2 levels by burning fossil fuels). That linearity is obvious in the green (C3) trace, here:

That improvement is one of several major reasons that catastropic famines are fading from living memory.
If you're too young to remember huge, catastrophic famines, count yourself blessed. Through all of human history, until very recently, famine was one of the great scourges of mankind, the "Third Horseman of the Apocalypse." But no more. This is a miracle!
https://ourworldindata.org/famines

Ending famine is a VERY Big Deal, comparable to ending war and disease. Compare:
● Covid-19 killed 0.1% of world population.
● 1918 flu pandemic killed about 2%.
● WWII killed 2.7%.
● The near-global drought and famine of 1876-78 killed about 3.7% of the world population.
Eclectic wrote, "other CO2/AGW concomitant effects of increased droughts /floods /heat-waves can be harmful to crop yields in open-field agriculture. [And especially so for the staple crop of maize.]"
Well, let's examine those one at a time.
Heat-waves. Overall, temperature extremes are not worsened by the warming trend. Heat waves are slightly worsened, but by less than cold snaps are mitigated. That's because, thanks to "Arctic amplification," warming is disproportionately at chilly high latitudes, and it is greatest at night and in winter. The tropics warm less, which is nice, because they're warm enough already.
1°C is about the temperature change you get from a 500 foot elevation change. (That's calculated from an average lapse rate of 6.5 °C/km.)
On average, 1°C is similar in effect to a latitude change of about sixty miles, as you can see by looking at an agricultural growing zone map. Here's one, from the Arbor Day Foundation:

From eyeballing the map, you can see that 1°C (1.8°F) = about 50-70 miles latitude change.
James Hansen and his colleagues reported a similar figure: "A warming of 0.5°C... implies typically a poleward shift of isotherms by 50 to 75 km..."
1°C is less than the hysteresis ("dead zone") in your home thermostat, which is the amount that your indoor temperatures go up and down, all day long, without you even noticing.
In the American Midwest, farmers can fully compensate for 1°C of climate change by adjusting planting dates by about six days.

Floods. Theoretically, by accelerating the water cycle, climate change could increase the frequency or severity of floods. But the effect is too slight to be noticeable. AR6 says no change in global flood frequency is detectable:

Droughts. Droughts have not worsened. In fact, the global drought trend is slightly down. Here's a study:
Hao et al. (2014). Global integrated drought monitoring and prediction system. Sci Data 1(140001). doi:10.1038/sdata.2014.1

Here's the U.S. drought trend (the bottom/orange side of the graph):
https://www.ncei.noaa.gov/access/monitoring/uspa/wet-dry/0

Not only does climate change not worsen droughts, it has long been settled science that eCO2 improves plants' water use efficiency (WUE) and drought resilience, by improving CO2 stomatal conductance relative to transpiration. So eCO2 is especially beneficial in arid regions, and for crops which are under drought stress.
Maize (corn) has been very heavily studied. Even though it is a C4 grass, it benefits greatly from elevated CO2, especially under drought stress. Here's a study (one of many):
Chun et al. (2011). Effect of elevated carbon dioxide and water stress on gas exchange and water use efficiency in corn. Agric For Meteorol 151(3), pp 378-384, ISSN 0168-1923. doi:10.1016/j.agrformet.2010.11.015.
EXCERPT:
"There have been many studies on the interaction of CO2 and water on plant growth. Under elevated CO2, less water is used to produce each unit of dry matter by reducing stomatal conductance."
Here's a similar study about wheat:
Fitzgerald GJ, et al. (2016) Elevated atmospheric [CO2] can dramatically increase wheat yields in semi-arid environments and buffer against heat waves. Glob Chang Biol. 22(6):2269-84. doi:10.1111/gcb.13263.
However, I agree with you that putting a monetary value on the benefits of CO2 for crops is difficult. In part that's because the price of food soars when it's in short supply, and plummets when it's plentiful. So, for example, if we were to attribute, say, 15% of current crop yields to CO2 fertilization & CO2 drought mitigation, and value that 15% using current crop prices, we would be underestimating the true value, because absent that 15% boost the prices would have been much higher.
- How big is the “carbon fertilization effect”?
daveburton at 15:36 PM on 13 July, 2023Rob wrote elsewhere, "greening is now turning into 'browning.' ... fertilization [has now been] overwhelmed by other effects... In other words, the greening has now stopped," and here, "You were making the claim that natural sinks were removing more of our emissions, and that is not the case by any stretch of the imagination.""
Here's AR6 WG1 Table 5.1, which shows how natural CO2 removals are accelerating:
https://www.ipcc.ch/report/ar6/wg1/downloads/report/IPCC_AR6_WGI_Chapter_05.pdf#page=48
Here it is with the relevant bits highlighted:
https://sealevel.info/AR6_WG1_Table_5.1.png
Or, more concisely:
https://sealevel.info/AR6_WG1_Table_5.1_annot1_partial_carbon_flux_comparison_760x398.png
: 2.0 ⇒ 2.6 ⇒ 2.9 ⇒ 3.4 PgC/yr")
(Note: 1 PgC = 0.46962 ppmv = 3.66419 Gt CO2.)
As you can see, as atmospheric CO2 levels have risen, the natural CO2 removal rate has sharply accelerated. (That's a strong negative/stabilizing climate feedback.)
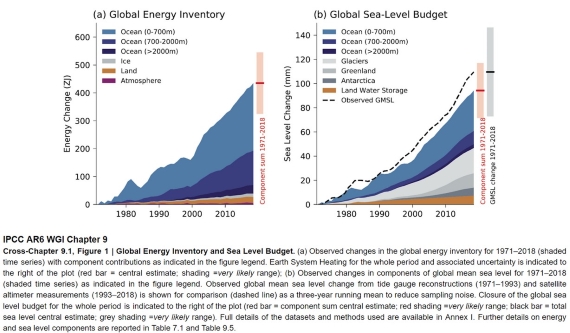
AR6 FAQ 5.1 also shows how both terrestrial and marine carbon sinks have accelerated, here:
https://www.ipcc.ch/report/ar6/wg1/downloads/report/IPCC_AR6_WGI_Chapter05.pdf#page=99
Here's the key graph; I added the orange box, to highlight the (small) portion of the graph which supports your contention that, "greening is now turning into 'browning.' ... fertilization [has now been] overwhelmed by other effects... In other words, the greening has now stopped."
https://sealevel.info/AR6_FAQ_5p1_Fig_1b_final2.png
Here's the caption, explicitly saying that natural removal of carbon from the atmosphere is NOT weakening:

The authors did PREDICT a "decline" in the FUTURE, "if" emissions "continue to increase." But it hasn't happened yet.
What's more, the "decline" which they predicted was NOT for the rate of natural CO2 removals by greening and marine sinks, anyhow. Rather, if you read it carefully, you'll see that that hypothetical decline was predicted for the ratio of natural removals to emissions.
What's more, their prediction is conditional, depending on what happens with future emissions ("if CO2 emissions continue to increase").
Well, predictions are cheap. My prediction is that natural removals of CO2 from the atmosphere will continue to accelerate, for as long as CO2 levels rise.
The "fraction" which they predict might decline, someday, doesn't represent anything physical, anyhow. (It is one minus the equally unphysical "airborne fraction.") Our emission rate is currently about twice the natural removal rate, so if emissions were halved, the removal "fraction" would be 100%, and the atmospheric CO2 level would plateau. If emissions were cut by more than half then the removal "fraction" would be more than 100%, and the CO2 level would be falling.
I wrote elsewhere, "This recent study quantifies the effect for several major crops. Their results are toward the high end, but their qualitative conclusion is consistent with many, many other studies. They reported, "We consistently find a large CO2 fertilization effect: a 1 ppm increase in CO2 equates to a 0.4%, 0.6%, 1% yield increase for corn, soybeans, and wheat, respectively.""
If you recall that mankind has raised the average atmospheric CO2 level by 140 ppmv, you'll recognize that those crop yield improvements are enormous!
Rob replied, "If you actually read more than just the abstract of that study you find this on page 3: 'Complicating matters further, a decline in the global carbon fertilization effect over time has been documented, likely attributable to changes in nutrient and water availability (Wang et al. 2020).'"
Rob, I already addressed Wang et al (2020), but you might not have seen it, because the mods deemed it off-topic and deleted it. Here's what I wrote:
Rob, it's possible that your confusion on the greening/browning point was due to a widely publicized paper, with an unfortunately misleading title:
Wang et al (2020), "Recent global decline of CO2 fertilization effects on vegetation photosynthesis." Science, 11 Dec 2020, Vol 370, Issue 6522, pp. 1295-1300, doi:10.1126/science.abb7772
Many people were misled by it. You can be forgiven for thinking, based on that title, that greening due to CO2 fertilization had peaked, and is now declining.
But that's not what it meant. What it actually meant was that the rate at which plants remove CO2 from the atmosphere has continued to accelerate, but that its recent acceleration was less than expected. (You can't glean that fact from the abstract; would you like me to email you a copy of the paper?)
What's more, if you read the "Comment on" papers responding to Wang, you'll learn that even that conclusion was dubious:
Sang et al (2021), "Comment on 'Recent global decline of CO2 fertilization effects on vegetation photosynthesis'." Science 373, eabg4420. doi:10.1126/science.abg4420
Frankenberg et al (2021), "Comment on 'Recent global decline of CO2 fertilization effects on vegetation photosynthesis'." Science 373, eabg2947. doi:10.1126/science.abg2947
Agronomists have studied every important crop, and they all benefit from elevated CO2, and experiments show that the benefits continue to increase as CO2 levels rise to far above what we could ever hope to reach outdoors. Perhaps surprisingly, even the most important C4 crops, corn (maize) and sugarcane, benefit dramatically from additional CO2. C3 plants (including most crops, and all carbon-sequestering trees) benefit even more.
Rob also quoted the study saying, "While CO2 enrichment experiments have generated important insights into the physiological channels of the fertilization effect and its environmental interactions, they are limited in the extent to which they reflect real-world growing conditions in commercial farms across a large geographic scale."
That's a reference to the well-known fact that Free Air Carbon Enrichment (FACE) studies are less accurate than greenhouse and OTC (open top container) studies, because in FACE studies wind fluctuations unavoidably cause unnaturally rapid variations in CO2 levels. So FACE studies consistently underestimate the benefits of elevated CO2. Here's a paper about that:
Bunce, J.A. (2012). Responses of cotton and wheat photosynthesis and growth to cyclic variation in carbon dioxide concentration. Photosynthetica 50, 395–400. doi:10.1007/s11099-012-0041-7
The issue is also explained by Prof. George Hendrey, here:
"Plant responses to CO2 enrichment: Much of what is known about global ecosystem responses to future increases in atmospheric CO2 has been gained through Free-Air CO2 Enrichment (FACE) experiments of my design. All FACE experiments exhibit rapid variations in CO2 concentrations on the order of seconds to minutes. I have shown that long-term photosynthesis can be reduced as a consequence of this variability. Because of this, all FACE experiments tend to underestimate ecosystem net primary production (NPP) associated with a presumed increased concentration of CO2."
Rob wrote, "It does seem that you're claiming CO2 uptake falls with increasing temperature.""
That is correct for uptake by water. Or, rather, it would be correct, were it not for the fact that the small reduction in CO2 uptake due to the temperature dependence of Henry's Law is dwarfed by the large increase in CO2 uptake due to the increase in pCO2.
Rob wrote, "But it's unclear to me how you think this plays into the conclusion that CO2 levels would 'quickly normalize' over the course of 35 years" and also, "You also claimed CO2 concentrations would quickly come down (normalize) once we stop emitting it. This is also not correct unless you're using 'normalize' to mean 'stabilize at a new higher level'."
Perhaps you've confused me with someone else. I said nothing about CO2 levels "normalizing."
I did point out that the effective half-life for additional CO2 which we add to the atmosphere is only about 35 years. I wrote:
The commonly heard claim that "the change in CO2 concentration will persist for centuries and millennia to come" is based on the "long tail" of a hypothetical CO2 concentration decay curve, for a scenario in which anthropogenic CO2 emissions go to zero, CO2 level drops toward 300 ppmv, and carbon begins slowly migrating back out of the deep oceans and terrestrial biosphere into the atmosphere. It's true in the sense that if CO2 emissions were to cease, it would be millennia before the CO2 level would drop below 300 ppmv. But the first half-life for the modeled CO2 level decay curve is only about 35 years, corresponding to an e-folding "adjustment time" of about fifty years. That's the "effective atmospheric lifetime" of our current CO2 emissions.
Rob wrote, "Dave... The fundamental fact that you disputed is that oceans take up about half of our emissions."
That reflects two points of confusion, Rob.
In the first place, our emissions are currently around 11 PgC/year (per the GCP). The oceans remove CO2 from the atmosphere at a current rate of a little over 2.5 PgC/year. That's only about 1/4 of the rate of our emissions, not half.
More fundamentally, the oceans are not removing some fixed fraction of our emissions. None of the natural CO2 removal processes do. All of them remove CO2 from the bulk atmosphere, at rates which largely depend on the atmospheric CO2 concentration, not on our emission rate. If we halved our CO2 emission rate, natural CO2 removals would continue at their current rate.
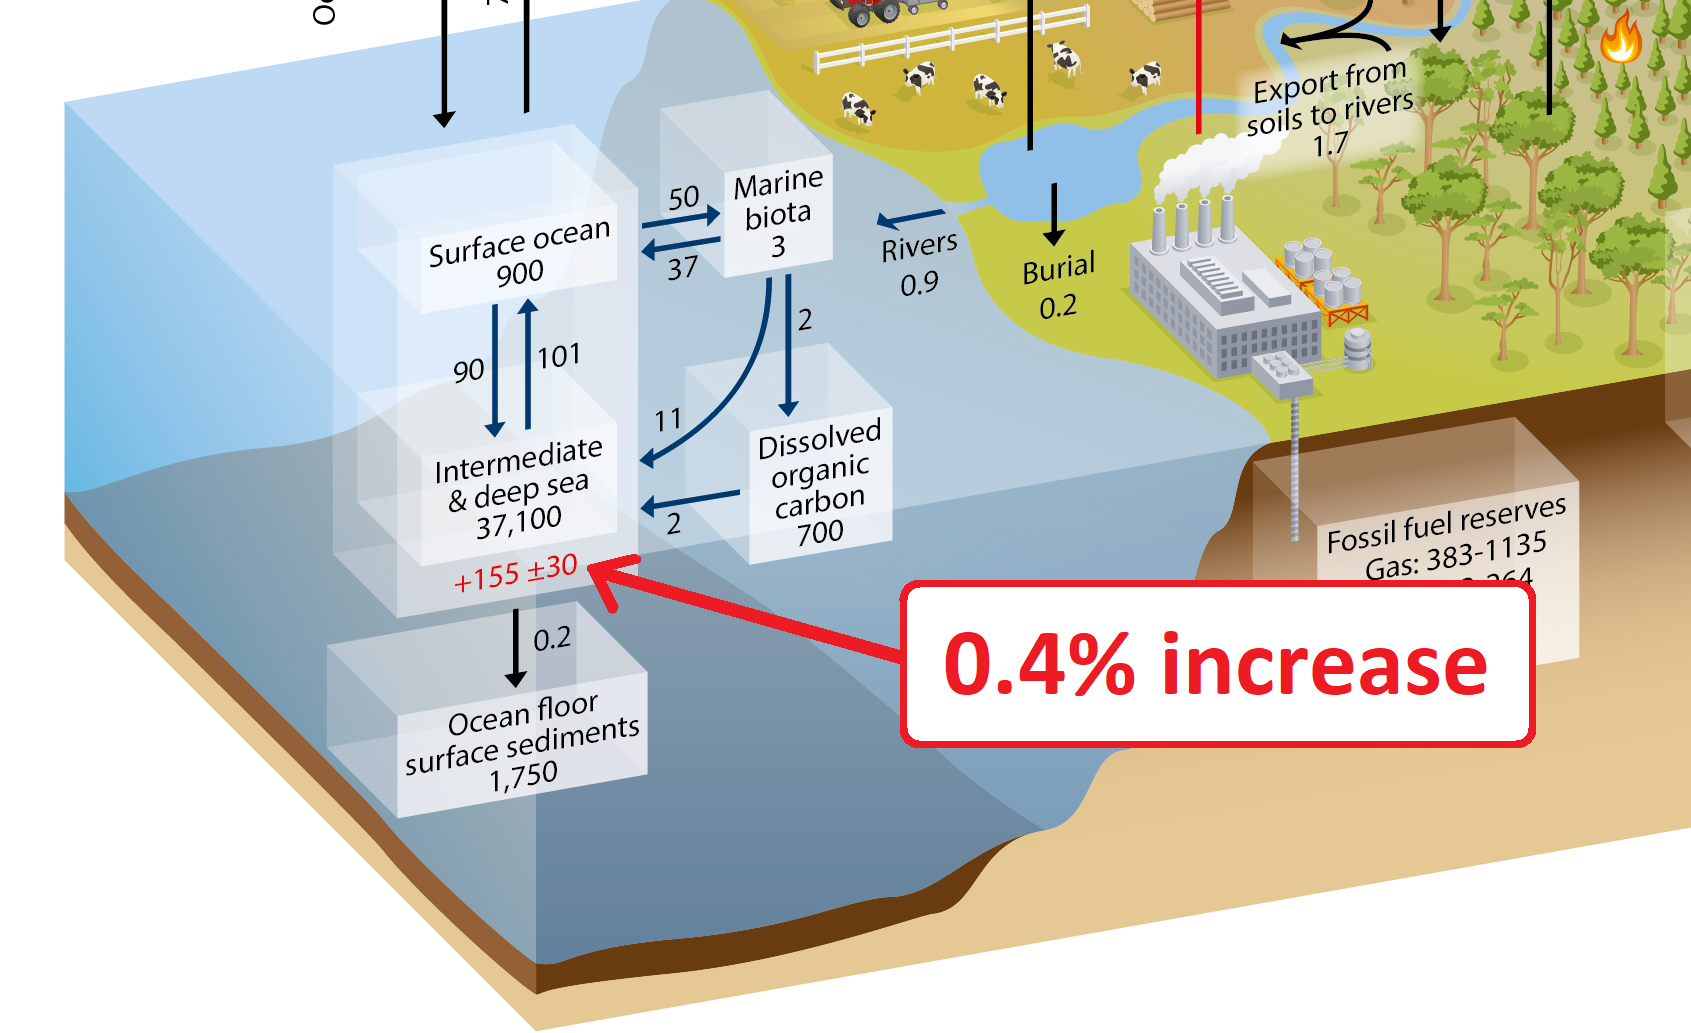
Because human CO2 emissions are currently faster than natural CO2 removals, we've increased the atmospheric CO2 level by about 50% (140 ppmv), but we've increased the amount of carbon in the oceans by less than 0.5%, as you can see in AR5 WG1 Fig. 6-1.
Sorry, this got kind of long. I hope I addressed all your concerns.
- How big is the “carbon fertilization effect”?
Rob Honeycutt at 11:23 AM on 13 July, 2023Dave... The fundamental fact that you disputed is that oceans take up about half of our emissions. It's a fact that has been clearly stated in the citations both of us have presented.
You also claimed CO2 concentrations would quickly come down (normalize) once we stop emitting it. This is also not correct unless you're using "normalize" to mean "stabilize at a new higher level". But they're not going to stabilize back to 300ppm.
- How big is the “carbon fertilization effect”?
Rob Honeycutt at 01:41 AM on 13 July, 2023Dave... Perhaps also think about what this chart represents. It's saying the solubility of CO2 falls as temperature increases. That means when temperature rises more CO2 remains in the atmosphere leading to more warming.
I believe this is the same effect that amplifies warming from orbital patterns to produce glacial-interglacial events.
If I'm correctly interpreting what you're claiming, it seems you're saying that warming oceans will take up more CO2, which would be inverse to the actual effect of CO2 solubility.
- Hansen predicted the West Side Highway would be underwater
daveburton at 21:53 PM on 12 July, 2023Bob Ludlow wrote
[Contents snipped]
"You have no objective criteria to declare that The Battery and Honolulu are "the best" at representing anything other than local effects..."
The Battery has 1825 months of sea-level measurements. No other NOAA Atlantic site has that much. Only San Francisco has more, but it has only 1404 months of measurements since the 1906 earthquake. The downside to The Battery's measurement record is its high (atypical) rate of subsidence, which roughly doubles the local ("relative") sea-level trend there.
There are some European sites with longer, better Atlantic / North Sea / Baltic measurement records, and Australia has an excellent Pacific measurement record, but there are substantial delays getting data for those locations. My sealevel.info stie pulls data from NOAA frequently, so it's much more up-to-date.
Some of the European sites, have recorded a slight acceleration; it was most noticeable at Brest, which saw a 0.0 mm/year trend in the19th century, but a 1.6 mm/year trend since then, though there are substantial gaps in ther record.
Several German sites have particularly excellent measurement records; here's one of them:

In the Pacific, Honolulu has 1421 months (>118 years) of continuous sea-level measurements, without even a single missing month. Just as importantly, Honolulu is a near-ideal measurement site, near the middle of the world's largest ocean, on an "old" island with near-zero vertical land motion, small tides, and (unlike most places!) almost no seasonal cycle. What's more, its mid-Pacific location is near the pivot point of the east-west Pacific "teeter-totter," so it is little affected by ENSO "slosh." That is, El Niño and La Niña don’t affect sea-level there much at all. It really is a superb dataset.
Bob continued, "Just because they have long records does not mean that they accurately reflect regional or global trends."
That's true. As I've mentioned, NYC's sea-level trend is atypical, because of the high rate of subsidence there.
However, if subsidence / uplift are due to very long term processes, like PGR, there's reason to hope that they are fairly consistent over the duration of the measurement record. In that case, even if the linear trend is greatly affected by uplift or subsidence, the acceleration won't be. (Of course, that doesn't work in places, like Manila, where changing local factors, like groundwater pumping, cause varying subsidence.)
So it should not surprise you that, even though The Battery and Honolulu have seen quite different linear trends over the last century, the measured acceleration in both places is very similar (negligible).
Bob wrote, "You are clearly picking locations to try to tell the story you want to tell."
That's a false accusation. You just find the data surprising, so you make baseless accusations, without evidence. That is not conducive to constructive dialogue, nor to learning.
If you think I chose unrepresentative sites, or sites with inferior quality measurement data, then YOU tell me what sites YOU think are better, and why.
Bob wrote, "As for your quadratic fits: it has been pointed out to you over the past 10 years that quadratic fits mean nothing when the underlying data does not resemble a quadratic relationship."
Nobody competent makes that claim in the context of sea-level analysis.
If there were a step-change in some climate system input, then you could look for a step-acceleration as a consequence. But there's been nothing like that. The radiative forcing trend from CO2 has been very gradual, and strikingly linear (just barely more than linear) for the last forty years. It's been quite gradual for much longer than that.
Quadratic regression is the cannonical way of detecting gradual acceleration. It's how Church & White did it, and how every competent sea-level analyst since then has done it. When Hogarth reported that, "sea level acceleration from extended tide gauge data converges on 0.01 mm/yr²," that's what he was talking about.
- How big is the “carbon fertilization effect”?
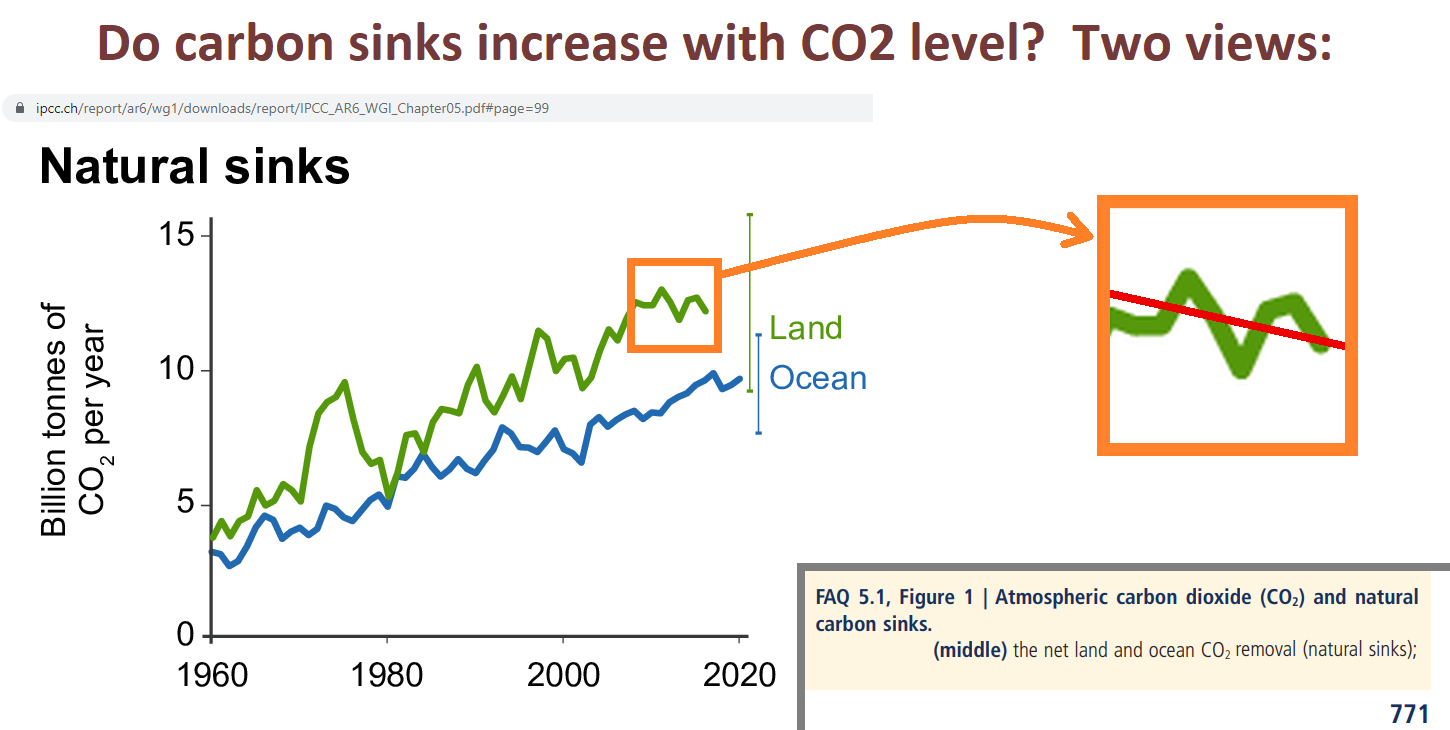
Rob Honeycutt at 11:17 AM on 11 July, 2023Dave... Your reference to the inset on FAQ 5.1 is comical at best.
It states exactly what I'm telling you, as did the other bits I posted.
FAQ 5.1: Is natural removal of carbon
from the atmosphere weakening?
No, natural carbon sinks have taken up a near constant fraction of our carbon dioxide (CO2) emissions over the last six decades.
You were making the claim that natural sinks were removing more of our emissions, and that is not the case by any stretch of the imagination. And the caption you posted goes on to say...
However, this fraction is expected to decline in the future if CO2 emissions continue to increase.
How can you not understand this? Take note that AR6, though it's the most current IPCC report, came out nearly two years ago, and the report is relying on data and research that was completed well before even that.
The most recent papers are saying that, yes, that CO2 fertilization effect is now waning.
Tropical Forests’ Carbon Sink Is Rapidly Weakening – Crucial for Stabilizing Earth’s Climate
Once again, in your own citation the language is clear.
FAQ 5.1 | Is the Natural Removal of Carbon From the Atmosphere Weakening?
For decades, about half of the carbon dioxide (CO2) that human activities have emitted to the atmosphere has been taken up by natural carbon sinks in vegetation, soils and oceans. These natural sinks of CO2 have thus roughly halved the rate at which atmospheric CO2 concentrations have increased, and therefore slowed down global warming. However, observations show that the processes underlying this uptake are beginning to respond to increasing CO2 in the atmosphere and climate change in a way that will weaken nature’s capacity to take up CO2 in the future. Understanding of the magnitude of this change is essential for projecting how the climate system will respond to future emissions and emissions reduction efforts.
The "observations show" means they are already seeing this happening, and that is based on research that's at least half a decade old.
- Hansen predicted the West Side Highway would be underwater
daveburton at 07:39 AM on 6 July, 2023Rob wrote, "that greening is now turning into 'browning.'"
Well, here's what AR6 shows:
Some people point to that little orange box and say that greening has ceased. That reminds me of the folks who say that the it's not as warm as the 2015-16 El Nino, so warming has ceased.
Philippe wrote, "There is probably a better thread for this argument,"
I agree. I was just trying to address OnePlanet's remark about a "locked in" CO2 level.
Philippe wrote, "There is only one factor that truly controls how green any region can be: water availability."
That's a common misconception. Elevated CO2 levels greatly improve plants' water use efficiency (WUE) and drought resilience. That's why elevated CO2 is especially beneficial for crops when under drought stress. It has been heavily studied by agronomists. Here's a paper about wheat:
Fitzgerald GJ, et al. (2016) Elevated atmospheric [CO2] can dramatically increase wheat yields in semi-arid environments and buffer against heat waves. Glob Chang Biol. 22(6):2269-84. doi:10.1111/gcb.13263.
Philippe wrote, "The experiences that have shown a CO2 fertilization effect were done in very controlled conditions and involved extremely high concentrations (800 ppm and up)."
That's incorrect. All major crops have been studied, and all benefit from elevated CO2. It is true that the greatest benefits accrue at 1000 ppmv or higher, but even modest CO2 increases significantly improve crop yields.
This recent study quantifies the effect for several major crops. Their results are toward the high end, but their qualitative conclusion is consistent with many, many other studies. They reported, "We consistently find a large CO2 fertilization effect: a 1 ppm increase in CO2 equates to a 0.4%, 0.6%, 1% yield increase for corn, soybeans, and wheat, respectively."
This study evaluated pine trees:
Idso, S., & Kimball, B. (1994). Effects of atmospheric CO2 enrichment on biomass accumulation and distribution in Eldarica pine trees. Journal of Experimental Botany, 45, 1669-1672.

As you noted, the effect is greatest with CO2 >800 ppmv, but, as you can see, even a much smaller CO2 increase has a substantial effect.
Rob wrote, "This entire paragraph is patently absurd and completely fabricated."
It is 100% factual, Rob. I'm surprised that you didn't already know it.
These figures are from that same AR6 Table 5.1 excerpt which I already showed you:
average CO2 removal rate in the 2010s = 2.7707 ppmv/yr
average CO2 removal rate in teh 2000s = 2.3481 ppmv/yr
These figures are from Mauna Loa:
average CO2 level in the 2010s = 399.91 ppmv
average CO2 level in the 2000s = 378.84 ppmv
(399.91-378.84) / (2.7707-2.3481) = 49.86
So a 50 ppmv increase in CO2 level accelerates the natural removal rate by about 1 ppmv/year.
49.86 / 2.1294 = 23.42 ppmv increase yields a +1 PgC removal rate increase.
I encourage you to do the calculations yourself for any other time period of your choice.
If you have the natural removal rate as a function of CO2 level (which we do), it is trivial to simulate the CO2 level decline if emissions were to suddenly cease. I wrote a little Perl program to do it; email me if you want a copy.
Rob wrote, "if true, the oceans would just continue to suck up all the atmospheric CO2 and we'd live on a frozen planet."
That's incorrect. The system progresses toward equilibrium, which is below 300 ppmv, but not zero.
Rob wrote, "rather that starting from a prior where all the published science is getting it wrong, and making stuff up... you don't have the requisite training to fully grasp the topic"
Rob, it's not necessary to resort to ad hominem attacks. I'm happy to document things that are surprising to you. You need but ask. Everything I've written is well-supported.
Rob wrote, "take some time to fully familiarize yourself with Henry's Law."
Due to the temperature dependence of Henry's Law, a 1°C increase in temperature slows CO2 uptake by the oceans by about 3%. But a 50% (140 ppmv) rise in atmospheric CO2 concentration accelerates CO2 uptake by the oceans by 50%. That's the main reason that ocean uptake of CO2 continues to accelerate.
- Hansen predicted the West Side Highway would be underwater
daveburton at 03:51 AM on 6 July, 2023Thanks for fixing those links, Rob. We were obviously typing simultaneously; you beat me to it by 7 minutes.
However, nothing I wrote was misleading. If you "follow the link to the actual IPCC page to read the full" table, you'll see that it shows exactly what I said it shows: as atmospheric CO2 levels have risen, the natural CO2 removal rate has sharply accelerated. (That's a strong negative/stabilizing climate feedback.)
The commonly heard claim that "the change in CO2 concentration will persist for centuries and millennia to come" is based on the "long tail" of a hypothetical CO2 concentration decay curve, for a scenario in which anthropogenic CO2 emissions go to zero, CO2 level drops toward 300 ppmv, and carbon begins slowly migrating back out of the deep oceans and terrestrial biosphere into the atmosphere. It's true in the sense that if CO2 emissions were to cease, it would be millenia before the CO2 level would drop below 300 ppmv. But the first half-life for the modeled CO2 level decay curve is only about 35 years, corresponding to an e-folding "adjustment time" of about fifty years. That's the "effective atmospheric lifetime" of our current CO2 emissions.
Moreover, it is not correct to say that "the ocean takes up about half of our emissions." Our emissions are currently around 11 PgC/year (per the GCP). The oceans remove CO2 from the atmosphere at a current rate of a little over 2.5 PgC/year, but they are not removing some fixed fraction of our emissions. If we halved our emission rate, natural CO2 removals would continue at their current rate.
Because human CO2 emissions are currently faster than natural CO2 removals, we've increased the atmospheric CO2 level by about 50% (140 ppmv), but we've increased the amount of carbon in the oceans by less than 0.5%, as you can see in AR5 WG1 Fig. 6-1. (It's not a problem for "sea dwelling creatures.")
In the oceans, biology generally trumps chemistry, and that is certainly true for CO2 uptake. Some people think that the capacity of the oceans to take up CO2 is limited to surface water by ocean stratification. But that's incorrect, beause the "biological carbon pump" rapidly moves CO2 from surface waters into the ocean depths, in the form of "marine snow."
The higher CO2 levels go, the faster that "pump" works. Here's a paper about it:
https://www.science.org/doi/reader/10.1126/science.aaa8026
Once carbon has migrated from the ocean surface to the depths, most of it remains sequestered for a very long time. Some of it settles on the ocean floor, but even dissolved carbon is sequestered for a long time. For instance, it is estimated that the AMOC takes about 1000 years to move carbon-rich water from high latitudes to the tropics, where it can reemerge. That is obviously far longer than the anthropogenic CO2 emission spike will last.
- Hansen predicted the West Side Highway would be underwater
Rob Honeycutt at 01:30 AM on 6 July, 2023Dave... So much is wrong in that post. Let's just start with atmospheric CO2 perturbation. No one claims it stays up there forever. But the change in CO2 concentration will persist for centuries and millennia to come.
https://climatehomes.unibe.ch/~joos/papers/joos97eps.pdf
Your sealevel.info snippet is misleading, and I assume you understand that virtually no one is going to follow the link to the actual IPCC page to read the full passage, because it will directly contradict what you're saying.
What you're looking at in those changes is a function of partial pressure. The ocean takes up about half of our emissions (lucky for those of us who live in the atmosphere, not so lucky for sea dwelling creatures). The increases you're demonstrating are merely a function of increased atmospheric concentrations. The oceans, in particular, are not going to continue to take up CO2 beyond what it's capable of doing due to partial pressure.
- At a glance - Ocean acidification: Global warming's evil twin
Rob Honeycutt at 14:23 PM on 5 July, 2023Gordon @15...
Liquid/frozen and acidic/alkaline are not analogous being that the former has a phase change at zero celcius. The later is merely a definition of a range in pH with no phase change.
Every time I've run into this entire argument (and it's been many times over) I always ask the other person to look at the scientific literature and see how the term "acidification" is used. I ask them to find any research that uses a different term.
Never has anyone taken up that task, and in the end I always do it for them.
The term is correct in its usage applied to ocean acidification. The term is consistent with other unrelated research. There are no other terms used that represent the same process. As Eclectic says, it is merely semantics to argue otherwise.
- EGU2023 - Highlights from the last week of April
John Mason at 22:00 PM on 28 April, 2023My take on Friday so far: Baerbel has already covered sessions where we were both present above.
I particularly enjoyed CL1.1.4: Deep-time climate change: insights from models and proxies. This session provided a wide-ranging series of palaeoclimate studies looking at various parts of and the whole Earth at key points in the past such as the Permo-Triassic transition, the K-T extinction and the early Cenozoic hyperthermals.
Some topics were more familiar than others, for example looking at the selective nature of the K-T extinction interval in the oceans: the post-impact 'winter' actually had a positive effect on e.g. siliceous diatom productivity whereas the Deccan Traps large Igneous Province was mostly negative in that instance. Calcareous planktom however suffered greatly. The most though-provoking presentation, "Resilience and implications of an Antarctic monsoon during the Eocene", was something I had not looked at before. It appeasrs there were local ice-sheets even then, but unlike today the continent's periphery supported dense forest.
It's refreshing to be with so many people to whom the key principles of climate forcings are no longer argued over but instead it's the increaingly minute details of past climates that are under investigation and being presented.
One word on presentations: it's a pity that presentation skills are not taught at final year undergraduate level. I've seen talks varying from absolutely outstanding to hard-to-follow this week. The cause of the difficulty variably includes talking at breakneck speed about highly complex topics, large blocks of text in slides too long to read for their display-time and using too small a font size to even screengrab effectively. Some, by no means all people need to learn how to communicate findings more clearly (the EGU Guidelines are quite specific in this respect) and in addition, every author had a Supplementary Material folder in which to upload a more detailed file. Attention to such points would have made an aleady enjoyable event even more so!
- The Big Picture
Bart Vreeken at 21:31 PM on 22 March, 2023N R N P @168
Shall I have a try in answering your questions? I live in The Netherlands and here we have the same kind of discussions. Excuse me in advance for my English, it seems to be horrible.
A. Changing for the worse?
I hope we do agree that the earth is warming. It's an on going process and we (science) expect that it will go on for a much longer time. So it gives a lot of changes in the climate almost everywhere.
A key point is that the continents and the oceans are warming in a different speed. The oceans are warming much slower. This has consequences. When the atmosphere warms up it can contain more water vapor. But the less warming ocean can't deliver enough water vapour to keep the more warming continents humid enough. As a result there is more risk for drought at many places.
An other thing is that the air whole circulation will change. It means that local climates can change more than the global average. Wet climates can turn to dry climates, but also the other way round. Our agriculture, infrastructure and houses are not (always) prepared for that.
As you know, a warmer climate makes the sea level rise. The warmer water in the ocean expands, the ice sheets and mountain glaciers are melting to a certain extent. This sea level rise will give a lot of problems in many coastal areas. Here in the Netherlands the protection against the sea is very well organized, we can manage the first one or one-and-a-halve meter in this century. When it gets more we have a problem, but we are already try to prepare for that. Other countries, including deltas in Asia and parts of the US are less protected and will have large problems before 2100. By the way, it's not only the sea level rise there. Many of these places have also subsidence of the land, but these two come together and the problems are coming much faster then without sea level rise.
And then there is the unpredictable part. We don't know exactly how the ice sheets will react. Maybe there are mechanisms for a quick decline of parts of the ice sheets. In that case we have less time to prepare for it.
Of course, there can also be places where the climate gets better, or at least in a part of the year. And at least, we will need less fuel for warming the houses. (but more electricity for cooling in the summer.)
An interesting point is the direct effect of the increasing CO2 level to the vegetation and the agriculture. Plants can grow faster with that. Remote sensing shows something like 'global greening'. But it's a mixture of natural response and increasing agriculture. The last thing is tricky when water recourses are limited. And as we have seen, the increasing risk for drought is a cause for concern by itself. Maybe you know the story of the Aral See?
Then your question B) changing because of human activities?
Yes, we can be sure about this. We could calculate the effect of increasing CO2 hundred years ago and it's just what happening. Other possible factors, like changing sun power don't have much effect, these changes are too small. The less known part is how the atmosphere reacts (water vapor, clouds), how the ocean circulation reacts, how ice sheets react in detail.
"C) why this time it is different than the changes that have taken place?"
The changes are going very fast now, and as I said, the houses, the infrastructure, the agriculture and the water supply are not prepared for these changes. And there is the risk for sudden, even faster changes (tipping points). - The Big Picture
Bart Vreeken at 03:50 AM on 20 March, 2023Rob Heneycutt, back to your original remark @74. There you say
"Hang on. Am I missing something or is Bart actually thinking that the gravitational mass of Greenland is going to pull sea level away from The Netherlands, when it's 3000km away, making their impacts of SLR nominal? Surely not."
Yes, I am actually thinking something like that. But it's a little different. At the moment the gravitational mass of the ice is attracting mass. 3000km is no problem, the influence goes much further. So, because of the ice mass the sea level here is higher then it should be without the ice. When the ice melts a part of this effect is gone, and because of that the sea level will drop here. On the other hand, there's the meltwater that distributes over the ocean. That aspect makes the sea level rise. The sum of these to is slightly positive.
And now you say:
"They're talking about fractions of a millimeter per year. So, at maximum, they're saying the effect around Greenland (deep blue) over the course of the next century would be on the scale of 5 cm, out of a potential of 1-2 meters of SLR."
Yes I do agree with most of that, so whats the point? The 2 m SLR is a bit to wild, KNMI talks about max 1.2 m in 2100.
- The Big Picture
Bart Vreeken at 19:48 PM on 18 March, 2023Thank you michael sweet @72 for the map of Greenland, based on altimetry. I didn't know this one, it's different from what I expected. I was too quick with my map of the SMB anomaly of only this year, it turns out to be untypical. Never the less we don't expect so much contribution from Greenland here. From the KNMI-report we discussed before:
"Many factors have been taken into account in the calculation of sea level rise on the Dutch coast, including the expansion of the oceans due to warming, self-gravitation, the changes in salinity, and the mass loss of glaciers and ice sheets in Greenland and Antarctica. Because the melting of the Greenland Ice Sheet hardly contributes to the sea level rise off the Dutch coast, we expect that the increase here will lag slightly behind the world average."
- The Big Picture
Rob Honeycutt at 00:54 AM on 18 March, 2023Peppers @36... Do you honestly need me to explain why you can't just take historical sea level rise data, run a straight line through it, and extrapolate sea level in 2100? This is basic enough that it might be a challenge to find citations. How about you make a guess and we'll see if you can work out why and perhaps, from that, we can help you understand why SLR projections show 1-2 meters for 2100.
I'll even get you started: Think about ice.
This is also wrong: "66M years ago we had the meteor strike, and the world went dark under dust for 3-4 years. Everything died, except the microorganizms around the rim of the oceans, around the world."
Though it is off-topic, it's a good demonstration of how you're simply making things up as you go along. In the Cretaceous–Paleogene extinction event about 75% of species went extinct. We are direct decendants of small mammals that survived the event.
Most of the rest of what you state there is also BS (for instance, much of the world's oil actually originates from the Cretaceous and Jurassic periods, not just the Tertiary period following the C-P event) but I'm not going to waste my time.
- The Big Picture
Bob Loblaw at 00:50 AM on 18 March, 2023Bart @ 38 responds to Rob @ 35 by saying "I don't make a mistake", and then proceeds to explain that he (Bart) has done exactly the mistake that Rob said he was doing: using historical data to extrapolate out SLR over the coming century. Bart even included the quote from Rob saying you can't do that, so Bart has no excuse for not paying attention to what Rob said.
Bart says he included "an extrapolation of the change by year" - but this is still using historical data to extrapolate. Mistake confirmed.
Anyone who is reasonably well-informed about sea level rise projections understands that such projections need to include physics and processes that will cause sea level rise - glacier dynamics and their response to temperature and precipitation changes; climate warming and associated changes in ocean temperatures (including horizontal and vertical distributions of temperature change). Projections require understanding the future path of these factors - and the past sea level is not necessarily an indicator of the future of glaciers and global temperatures.
RealClimate often covers this topic, and covers it well. A few related pages there:
dont-estimate-acceleration-by-fitting-a-quadratic
sea-level-in-the-ipcc-6th-assessment-report-ar6
why-is-future-sea-level-rise-still-so-uncertain
Another mistake made in Bart's short comment: the Netherlands doesn't need to worry about Greenland's contribution to sea level because it is "not very much here". (Granted, the last few sentences of Bart's comment are very poorly worded, so it's hard to understand exactly what point he is trying to make.)
- It's not urgent
MA Rodger at 00:37 AM on 9 March, 2023EddieEvans @13,
The net carbon sink into the oceans is far more predictable than the carbon interchange in/out of the biosphere. There is still some uncertainty and re-assessment (eg Watson et al 2020) in the matter but generally the only big variable is the ocean surface temperatures. So as long as we prevent massive SST rises, I would think it is safe to say "the global ocean will continue to act as a viable carbon sink." The actual size of that sink over the coming millennium will thus depend on how well we do preventing AGW but otherwise it's size is fairly predictable. What is far less predictable under AGW is the biosphere as a source/sink.
You also raise the threat of methane, this usually focusing on natural feedbacks and the melting permafrost. In the past I was rather worried by the poor coverage of this subject in the scientific literature but having dug into the subject I now feel more comfortable about it. Additionally the absence of significant methane fluxes resulting from the significant permafrost melt in recent decades is a reassuring sign.
- 2023 SkS Weekly Climate Change & Global Warming News Roundup #5
slumgullionridge at 23:44 PM on 8 February, 2023Rob Honeycutt @13 ...I should report that perhaps no one else on this site, save self, are suggesting a Draconian solution, but serious conversations are taking place across the globe around this topic. Jared Diamond and others have pointed out that civilizations have collapsed for not doing what they clearly knew needed doing to avoid catastrophe. Dithering is a human weakness well understood by the wise, but the wise are seldom in charge. Transitioning would be nice, it's "scientific", but is usually met by the resistance of the masses, who winch at the idea that something other than their Lord God will save them. Then, of course, there are always the Lordless whose motives rely on global conquest, who can't be bothered with climate mitigation when such a prize as the entire planet looms in their vision.
Already, the global ice is disappearing. That tipping point has been crossed. Transitioning will not remediate this loss because transitioning has already failed. We can't get back the species loss or speed up the AMOC, undo the acidification of the oceans which have already wiped out significant volumes of primary production, etc. So we need Draconian rather than Transitioning solutions in order to get out of trouble. Maybe someone can think up a few that are less Robespierre than mine.
- 2023 SkS Weekly Climate Change & Global Warming News Roundup #2
Rob Honeycutt at 02:05 AM on 18 January, 2023Eddie... Regarding the Hansen paper, note it's not a peer reviewed paper, yet. It's going to go through revisions prior to being published. Take this pre-review version with an appropriate quantity of salt (even from Hansen).
@5... No, I'm not ignoring ocean heat. What I stated is, once we stabilize CO2 concentrations warming will stop. Please read the Hausfather explainer I linked to.
- 2023 SkS Weekly Climate Change & Global Warming News Roundup #2
EddieEvans at 17:29 PM on 17 January, 2023At the risk of being dogmatic, your assessment seems to miss the warming ocean, which cannot be cooled in any foreseeable future. Nuclear weapons, population pressures, plague, and overall loss of sustainable habitat tell me we'll live up to our history, we'll kick the can down the road, and pass the buck to the next generation until there is no next generation. I'm pointing to what I'm reading, seeing, and hearing, and my personal experience. The question is not if, but when. Science cannot answer this question because it's a bit metaphysical. We have no crystal ball, only our history on thi planet.
- What on Earth is a polar vortex? And what’s global warming got to do with it?
Eric (skeptic) at 01:39 AM on 28 December, 2022Thanks for that nicely balanced article. For the recent event the AO index went negative. Negative AO is not necessary for an Arctic outbreak but it's indication of a north-south tendency in the jet stream. Also if negative AO leads to an outbreak, that outbreak could be anywhere in the NH and may not make the U.S. centric news in the U.S.
So a logical question to ask is what is the trend of AO? No trend: www.cpc.ncep.noaa.gov/products/precip/CWlink/daily_ao_index/month_ao_index.shtml. The papers by Francis a few years ago referenced the AO starting late fall and winter. That makes sense because the anomalous heat release from refreezing open water is highest in the fall continuing into winter. Arctic tempeature deviations from normal are highest in winter: ocean.dmi.dk/arctic/meant80n.uk.php. But consistently higher in the fall.
The CPC website provides a rendering of JFM AO: www.cpc.ncep.noaa.gov/products/precip/CWlink/daily_ao_index/JFM_season_ao_index.shtml. Perhaps a positive trend. One paper claiming a jet waviness trend used data ending in 2013. iopscience.iop.org/article/10.1088/1748-9326/10/1/014005 That's not convincing anymore given the newer data with opposite trend.
To show a connection, someone will need to take an index like AO and the temperature data e.g. DMI and look for changes in the index corresponding to increases in fall warmth shown in the temperature data starting around day 250.
It seems likely that we would see some correlation in the winter data from negative AO to the many of the spikes of warming shown in DMI. That would be correlation but would not mean the temperature spikes caused negative AO. More likely the opposite and a careful analysis of timing might tease that out.
- From the eMail Bag: the Beer-Lambert Law and CO2 Concentrations
Scruffy Scirocco at 23:24 PM on 25 December, 2022Useful article, but the example doesn't accurately reflect CO2 absorption. The example states that if you lost 1% of your energy through absorption in each cylinder, you would still have 37% of your ebergy after 100 cylinders. This is correct. But CO2 absorbs energy far more efficiently than that. Using the NIST data, the transmittance is only 30% through a 10cm path at 200mmHg. It's losing 70% of its energy, not 1%.
Granted, 200mmHg is far more CO2 than the atmospheric .300 mmHG of CO2 we're dealing with, but this means that an equivalent "cell" of absorption at 1 atmosphere with 400ppm CO2 would be 65.8m. After only 5 such "cells" you would have lost 99.76% of your energy to absorption.
We can discount re-radiation passing energy forward, as that's accounted for in the NIST measurements. The lost energy will be converted to heat, which will then conductively transfer to the other 99.96% of the gasses in the atmosphere, which will pass the energy upwards in their own spectral lines.
NO energy will be radiated into space in the CO2 absorption spectra - that atmosphereis completely opaque at those frequencies. Adding more CO2 won't change that. The idea that adding CO2 will change the characteristics of the re-radiation as it goes up the atmospheric column assumes that CO2 is the only gas, and that other gasses won't be conductively robbing the CO2 of the heat it's absorbed.
What WILL happen as CO2 levels increase is that the heat absorption will occur closer to the surface, causing an apparent increase in temperature, but this is offset by cooler temperatures at altitude, not accounting for convection and increased oceanic evaporation, which, while increasing the water vapor in the atmosphere (Major greenhouse gas) will also increase cloud cover and thus surface albedo, lowering the surface temperature of the ocean. - Skeptical Science New Research for Week #50 2022
peterklein at 07:12 AM on 16 December, 2022I mostly became mostly aware of the climate and global warming issue about the time that Al Gore began beating the drum (even while he continued to fly globally in his private jet). Since then, I've read about climate change and climate modeling from many sources, including ones taking the position that ‘it is not a question if it is a big-time issue, but what to do about it now, ASAP?’.
In the past few weeks, it appeared to me there has been a of articles, issued reports, and federal government activity, including recently approved legislation, related to this topic. While it obviously has been one of the major global topics for the past 3+ decades, the amount of public domain ‘heightened activity’ seems (to me) to come in waves every 4-6 months. That said, I decided to write on the topic based on what I learned and observed over time from articles, research reports, and TV/newspaper interviews.
There clearly are folks, associations, formal and informal groups, and even governments on both sides of the topic (issue). I also have seen over the decades how the need for and the flow of money sometimes (many times?) taints the results of what appear to be ‘expert-driven and expert-executed’ quantitative research. For example, in medical research some of the top 5% of researchers have been found altering their data and conclusions because of the source of their research funding, peer ‘industry’ pressure and/or pressure from senior academic administrators.
Many climate and weather-related articles state that 95+% of researchers agree on major climate changes; however (at least to me) many appear to disagree on the short-medium-longer term implications and timeframes.
What I conclude (as of now)
1. This as a very complex subject about which few experts have been correct.
2. We are learning more and more every day about this subject, and most of what we learn suggests that what we thought we knew isn't really correct or at least as perfectly accurate as many believe.
3. The U.S. alone cannot solve whatever problem exists. If we want to do something constructive, build lots of nuclear power plants ASAP (more on that to follow)!
4. Any rapid reduction in the use of fossil fuels will devastate many economies, especially those like China, India, Africa and most of Asia. Interestingly, the U.S. can probably survive a 3 or 4% reduction in carbon footprint annually over the next 15 years better than almost any country in the world, but this requires the aforementioned construction of multiple nuclear electrical generating facilities. In the rest of the world, especially the developing world, their economies will crash, and famine would ensue; not a pretty picture.
5. I am NOT a reflexive “climate denier” but rather a real-time skeptic that humans will be rendered into bacon crisps sometime in the next 50, 100 or 500+ years!
6. One reason I'm not nearly as concerned as others is my belief in the concept of ‘progress’. Look at what we accomplished as a society over the last century, over the last 50, 10, 5 and 3 years (e.g., Moore’s Law is the observation that the number of transistors on integrated circuits doubles about every two years!). It is easy to conclude that we will develop better storage batteries and better, more efficient electrical grids that will reduce our carbon footprint. I'm not so sure about China, India and the developing world!
7. So, don't put me down as a climate denier even though I do not believe that the climate is rapidly deteriorating or will rapidly deteriorate as a result of CO2 upload. Part of my calm on this subject is because I have read a lot about the ‘coefficient of correlation of CO2 and global warming, and I really don't think it's that high. I won't be around to know if I was right in being relaxed on this subject, but then I have more important things to worry about (including whether the NY Yankees can beat Houston in the ACLS playoffs, assuming they meet!).
My Net/Net (As of Now!)
I am not a researcher or a scientist, and I recognize I know far less than all there is to know on this very complex topic, and I am not a ‘climate change denier’… but, after
also reading a lot of material over the years from ‘the other side’ on this topic, I conclude it is monumentally blown out of proportion relative to those claiming: ‘the sky is falling and fast’!
• Read or skim the book by Steven Koonin: Unsettled: What Climate Science Tells Us, What It Doesn't, and Why It Matters /April 27, 2021; https://www.amazon.com/Unsettled-Climate-Science-Doesnt-Matters/dp/1950665798
• Google ‘satellite measures of temperature’; also, very revealing… see one attachment as an example.
• Look at what is happening in the Netherlands and Sri Lanka! Adherence to UN and ESG mandates are starving countries; and it appears Canada is about to go over the edge!
• None of the climate models are accurate for a whole range of reasons; the most accurate oddly enough is the Russian model but that one is even wrong by orders of magnitude!
• My absolute favorite fact is that based on data from our own governmental observation satellites: the oceans have been rising over the last 15 years at the astonishing rate of 1/8th of an inch annually; and my elementary mathematics suggests that if this rate continues, the sea will rise by an inch sometime around 2030 and by a foot in the year 2118… so, no need to buy a lifeboat if you live in Miami, Manhattan, Boston, Los Angeles, or San Francisco!
• Attached is a recent article and a Research Report summary.
Probably the most damning is the Research Report comparison of the climate model predictions from 2000, pointing to 2020 versus the actual increase in temperature that has taken place in that timeframe (Pages 9-13). It's tough going and I suggest you just read the yellow areas on Page 9 (the Abstract and Introduction, very short) and the 2 Conclusions on Page 12. But the point is someone is going to the trouble to actually analyze this data on global warming coefficients!
My Observations and Thinking
In the 1970s Time Magazine ran a cover story about our entering a new Ice Age. Sometime in the early 1990s, I recall a climate scientist sounding the first warning about global warming and the potentially disastrous consequences. He specifically predicted high temperatures and massive floods in the early 2000’s. Of course, that did not occur; however, others picked up on his concern and began to drive it forward, with Al Gore being one of the primary voices of climate concern. He often cited the work in the 1990’s of a climate scientist at Penn State University who predicted a rapid increase in temperature, supposedly occurring in 2010 and, of course, this also did not occur.
Nonetheless many scientists from various disciplines also began to warn about global warming starting in the early 2000’s. It was this growing body of ‘scientific’ concern that stimulated Al Gore's concern and his subsequent movie. It would be useful for you to go back to that and review the apocalyptic pronouncements from that time; most of which predicted dire consequences, high temperatures, massive flooding, etc. which were to occur in 10 or 12 years, certainly by 2020. None of this even closely occurred to the extent they predicted.
That said, I was still generally aware of the calamities predicted by a large and diverse body of global researchers and scientists, even though their specific predictions did not take place in the time frame or to the extent that they predicted. As a result, I become a ‘very casual student’ of climate modeling.
Over the past 15 years climate modeling has become a popular practice in universities, think-tanks and governmental organizations around the globe. Similar to medical and other research (e.g., think-tanks, etc.) I recognized that some of the work may have been driven by folks looking for grants and money to keep them and their staff busy.
A climate model is basically a multi-variate model in which the dependent variable is global temperature. All of these models try to identify the independent variables which drive change in global temperature. These independent variables range from parts per million of carbon dioxide in the atmosphere to sunspot activity, the distance of the earth from the sun, ocean temperatures, cloud cover, etc. The challenge of a multi-variant model is first to identify all of the various independent variables affecting the climate and then to estimate the percent contribution to global warming made by a change in any of these independent variables. For example, what would be the coefficient of correlation for an increase in carbon dioxide parts per million to global warming?
You might find that an interesting cocktail party question to ask your friends “what is the coefficient of correlation between the increase in carbon dioxide parts per million and the effect on global warming?” I would be shocked if any of them even understood what you were saying and flabbergasted if they could give you an intelligent answer! There are dozens of these climate models. You might be surprised that none of them has been particularly accurate if we go back 12 years to 2010, for example, and look at the prediction that the models made for global warming in ten years, by 2020, and how accurate any given model would be.
An enterprising scientist did go back and collected the predictions from a score of climate models and found that a model by scientists from Moscow University was actually closer to being accurate than any of the other models. But the point is none were accurate! They all were wrong on the high side, dramatically over predicting the actual temperature in 2020. Part of the problem was that in several of those years, there was no increase in the global temperature at all. This caused great consternation among global warming believers and the scientific community!
A particularly interesting metric relates to the rise in the level of the ocean. Several different departments in the U.S. government actually measures this important number. You might be surprised to know, as stated earlier, that over the past 15 or so years the oceans have risen at the dramatic rate of 1/8th of an inch annually. This means that if the oceans continued to rise at that level, we would see a rise of an inch in about 8 years, sometime around 2030, and a rise of a foot sometime around the year 2118. I suspect Barack Obama had seen this data and that's why he was comfortable in buying an oceanfront estate on Martha's Vineyard when his presidency ended!
The ‘Milankovitch Theory’ (a Serbian astrophysicist Milutin Milankovitch, after whom the Milankovitch Climate Theory is named, proposed about how the seasonal and latitudinal variations of solar radiation that hit the earth in different and at different times have the greatest impact on earth's changing climate patterns) states that as the earth proceeds on its orbit, and as the axis shifts, the earth warms and cools depending on where it is relative to the sun over a 100,000-year, and 40,000-year cycle. Milankovitch cycles are involved in long-term changes to Earth's climate as the cycles operate over timescales of tens of thousands or hundreds of thousands of years.
So, consider this: we did not suddenly get a lot more CO2 in the atmosphere this year than we had in 2019 (or other years!), but maybe the planet has shifted slightly as the Milankovitch Theory states, and is now a little closer to the sun, which is why we have the massive drought. Nothing man has done would suddenly make the drought so severe, but a shift in the axis or orbit bringing the planet a bit closer to the sun would. It just seems logical to me. NASA publicly says that the theory is accurate, so it seems that is the real cause; but the press and politicians will claim it is all man caused! You can shut down all oil production and junk all the vehicles, and it will not matter per the Theory! Before the mid-1800’s there were no factories or cars, but the earth cooled and warmed, glaciers formed and melted, and droughts and massive floods happened. The public is up against the education industrial complex of immense corruption!
In the various and universally wrong ‘climate models’, one of the ‘independent’ variables is similar to the Milankovitch Theory. Unfortunately, it is not to the advantage of the climate cabal to admit this or more importantly give it the importance it probably deserves.
People who are concerned about the climate often cite an ‘increase in forest fires, hurricanes, heat waves, etc. as proof of global warming’. And many climate deniers point out that most forest fires are proven to be caused by careless humans tossing cigarettes into a pile of leaves or leaving their campfire unattended, and that there has been a dramatic decrease globally on deaths caused by various climate factors. I often read from climate alarmists (journalists, politicians, friends, etc.), what I believe are ‘knee-jerk’ responses since they are not supported by meaningful and relevant data/facts, see typical comments below:
• “The skeptical climate change deniers remind me of the doctors hired by the tobacco industry to refute the charges by the lung cancer physicians that tobacco smoke causes lung cancer. The planet is experiencing unprecedented extreme climate events: droughts, fires, floods etc. and the once in 500-year catastrophic climate event seems to be happening every other year. Slow motion disasters are very difficult to deal with politically. When a 200-mph hurricane hits the east coast and causes a trillion dollars in losses then will deal with it and then climate deniers will throw in the towel!”
These above comments may be right, but to date the forecasts on timing implications across all the models are wrong! It just ‘may be’ in 3, 10 or 50 years… or in 500-5000+ before the ‘sky is falling’ devastating events directly linked to climate occur. If some of the forecasts, models were even close to accuracy to date I would feel differently.
I do not deny there are climate related changes I just don’t see any evidence their impact is anywhere near the professional researchers’ forecasts/models on their impact as well as being ‘off the charts’ different than has happened in the past 100-1000+ years.
But a larger question is “suppose various anthropogenetic actions (e.g., chiefly environmental pollution and pollutants originating in human activity like anthropogenic emissions of sulfur dioxide) are causing global warming?”. What are they, who is doing it, and what do we do about it? The first thing one must do is recognize that this is a global problem and that therefore the actions of any one country has an effect on the overall climate depending upon its population and actions. Many in the United States focus intensely upon reducing carbon emissions in the U.S. when of course the U.S. is only 5% of the world population. We are however responsible for a disproportionate part of the global carbon footprint; we contribute about 12%. The good news is that the U.S. has dramatically reduced its share of the global carbon footprint over the past 20 years and doing so while dramatically increasing our GDP (up until the 1st Half of 2022).
Many factors have contributed to the relative reduction of the U.S. carbon footprint. Chief among these are much more efficient automobiles and the switch from coal-driven electric generation plants to those driven by natural gas, a much cleaner fossil fuel.
While the U.S. is reducing its carbon footprint more than any other country in the world, China has dramatically increased its carbon footprint and now contributes about 30% of the carbon expelled into the atmosphere. China is also building 100 coal-fired plants!
Additional facts, verified by multiple sources including SNOPES, the U.,S. government, engineering firms, etc.:
• No big signatories to the Paris Accord are now complying; the U.S. is out-performing all of them.
• EU is building 28 new coal plants; Germany gets 40% of its power from 84 coal plants; Turkey is building 93 new coal plants, India 446, South Korea 26, Japan 45, China has 2363 coal plants and is building 1174 new ones; the U.S. has 15 and is building no new ones and will close about 15 coal plants.
• Real cost example: Windmills need power plants run on gas for backup; building one windmill needs 1100 tons of concrete & rebar, 370 tons of steel, 1000 lbs of mined minerals (e.g., rare earths, iron and copper) + very long transmission lines (lots of copper & rubber covering for those) + many transmission towers… rare earths come from the Uighur areas of China (who use slave labor), cobalt comes from places using child labor and use lots of oil to run required rock crushers... all to build one windmill! One windmill also has a back-up, inefficient, partially running, gas-powered generating plant to keep the grid functioning! To make enough power to really matter, we need millions of acres of land & water, filled with windmills which consume habitats & generate light distortions and some noise, which can create health issues for humans and animals living near a windmill (this leaves out thousands of dead eagles and other birds).
• So, if we want to decrease the carbon footprint on the assumption that this is what is driving the rise in the sea levels (see POV that sea levels are not rising at: www.tiktok.com/t/ZTRChoNTg) and any increase in global temperature, we need to figure out how to convince China, India and the rest of the world from fouling the air with fossil fuels. In fact, if the U.S. wanted to dramatically reduce its own carbon footprint, we would immediately begin building 30 new nuclear electrical generating plants around the country! France produces about 85% of its electrical power from its nuclear-driven generators. Separately, but related, do your own homework on fossil fuels (e.g., oil) versus electric; especially on the big-time move to electric and hybrid vehicles. Engineering analyses show you need to drive an electric car about 22 years (a hybrid car about 15-18 years) to breakeven on the savings versus the cost involved in using fossil fuels needed to manufacture, distribute and maintain an electric car! Also, see page 14 on the availability inside the U.S. of oil to offset what the U.S. purchases from the middle east and elsewhere, without building the Keystone pipeline from Canada.
Two 4-5-minute videos* on the climate change/C02/new green deal issue, in my opinion, should be required viewing in every high school and college; minimally because it provides perspective and data on the ‘other’ side of the issue while the public gets bombarded almost daily by the ‘sky is falling now or soon’ side on climate change!
* https://www.prageru.com/video/is-there-really-a-climate-emergency and
https://www.prageru.com/video/climate-change-whats-so-alarming - How climate change spurs megadroughts
Eric (skeptic) at 00:31 AM on 9 September, 2022Thanks for the feedback and suggestions. I want to clear up the dates for weaker monsoon since 2000 and La Nina since 1999. They are not related as far as I know, but they could be. The Pacific is cooler during La Nina and it is one of the two monsoon moisture sources for the SW US monsoon. Could be related in some other ways.
Monsoon weaker starting in 2000: NWS Phoenix monsoon data. Predominant La Nina starting in 1999: MEI Time Series (NOAA) from psl.noaa.gov/enso/mei/ Note that the monsoon statistics are only Phoenix AZ so a somewhat limited depiction. Also note that the MEI is one of several ENSO indexes. The Jan Null link provided above uses Nino 3.4 ocean temperatures. The regime change from El Nino (red in MEI link) to La Nina (blue in MEI link) doesn't show up nearly as much in the Nino 3.4 data.
I acknowldege my data is limited. But I believe drought is a natural occurrence affected by global warming. Drought will be more intense since warmer air holds more moisture from evaporation and transpiration. It can start sooner and end later for the same reason.
The climate.gov ENSO change analysis is very helpful. I believe however they should say the "switches" are affected in various ways by warming. It's not particularly useful to use "climate change" to describe cause and effect since climate change (not further defined) can be either cause or effect. The increase in amplitude is notable but their caveat is noted. I agree that the modeling is difficult and adding warming doesn't make it any easier. I think that added warmth doesn't necessarily change the sign of ENSO but wil enhance precipitation as they note, without adding much drought over the ocean (except possibly drier in the mid and upper levels). That could increase ENSO intensity since it is primary driven by precipitation.
I'll look at the hydrology material next.
- What’s going on with the Greenland ice sheet?
DK_ID at 12:27 PM on 1 September, 2022I had read of this study. I wish the expected minimum of GL melt were added to the expected SLR from land glaciers and thermal expansion plus an expected contribution from Antarctica. I believe SLR is tracking at or above IPCC maximum expectatons which would give 3-ft by 2100 without much contribution from the big ice sheets. The ARs have started icluded a footnote re the unlikely but feasible collapse of portions of the big ice sheets. But isn't collapsing how the Laurentide sheet left so quickly?
Hansen, et al 2015 showed that melt water from the GIS could slow the overtuning current resulting in more warmth staying in the Southern Ocean at the same depth as the grounding line for Antarctic draining glaciers. DeConto Pollard 2015 modeled collapse mechanisms (structural instabilities) of tall ice cliffs produced by melting and calving of those glaciers.
So I'd think the bad news from GL means bad news for the west and east Antarctic Ice Sheets and expected SLR by 2100 could be closer to 6' in a moderate emissions scenario. The question is, how much of that is already locked in? I understand the compulsion to not be too unconservative, but maybe it's time for a realistic look at what we are really expecting.
- There's no tropospheric hot spot
Cedders at 21:46 PM on 19 August, 2022Hello again. I hope this is a reasonable place to post a potential new myth or misunderstanding related to the upper atmosphere, which I read in a pamphlet by a noted contrarian (brother of a UK politician; a PDF is online and an earlier version found on a Reading University student debating blog). The confusing tract is almost entirely myths already covered on SkS, confusions of carbon stocks and flows, graphs of Antarctic CO₂ lag, faulty logic of causation, a proposal that increases in atmospheric CO₂ are a reaction to the MWP and coming from the oceans, and an incomprehensible suggestion that back radiation doesn't conserve energy. Then it mentions lapse rate and emission layer displacement but that 'this model also says that with more CO₂ the upper atmosphere at a certain level will get warmer ... the hotspot turned out to be a coldspot!'
Now it's not clear how the auithor made that connection; maybe it was the both emission layer displacement and 'hotspot' involve temperature lapse rate. I understand, as explained on the intermediate page here, that the negative lapse rate feedback is due to increased evaporation and latent heat transport from warming oceans, not directly related to CO₂. The pamphlet then ventures three reasons for the alleged inconsistency of model with experiment, never mind that it's actually consistent: these include changes in lapse rate curve (actually the basis of the hotspot), that 'transpiration cooling by plants... increases with CO₂' (the reverse is true, surely?), and then something that I can't verify one way or the other:
In the real atmosphere there are day/night temperature fluctuations (eg in upper atmosphere). They are larger with more CO₂ because CO₂ (infra red absorber / emitter) gains & looses [sic] heat easier than N₂ & O₂ and so enables all the air to adjust quicker.
So translating into my terminology, the idea is that diurnal temperature range at the top of atmosphere increases with CO₂ and contributes to temperature heterogeneity, total outgoing flux and negative Planck feedback. As GHG concentration increases, the effective top of atmosphere rises to less dense air, correct? (Which means daytime air might lose a similar amount of energy initially, but cool faster but then need mixing from lower layers to continue the same radiative flux to space. Or something.) So could it be a valid interpretation? My reponse would be that any such effect is covered in GCM models, but it would be quite difficult to pull it out and quantify it as a separate effect. It seems it might be a small negative feedback on the first-order effect, but is the logic of the speculation sound? Diurnal temperature variation at the surface will decrease with CO₂: will it decrease or increase or stay the same at height? Thanks for any references or insight.
- Record rain in St. Louis is what climate change looks like
Bob Loblaw at 05:23 AM on 3 August, 2022macquigg:
"Atmosphere holds more water" is too simplistic to evaluate water cycle changes. It's true that warmer air hold more water vapour, which is likely to lead to increased evaporation, but that also means that somewhere, at some time, there will be more precipitation, too. Globally, evaporation = precipitation on any reasonably long time scale (months), and the question becomes one of "how does the local balance change?".
Most land areas receive more precipitation than they lose in evaporation. Oceans are the opposite. Proof? Rivers draining from land to ocean. A lot of global variations in vegetation are explained by climate classifications that include some sort of water balance considerations (precipitation minus evaporation). The classic is the Koppen system.
Soil moisture for agriculture can decrease even if local precipitation increases - if local evaporation increases even more. So "more precipitation" does not necessarily mean "wetter" from a soil perspective. And for agriculture without irrigation, when rain falls is critical. As the old story goes, farmers always complain about rain. Too much; not enough; not at the right time.
For municipal uses, storage can help with seasonal and annual variability, but it can't make up for long-term expectations that want to use more water than is available from the long-term average.
Very local predictions from global climate models are hard to do, but Michael Sweet has pointed you to some possible sources of information.
- How to inoculate yourself against misinformation
Eclectic at 13:54 PM on 2 July, 2022David-acct @14 , you are making an extraordinary comment.
Firstly, your <"if scientists discover a forcing that is a greater factor than CO2 as a primary driver of warming"> argument is a complete strawman. (Presumably you are talking about the modern rapid "AGW" part of the Holocene . . . i.e. the sole topic of climate controversy during the past half-century.)
A strawman, because no mysterious unknown forcing has shown a niche for its own existence. No evidence has been demonstrated that might point to its possible existence.
Yes, in the past there were suggestions/proposals by Svensmark, Lindzen and others, but all such ideas crashed due to lack of any supporting evidence. But importantly, their "counter-CO2" ideas were not suppressed or censored. Those ideas were examined by scientists, and found to be without validity ~ and they are now in the category of disinformation (their only supporters are crackpots or worse).
The same goes for the continuing purveyors of <"it's all due to natural cycles of ocean currents/ orbits of Jupiter/ etcetera. >" Cycles which are 90% fanciful and 100% unphysical as a causation of [AGW]. These purveyors are desperadoes who a not censored by scientists, but are simply laughed at (or more generally ignored).
David-acct , I should also point out that if a significantly large "unknown" warming forcing were to be discovered, then there would also need to be the discovery of a (simultaneous) unknown cooling forcing (to neatly counteract the modern rise of CO2's forcing). David, I suspect you know in your heart that the chance of such a Double Whammy is infinitesimally small. In other words - you have created a strawman argument. Pigs = flying.
Suppression, stifling, censorship . . . all are fanciful arguments. Let's not waste any more time going down that road.
As to Covid matters : you will need to find another thread to discuss the issue. Unfortunately, you have been extremely vague in your accusations against the CDC. And I strongly suspect you are harboring a hotch-potch of distorted half-truths there ~ but I will wait to see if you can provide any evidence on that other thread. Good luck with it. My initial bet is that you have chosen to be the victim of medical misinformation and/or disiniformation.
Philippe C @7 , I owe you an apology for my slightly ungrammatical misquote "Vive la indifference" @13. It looked better that way for English readers, I thought. You will forgive me I hope, even if the Academie cannot.
- Climate Confusion
Evan at 20:57 PM on 28 June, 2022wayne@3, thanks for your comments.
The ocean time lag is a complicated function of the difference between the Equilibrium and Current temperature anomalies. Currently it is about 30 years for the current, specific CO2 profile, but this could change in the future. Currently temperature is increasing about 0.2C/decade, but hopefully this will decrease if and when we begin to aggressively cut GHG emissions.
An ECS of 3C is a reasonable estimate, and is about midway between the range of low and high estimates used by the IPCC.
EddieEvans@4, it's easy to write about the need for net-zero or net-negative emissions. Realizing them is quite another matter. The reason I focus on showing the CO2-stabilization scenario depicted in Fig. 2 is that by definition, we must achieve this much "easier" goal before we can ever hope to achieve the more ambitious net-zero or net-negative goals. So think of Fig. 2 as kind of a necessary first goal, first step. Just doing what Fig. 2 depicts would already be a huge success and would be a necessary precursor to more ambitious action.
- Antarctica is gaining ice
Andrew LB at 07:26 AM on 20 June, 2022
"Over the last two decades, the Greenland and Antarctic ice sheets have been losing mass, glaciers have continued to shrink almost worldwide, and Arctic sea ice and Northern Hemisphere spring snow cover have continued to decrease in extent (high confidence) (see Figure SPM.3). (4.2-4.7)"
NASA Study in 2015 clearly states Mass Gains of Antarctic ice sheet are greater than losses. I'll quote it.
A new NASA study says that an increase in Antarctic snow accumulation that began 10,000 years ago is currently adding enough ice to the continent to outweigh the increased losses from its thinning glaciers.
The research challenges the conclusions of other studies, including the Intergovernmental Panel on Climate Change’s (IPCC) 2013 report, which says that Antarctica is overall losing land ice.
According to the new analysis of satellite data, the Antarctic ice sheet showed a net gain of 112 billion tons of ice a year from 1992 to 2001. That net gain slowed to 82 billion tons of ice per year between 2003 and 2008. https://www.nasa.gov/feature/goddard/nasa-study-mass-gains-of-antarctic-ice-sheet-greater-than-losses
On a separate personal note, having lived less than a 2 minute walk from the pacific ocean for the past 40 years, i have yet to see any rise in sea level. One of the docks near my home has pole marked to indicate the current tide height and it's been there for at least 30 years, and a zero foot tide is still indicated spot on all these years later.
I think a lot of the people on this site are unaware of their own motivations and almost religious adherence the government mandated narraitive. It's usually a good idea to actually listen to the people in charge of international climate policy and you'll realize it's all a lie. United Nations climate official Ottmar Edenhofer said the following just a couple years ago.
"One has to free oneself from the illusion that international climate policy is environmental policy. This has almost nothing to do with the environmental policy anymore, with problems such as deforestation or the ozone hole,"
And just a few years prior to that he said:
"the next world climate summit in Cancun is actually an economy summit during which the distribution of the world's resources will be negotiated."
And a bit more insight:
"This is the first time in the history of mankind that we are setting ourselves the task of intentionally, within a defined period of time, to change the economic development model that has been reigning for at least 150 years, since the Industrial Revolution,"
"This is probably the most difficult task we have ever given ourselves, which is to intentionally transform the economic development model for the first time in human history."
And my favorite is how they went on to say that in order to make this happen, they must plunge the world economy into a depression in order to force the end of capitolism.
- SkS Analogy 1 - Speed Kills: How fast can we slow down?
Eclectic at 19:18 PM on 20 February, 2022Santalives @62 , since you mention me, I'll give my 2 cents, too.
The Y2K threat, as an analogy? Love it. Very droll of you.
But no real parallel, at all. And so poster John Mason @61 will still be waiting to see if you express your actual emotional motivation for you doubting the laws of physics. Will Newton's famous apple fall downward, or upward? Gosh, what a problem to solve.
Let me stand back and look at the overall problem. You, as an intelligent inquirer about climate . . . you have of course learnt about the 100,000-year Milankovitch cycles of warming/cooling of this planet. So you know that things have been gradually cooling ( around 0.7 degreesC over 4000 years, until about 1850 A.D. ) . . . which would naturally lead to a new "Ice Age" setting in around 16,000 - 20,000 years in the future.
Except now ~ for the past 170-ish years ~ the planet's temperature has reversed direction, is now going upward a at a rapid rate of knots (geologically speaking). The ocean is warming; the sea level is rising; and the planetary ice is melting rather than increasing.
In fact, the surface temperature is about 1.1 degreesC hotter than the mid-1800's (and it's slightly hotter than the plateau peak of the Holocene era, 5-10.000 years ago ~ according to the expert scientists who study past temperatures).
And the temperature is still rising rapidly ~ because physics. You know ~ Newton, Maxwell, Einstein . . . them guys. So the climate scientists of the past 100 years have predicted it would get warmer, and it's very clearly been getting warmer . . . and is continuing to do so. (Sorry Santalives ~ there's no contradictory observations there ~ and the ice and oceans don't lie to us.)
Climate predictions accurate enough for practical purposes? Check! World continuing to get warmer? Check! Scientists understand the reasons causing it? Check!
Sorry Santalives, but you've struck out: Three Times. And your batting average is still zero. Next innings better, perhaps? Seems unlikely, going on track record.
If you want a stretched analogy, Santalives (but not as stretched as your Y2K analogy) . . . then think about that old joke of the guy who fell off the top of the Empire State Building. Yeah, he was an optimist, saying:- 32 floors and okay so far . . . 45 floors and okay so far . . . 62 floors and okay so far . . .
For me, Santalives, I'm not such an optimist as you are. You, as a skeptic (aka science-denier) want to wait for the clear-cut splat onto the pavement. Me, I go with the scientific evidence, and vote for pulling the ripcord on the parachute [yeah, I know, that wasn't in the original joke . . . but you know what I am alluding to] .
In tally : climate predictions ~ Scientists 1 , Santalives 0 .
And real world observations ~ Scientists 1 , Santalives 0 .
Next innings please.
And a pleasure to talk with you, Santalives. Entertaining !
- How weather forecasts can spark a new kind of extreme-event attribution
Bob Loblaw at 00:03 AM on 13 January, 2022The problem I have with the "it's not climate change, it's greenhouse gases" narrative is that the chain of causality never ends. And at each step of the chain, the contrarians will come up with an excuse to ignore it.
After "it's greenhouse gases", the contrarians wll come up with one of the following bogus arguments:
- It's not CO2, it's water vapour.
- Methane is a more powerful greenhouse gas.
- Climate sensitivty is low.
- CO2 lags temperature
- etc.
Once you successfully argue that it is CO2, then you get
- Human CO2 emissions are minor
- Volcanoes emit more CO2 than humans
- CO2 is coming from the ocean
- The rise in CO2 is natural
- etc.
and then if you manage to establish that the rise in CO2 is due to burning fossil fuels, you get all the "it's not bad", "technology will save us", "you'll hurt the poor", etc arguments.
There are many such arguments on the Skeptical Science "Arguments" page. I have only linked to a few.
- Can we afford (not) to stop Climate Change?
sfkeppler at 01:42 AM on 16 September, 2021Dear Adam,
The most important thing is to understand what is going on! - I don't want any more question the reason of global warming. Everyone feels that there is something wrong with the earth's temperature. Minimizing carbon emission is perhaps the direct way scientists of IPCC want to go, but there is another physical fact - water!
We have to follow natural mechanisms of cooling the troposphere by water evaporation. This is not expensive, because does not need any energy other than that from the sun. We should evaporate water from the tropical oceans directly on the beach, additionally producing best salt. Does that cost anything to understand the global water-cycle, which comenses by the humidity of the evapotranspiration of the tropical mangroves, being transportet along tropical rainforests and lifted up to the cold region of the athmosphere by the tropical convection. From there it's transported to the southern and northern hemispheres, bringing rain and refrigeration. - Is it so difficult to understand??? - only evaporating seawater at the tropical east-coasts?
Stefan
- It's albedo
coolmaster at 10:47 AM on 13 September, 2021MA Rodger93:
MAR: "Your proposed grand scheme seems to be assuming atmospheric water can increase by 0.001335M km^3 annualy, or a 10% annual increase."
No - I never ever assumed, wrote or thought about that I plan or can increase atmospheric water by 1335km³ annualy.
You are making a very similar mistake as Prof. Stefan Rahmstorf from PIK in Potsdam in response to my comment in another climate forum.
Your mistake is probably that you have not read my posts with due attention, even though they are kept very simple and straightforward.
An increase in atmospheric water by 10% / year would mean that, according to the CCF, earth temperatures rise by approx. 1.4 ° C per year. A state of the climate which means certain death for all life on earth.
So you also completely misunderstood me.
My climate protection strategy would like to take the volume of 3.7mm SLR(1335km³) from the global rivers discharge when their water levels are sufficient(&clean) or even specially in flood events after rain- !!! to store it in soil moisture and groundwater over the land mass.
In principle a simple, seasonal storage of retained river water also to adapt to droughts and floods.
In dry seasons, this water will be mainly evaporated from agriculture, but also the before mentioned “amunas” of the old inca culture and their water management are a perfect way to rewet forests & moors.
hidraulicainca.com/lima/sistema-hidraulico-amunas/
This in turn ensures an increasing relative (and specific) humidity and additional cloud formation over land in a regional drought season.
After an average of ~8.5 days in the atmosphere it will return – even with a relatively high probability – as precipitation over another land area. There will be a multiplier effect that increase together with soil moisture and evaporation rate (wet regions become wetter).
As a result, the water cycle over the land areas is intensified by ~ 1-1,5% and thus the increasing size of the annual mean cloud cover over land areas leads to a higher albedo & CRE, which I estimate to be at least a cooling RF of ~ -0.2W/m² / year.
A really cooling, additional radiative forcing, which, in my opinion, can more than compensate for the current annual radiative forcing caused by CO² .
A holistic, functioning climate protection strategy,(stopping SLR AND global temperature rise & adaptation to droughts and floods) which works alternatively and independently of the reduction in CO² emissions, which only promises to stop the temperatures rise perhaps after ~ 2070 (if we as humanity can reduce emissions immediately – which I personally do not believe)
In the latest IPCC report / WG1 Chapter 7.4.2.4.3, the positive feedback of the cloud cover on an atmosphere warmer by 1 ° C is given with +0.42W m-2 ° C-1.
We are slowly but steadily losing not only areas of ice and snow albedo, but also the clouds albedo due to decreasing global mean cloud cover and higher lapse rate.
The cooling CRE with ~-19W m-2 (chapter 7.2.1. in the same report) should decrease accordingly.
The slower warming of the oceans means that there has not been enough moisture evaporated into – and then held in – the air above the oceans to keep pace with the rising temperatures over land. This means that the air is not as saturated as it was and – as the chart below shows – relative humidity has decreased, desertification is spreading rapidly mainly caused by human activities.
Dryness is a temperature driver and cloud killer.
That is why I (as an artist - not a climate scientist) think it's a good idea to create additional “artificial” clouds by additional artificial irrigation retained by river discharge from the superfluous water of the oceans.
---
MAR: but the reported 10% increase in evaporation rate 2003-19 over land equates to some 7,000km^3/y while the reported 3% increase in rainfall equates to 3,300km^3/y and the decrease in direct discharge from land to ocean a further 3,000km^3/y.
This suggests your grand scheme wouldn't make a ha'p'orth of difference. Evaporation over land is shown to have increased five-time the amount you propose yet AGW and SLR continued apace.
coolmaster: ???
360.57M km² ocean area * 3.7mm SLR = 1334.1km³ water = 8.93mm above the land area.
149.43M km² land area * 2.3L / m² increasing evaporation per year = 343.689km³ water.
* 1L / m² increasing precipitation per year = 149.43km³
* -1.01L decreasing runoff through the rivers per year = -150.92km³
* -0.75L decreasing groundwater level per year = -112.07km³
Your calculator probably has a built-in joker.
And if you are holding a PhD, you should hand it over (to me ?) as soon as possible. - It's albedo
Bob Loblaw at 11:49 AM on 11 September, 2021coolmaster @ 82:
Congratulations. Another comments policy violation. You can't find anything using Google? Maybe if you look at the Skeptical Science Team page, you will find some clues about my background and why your Google search failed.
It is amusing that you complain about a lack of links or references, when you still have yet to provide a reference for your claim that local surface evaporation will lead to a 1% increase in cloud cover. Just in case you have forgetten it, here is your original claim again:
This volume can be retained by a wide variety of measures before it flows into the oceans and converted into evaporation. - 9L / m² corresponds to ~ 1% of the average annual rainfall over land and should therefore create ~ 1% additional clouds over the land mass.
You repeat a diagram previously linked to. Let's us try to find the evidence we seek in that diagram.
- Cloud cover data? Yes, for three types (high, middle, and low).
- Clear annual cycles, especially for middle and low.
- Global total cloud cover? We don't see sums, but it is obvious that the low and middle cloud amounts are counter-cyclical... when one goes up, the other goes down. Less variation in high cloud. Could it be possible that these cloud types are responding differently to whatever the seasonal cycles are? Maybe there are changes in geographical distribution? Maybe differences between land and sea?
- Trends over time? Yes, And different trends for different cloud types.
Oh, there is that pesky cloud type issue again. Maybe it's actually important?
Now, let's look for evaporation data, so we can finally verify the elusive "1% increase in evaporation causes 1% increase in clouds" story.
Hmmm. I'm looking hard, but I don't see it.
- I see "atmospheric water". Is that "evaporation"? I don't think so. I seem to remember that "evaporation" is a flux from the surface to the atmosphere, not the storage in the atmophere.
- Are we looking at a system where increased evaporation is actually causing these cloud changes? I see no evidence of that.
- Oh, wait. Coolmaster has pointed out that this graph shows "...clouds feedback during the last decades triggered by a warming atmosphere..." My mistake - I thought you were trying to show data that supported your grand theory.
This is typical of what coolmaster has produced here: links to papers or diagrams, with no explanation as to how they are supposed to support his argument, leaving the reader to try to examine the paper or diagram in search of something only coolmaster sees. There is no "there" there.
You seem to like the IPCC reports. Since you appear to have a copy of AR6, I'll skip linking to it. Maybe it has something to say about your grand theory that irrigation can increase evaporation and cool the planet.
[search]
[search]
Oh, maybe this is it!
Section 7.3.4.1 Land use.
It mostly covers albedo changes for land, but the second last paragraph says: "The contribution of irrigation (mainly to low cloud amount) is assessed as –0.05 [–0.1 to 0.05] W m -2 for the historical period (Sherwood et al., 2018)."
Hmmm. With those error bars, it's hard to tell if the effect is positive or negative. It's also the total effect attributable to all the increases in irrigated land over the historical period. If the -0.05 number is correct, would there be a linear response to more irrigated land, so that 100x the historical area would lead to -5W/m2 and offset the CO2 forcing? How much water is used each year for current irrigated land?
That might give coolmaster a glimmer of hope. Why has he not presented this information before? Maybe the more detailed results in the reference the IPCC uses do not support coolmaster's grand theory? Maybe he just doesn't know what to look for?
Maybe coolmaster will eventually provide us with the evidence we need, but I won't hold my breath.
- It's the sun
Chuck at 07:07 AM on 31 August, 2021I appreciate the argument on recent decrease in solar output. But that is the "Gravity doesn't exist" argument. A person tracks a falling ball. Initially, gravity theory and fall rates match. Then they no longer match. So lesser scientists conclude that it's not gravity making the ball fall. "See, if it was gravity, then the ball fall rate would continue to rise." There are good arguments, but that's not a worthy one.
Scientists have long ago learned to account for fluids. With gravity, it's friction provided by the fluid called air. In climate, it's the fluid called oceans.
If I turn the stove down, stove element temperature will decrease. But, if the pan still has a temperature lower than the stove element, pan temperature will continue to rise. Oceans are about 7C warmer than the atmosphere. As sun and ocean temperatures fall, they will continue to increase the temperature of the atmosphere. Oceans will always have a temperature higher than the atmosphere. But, the gap does narrow as oceans cool and the atmospheric temperature continues to rise.
Think of atmosphere as aluminum foil and think of the oceans as the cast iron pan that is absorbing (and storing) solar heat. This will get you closer to the truth about climate change.
- How Increasing Carbon Dioxide Heats The Ocean
steve37341 at 12:38 PM on 7 August, 2021Eclectic @70, MA Rodger @71, & Bob Loblaw @72 thanks for each of your replies. I realized that I did not really give enough information about my scenario. The 25°/27° comparison was for atmosphere temperatures. Not average ocean temperatures. The average ocean temperature is the same in each situation. The only difference in the ocean variables is that in the example with the 300ppm CO2 and 27° atmosohere temperature, the sea level is 20 feet higher.
Also, the to get at the suggestion of where each situation is based on it's state, the example with the 300ppm has been steadily warming about 5000 years.
In the example of the 400ppm has been warming for about 8000 years and is still warming and the CO2 levels are continuing to increase, with the upper limit unknown.
I assume that the extra CO2 in the second example would eventually, is it stays higher long enough, would cause greater atmospheric temperatures and greater warming of the oceans. Or is this an incorrect assumption or could other variables come into play to alter that result(s)?
Another question. Assuming the mixing of the ocean waters in deep and shallow areas is relatively the same in each example, which is more important in heating more shallow areas? Higher atmosphere temperature, or higher CO2 level?
- Is Nuclear Energy the Answer?
Engineer-Poet at 11:18 AM on 4 August, 2021
You are wasting your time talking about radiation safety.
Oh, I don't know. Putting your intransigence out there for all to see has value.
My experience is that people who do not like nuclear recognize that the scientific consensus is LRNT.
How much of said "consensus" is from people in the "radiation protection" business—in other words, people with an interest in maintaining and ever-tightening the rules so they can make money from "minimization"? Meanwhile, health physics deals with the REAL world, and workers at university research reactors routinely take many times the dose allowed at commercial nuclear plants, yet suffer no ill effects. Why is this allowed? It's because research reactors are not competing with the fossil fuel industry; nuclear electric plants do. Evidence-based radiation standards would seriously reduce the operating and maintenance cost of nuclear electric plants, and applying the same radiation standards to fossil fuels would require things like the handling of radium-rich petroleum well pipe scale as radwaste with all the same protection standards as at nuclear plants. Such cost shifts might even get people to build more nuclear and use less fossil.
There is a LOT of uranium in the ground, and the decay chain of U-238 produces Ra-226 and Rn-222. A lot of this uranium chemically deposits in the same strata which host coal, oil and gas, which is why natural gas from the Marcellus shale is so high in radon. Gas stoves dump the radon straight into the air people breathe. I don't see any major "environmental" organizations demanding protection from that,do you?
People who are avid supporters of nuclear, like you, do not care how many people nuclear power kills
That's libelous. I used to spend 2 weeks a year mere miles from a Generation I nuclear power plant, and the rest of the year not too far from a university research reactor. Neither ever killed ANYONE. Both are gone now, with only the casks storing the used fuel showing the former was ever there (I don't know about the latter). I now live year-round mere miles from this "danger". Do I sound like I don't care about lives? It's MY life on the line here. I walk the walk.
Know what I'd love? I'd love a new nuclear plant on the site of the old one, causing people with radiophobia to stay away and not buy homes here. It would reduce my property value and thus my property taxes. Pay less money for the same or better quality of life (less crowding and cleaner air)? Sign me up!
and cherry pick their references to the few scientists who disagree with the consensus.
Science is not determined by consensus. It's determined by evidence, and anyone who will not look at the evidence has no business calling themselves a scientist. The evidence is on the side of Calibrese. Those opposed are not scientists, whatever degrees they hold or what they call themselves.
We are all familiar with the scientific deniers of climate change. Citing the few outliers of the LRNT consensus does not prove your point. The National Academy of Science strongly backs LRNT.
The acronym is "LNT", and the NAS shows every sign of having been captured by special interests. Fossil-fuel interests are notoriously wealthy.
As you pointed out, dissenters of the consensus were allowed on the committee.
But not allowed a voice. Calabrese has published many papers on radiation hormesis and the errors in LNT. None of those objections made it into the BEIR VII section on radiation hormesis, and yes I read it from end to end. What does this mean? (lemme try list tags here)
- The BEIR VII report reflects a majority view, not a consensus view and certainly not a view of the actual range of opinion in the field.
- The majority view is subject to capture by various interests, especially wealthy ones.
- Those interests are overwhelmingly benefitted by fossil fuels.
You need to acknowledge this. (love it, list tags rock)
Reviewing this thread I notice that opponents of nuclear power have never raised the issue of low level exposure to radiation as a reason not to build out nuclear.
That's implicit in the use of LNT to oppose nuclear energy.
It is raised by nuclear supporters.
Because we see no detectable increase in morbidity or mortality due to small increases in radiation; on the contrary, the evidence supports hormesis (when you can extend the median lifespan of rats from 460 to 600 days by irradiating them with gamma rays, it very likely has the same effect in all mammals including humans). We do see increases in morbidity and mortality with increases of criteria air pollutants and things like PM 2.5, neither of which are produced by nuclear energy. So why are you raising these issues? It's enough to make anyone think you're doing it in bad faith.
1) Nuclear plants are not economic. They cost too much to build.
France proved otherwise; France has some of the cheapest and cleanest electric power in Europe, while "renewable" Germany has some of the most expensive and continues to burn lignite. The way you make nuclear power cheaply is the same way you make automobiles cheaply: series production of stanard units. That's what France did in the 80's. That is not what France is doing now, which is why Flamanville costs so much.
2) Nuclear plants take too long to build.
They didn't used to. Ever ponder what's different now?
The breeder reactors you support have not yet been designed. Once they have a design (at least 5 years from now), the approval of the design takes 3-5 years.
So you admit that the regulators are a big part of the problem.
3) There are not enough rare materials to build a significant number of nuclear plants.
Nonsense. Nuclear plants do not require rare materials; they've just been convenient for the way we've been doing things since the 1950's. We don't have to keep doing things that way, and there are a great many reasons not to. Many of the new reactor concepts use other physical mechanisms than e.g. control rods to control the rate of reaction, so they have no need for the elements which go into them.
You admit in your post 260 that there is not enough uranium for your plan.
No, I said there's not enough land-based uranium to start the required fleet of fast-neutron reactors. There's more than enough in the oceans, and the depleted uranium already on hand in the USA would suffice to run the entire world for about a century on fast reactors. Also, there's more than enough thorium available to do the job (3-4x as abundant as uranium and it's almost 100% convertible to energy with thermal neutrons).
4) Your responses to Abbott are grossly inadequate and uninformed. For examply you claim "pretty much ANY site that has ever hosted a coal plant is suitable for a nuclear plant." Only 10 miles from my house is the Big Bend power plant (it is switching from coal to gas). This plant is too close to a city to be converted to nuclear
It's "too close" for nuclear, but far more dangerous and polluting coal (with far more radioisotope emissions from the tramp actinides) was just fine? Ye gods, if it wasn't for double standards, anti-nukes wouldn't have any standards.
(Mods: there's a bug in the way the post editor JS handles closing bold and italic tags when switching from "Source" back to "Basic" after pasting in HTML; a trailing space is deleted even when it's explicitly in the source.)
- The number of lives that clean energy could save, by U.S. state
Jds at 04:50 AM on 21 July, 2021Data graphs... Interesting... Fact sheets, do tell. Article by who? Really. Source links to a group that links it's source information back to itself.
C02 is not a poison until it reaches highly concentrated levels. Rarely happens.
.04% of our atmosphere is c02. .0016% of that .04% is manmade. Multiply the two figures together to get the % of the atmosphere which is manmade c02. That's .000064. If you added .000064% pink panther fiberglass to your outhouse your butt would still be cold in the winter.
Studies reveal!!! What studies? Oh, Yale. University. Must be smart kids there these days. Reading books. Looking at thermometers.
Been researching C02 detectors myself lately. Basic description for the most detailed I shall provide now.
Too housing contains filter mechanism. Bounces Electrons (little buggers) back and forth between electrode plates. Electrolytes (salt water? Potassium? Gatorade?) change c02 to o2 through oxidation (rust) and reduces (evaporates)... get ready far this... oxygen into water. O into H2O. Yup... water into wine as well I suppose. The electrodes are biochemically sensitive to these changes.
I'll have to look this convuluted one up again for further details. It didn't mention any silicone chips nor as usually typical the almighty laser.
Fancy thermometer at best. Get yours free shipping from Walmart for like $30.
You can't even find anyone who wants to admit being the inventor of these snake oil charms nor will you find any original patents. Yet hundreds of mostly fly by night companies sell them for prices up into the thousands.
Shows parts per million.
NASA has these million dollar detectors that shoot lasers from far above to hit the earth surface and I suppose eventually be picked up by some big Gatorade coated hunk of metal which detects out of each of the million parts that exist in the atmosphere... 400 are C02. Further calculations determine that we cased half of this.
Here is an interesting argument. It has been millions of years since the global temperature and C02 levels have been this high and man wasn't even around back then which proves man is the current cause!!! Most unintelligent argument to date. Who caused the high rates back then if we were not around? Wooly mammoth? Hairy hippos? It's like saying your daughter's boyfriend must not have worn a condom the last time they had sex because your great grandmother was pregnant at one time.
Please think before you make pointless arguments.
We humans if all in one spot on a globe shoulder to shoulder would not even be much of a pin point. Combine all of our biggest cities into one megalopolis... a small freckle on the on the face of ma Gaia.
Mother earth has made home for countless creatures... if we were to just add the ones we have yet to discover to the internet... google would overheat and break down from an overload. And yet we still search for even one or to life forms elsewhere.
Mother earth has survived subzero trips to the shore and hot lava baths. She is covered in worm poo and skunk diddle.
And you worry she will die from second hand smoke which has been circulating since the dawn of her birth.
Your numbers are baseless. Your charts disconnected. Your facts biased. Your proofs conjectured. Your projections assumed. Your own researched will lead you down rabbit holes that will have you as well ask questions to determine validity. Give it time and you find... fancy thermometers. People pointing lasers at silicone chips. Digital readings.
There are no valid reputable respectable people in the realm of all of our highest minds who can validate and properly explain the how function of your fancy thermometers. They just assume like you did that the producers knew what they were doing by way of high intelligence and education and not one in the line of them would ever attempt to decide or hoodwink. Nobody dares to question fancy thermometer for fear they will look unintelligent themselves.
And you can take my statements directly to any of our scientists. Then bring those kids to me. I would like to see their heads sink in sullen shame as we review all of the information available in the world about fancy thermometer... and here them admit to it's nonsense.
Nice charts. Splendid graphs.
Pretty fancy thermometers.
Now prove to me that our c02 without one shred of any doubt 100% caused the average number of tsunamis per year to go from 2 to 3.
Show me just one autopsy report stating cause of death was... air pollution.
Show me the beaches where brilliant scientists are dutifully lined up measuring constant instant by instant changing ocean depths and receding shorelines.
Show me that the number of facilities which extract atmospheric data from the air are evenly distributed across the world and not primarily clumped into rural areas. The ratio difference of such facilities between rural and non grows every year in favor of the rural. That in itself makes for apparant temperature anomalies.
Show me where climate summits, committees, activist gatherings and fancy thermometer operators ever saved or even improved the life of even one person. Common sense of a child would tell you if they spent one tenth of the time exploring ways to prepare ourselves for natural disasters that are unavoidable regardless of our activities (you do know such things exist?) they would save many lives. Just one tenth of your focus shifted toward a more fruitful activiy... it is not much to ask.
Show me empirical evidence and precision studies prove that a two degree raise in global temp makes an unstable earth when global temperates rise and fall many multiples of degrees higher and lower within seasons (Siberia holds 100° record differential), months, weeks, days, hours... any increment of time. Regionally two degree shifts happen within seconds... why can you not make a connection to calamity in these instances? Why do you refuse to admit 2° shifts over a century might be a small % normal. bet if I told the right activist that scientists predict an unpredicted ten degree shift in average global temperature within the hour... those activist would fall in panic, run out the back door with their fancy thermometers pass out from the frantic exhaustion of getting their ownselves heated over a common occurrence.
Show me the credentials of each and every root source of every last statistic you have blind faith in. I would like to know if fancy thermometer makers might not be pushing a few numbers. Bet your bank account some are.
Show me how C02 is killing anything currently. Start looking for actual single file individual case examples in the anals of all our history of even one person who passed out from too much carbon dioxide... I'll give you the rest of your life to produce such papers... good luck. Before you can do that I will prove c02 allows for more life to flourish.
Show me a year that has not had both record high and low temperatures. Of course we must remember readings are not evenly dispersed yet and the lasers attached to satellites are yet to be a cover all.
Show me again the ice age many of the scientists from the 70's were warning us about... where is it? Guess that concept was beginning to sell less copies so they had to change the format or big guv who has an interest in people who have a concern the main public is following will stop funding them... seriously I want you to reread that last statement a few times... let it sink in. Think about the implications and how very real they might we'll be.
Show me causation, not correlation. The person did not get a sun tan on a hot day because a coconut dropped on their head that day.
And really a bunch of the information I may come up with is questionable as well. Who knows what's right? They give us estimates, rounded figures, apple orange comparisons. Coming up with pictures of prehistoric creatures bases on fragments of a single jawbone... then tell us approximately how millions of years since jawbone beast roamed earth... somewhere within this multimillion year range... and the temperature at that time was... and their favorite food was... and they squatted when they pooed fluffy spinich like clumps. Really. They know these facts due to the data represented by their Walmart C02 detectors.
Suckers are not born every minute. They develop through passages of time by way of emotional stimulations. They are targeted. Their opinions are advocated, supported and fed so to break down their defenses. Once trust is gained... (after all, fancy thermometer man has my same concerns therefore his concerns are for me personally as well)... they strike.
And you buy... in full... pun intended (aren't most all?).
And I buy as well... in part.
I wish not to find you reGret the weather... the Thunder... the iceBerg. Us grown ups are patiently waiting for your heroes... your people of the year... fan favorites... to grow up yourselves and drop the hatred and blame. Please stop pointing to the minute spinach stains on the teeth of others when immense festering cavities are being ignored.
8% of human c02 production counted is through breathing. So you can't get us to net zero anyway unless you well... kill us. A % of our CO2 production which makes up part of the statistical reports you adhere to... are from farm animals... eating, pooing, breathing... existing. Us meat eaters are trying to be rid of them as well for your satisfaction but only so much can fit on the plate.
Getting to NetZero is impossible. Waste of time anyway.
Proving that the .00005% is the only factor in 2° rise in the last century is harder than proving the chickens furting in a tornado caused more property damage.
Please be useful.
Activism is well intentioned griping. Would you like reward for it? I don't ever think I found any activist of any cause who enriched our environment beyond a sprinkling... especially the griping or as as I like to call the negative activist. Even the great MLK who was a positive activist is predominantly known by his most endearing followers by just four words... "I had a dream" sad how the majority of the world only knows this much of the man. The four words can be attributed to anything. Further research will educate a follower his dream was basically that some day all races will get along... not to insult but many have said same message with less recognition. It was a world wide sprinkling recognized best because of his ability to sell the product of his speech with the decor of his character. Charisma was the salesman. Same for the young swedish girl with face twisting sputtering gripe furiously. If said in a calm sensible tone she would have been ignored. So I see the point of bringing out the personality to sell the product. A 90 yo business owner/salesman friend told me to be successful you must sell the sizzle not the steak...
I will not abide to that when it comes to you and this subject you invested in. Instead I simply ask you...
where's the beef?
- Human CO2 is a tiny % of CO2 emissions
Jds at 06:07 AM on 20 July, 20211. More testing for temp & c02 happens in or close to rural areas. Common sense logic. I need no link to prove. Why would you?
2. Saying the ocean increase of 8 inches since 1800's? When was the last time you saw vast amounts of brilliant scientists up & down the coastlines with yardsticks or God help me dipsticks measuring the lines as the ocean ebbs and wanes a great amount of times more than eight inches many times within decades yrs mnths wks days hrs mins? Maybe the guys back in the 1800's were comparing satellite images to determine the beginning rises? I do not need a link to prove this is b.s. Nor should you.
3. C02 gauges determining 400 parts out of 1,000,000 are c02? Fancy thermometer you have there & that is all it is. Electrochemical sensors? Did they count the atoms? Did they feel them? Smell them? Sorry el ch sensors only are in c0 detectors. C0 is even lower ppm than c02. C02 detects by measurements of laser intensity. Fancy thermometer. & Considering C02 can only possibly take up .05 to 5% of a given area that would mean variant temp detect would need be within those ranges as well. & Typal it would take the area of 3 average adults to have required amount of oxygen atoms needed to bond with carbon for such a reading of 400 ppm? Fancy thermometer. And this junk measures the laser intensity (pressure on the silicone chip... yes that's all.) in order to assume raises in c02 due temp rises? Fancy. Like if you had a concealed area void of all carbon oxygen etc and you lit a match to it the inner temp would not raise because only c02 can raise a temp! I do not need a link to prove this as quakery nor should you.
4. Global warming causes tsunamis? Do they mean the consistent average of 2 a yr which has never shown an increase as far as I know to 3 is & has been caused by humans? I do not need a link. Suddenly I am hungry for sausage though. How about you?
5. If .04 % of atmosphere is c02 & of that .04 we contribute .0016 of it that means we are changing approximate .00005 of atmo. An alien bug shifted a cosmic wind storm with a furt... seriously it did! But .00005% of your outhouse wallscovered in pink panther fiberglass... your still gonna shiver during snowy winter outdoor poo runs. Suddenly I no longer feel like sausage. Do you?
6. 2 degrees!!!! Omgomgomg! Over 200 yrs! Imagine if that happened in a minute? It does. & Within an hour day week month season decade century Millennium four score seven years etc. I even heard it goes up & down by higher than 2° in those time increments! Could you imagine waking up one morning and it was like 10°!!! This is why Eskimos don't visit Africa... they would melt. Animals, especially humans cannot adapt to extreme 2°+ changes... impossible... especially if they happen over decades... trust me that's what common sense scientists say. I'm trying to make a segue with Abe right now but politics are not allowed here. Shoulda txt 5 score & 8 yrs. Nor should you... sorry just trying to stick to a format here.
7. It's been millions of yrs since the earth has been this hot or had this much c02 & man was not even in existence back then which proves man did it! So who did it? Wooly mammoths? Hairy hippos? It's like saying your great grandmother to the ten millionth power got pregnant which prove the guy dating your daughter will not where a condom. Yeah I know... poor link. Norse soot dew.
8. 8% of our c02 production is what we breathe out. Gw alarmists should put a bag over there heads to help us get to the 0% c02 in the air which is what they want so that all plant life can die followed by all other life but at least surfers will not wipe out when a hundred ft high wave crashes upon them. Annette Fettuccine. Ignore her doo.
9. Animals breathe too... little effers. Get over here fido. It's time I introduced you to Mr. Gallon size ziplock. I'll leave the pasta in there so you can have a last meal. Dogs don't know it's not seven degrees hotter for Kevin bacon... nor does he.
10. You would think that after all this blaming mankind for every catastrophic thing that happens in nature from the monsoons to the tidal waves to rats overrunning Portugal the one's hitting the near end panic buttons with all their summits & committees & conferences & picnic BBQs & gov funding & YouTube funny cat video empirical research would come up with a way to significantly bring the average gt down by at least half a degree of our controllable portion so we could have only one & one half the amount of disasters. Like one and one half of a Suzuki.
The moral of the story.
Spending time preparing for the unavoidable will save more lives than attempting to eliminate mankind's effects toward the consequences of a chaotic nature. Therefore gw are murderers by way of their ignorance. It is like they are watching a man beat child while attempting to prove a too many carbohydrates will make man beat child... now if we can just keep Frankie Avalon from the spaghetti we might save a child from abuse!
- Skeptical Science New Research for Week #25, 2021
citizenschallenge at 07:37 AM on 24 June, 2021I've noticed the following starting to circulate through the internet: "Is the marine ice cliff hypothesis collapsing?" By N.R. Golledge, D.P. Lowry.
The gratuitously melodramatically titled commentary on,
"Transition to marine ice cliff instability controlled by ice thickness gradients and velocity."
Bassis JN, Berg B, Crawford AJ, Benn DI.
Science. 2021 Jun 18;372(6548):1342-1344. doi: 10.1126/science.abf6271.
Hopefully SkS will look at that paper and dedicate an article to looking at the details.
It's behind the paywall and the SN article left some tidbits unexamined: "The researchers also found that in relatively warm ambient temperatures, ice flow upstream of the cliff thins the glacier and reduces the height of the cliff, thus reducing the likelihood of runaway collapses."
Since the article addresses sea level rise - why is this elastic thinning of glacier height a reason for comfort? Doesn't it simply mean the flow into the sea follows a different regime/tempo? The bottomline being that the thinning is plenty significant of a situation that's starting to run away, in the wrong direction.
Also I found it curious that the news reports/reviews don't say anything about the study factoring in the warming ocean currents. Considering it's impact on eating away at glaciers, seem a rather important detail.
Did they include that? If not, why not?
I for one sure hope that someone from the SkepticalScience team takes the time to give this paper and Golledge & Lowry piece an informed closer look and writes a critical review.
One that helps us better appreciate any omissions in that study.
- The New Climate War by Michael E. Mann - our reviews
Nick Palmer at 09:33 AM on 23 June, 2021Just in case you lot are still resisting the idea that the politics relating to climate science have become extremely polarised - in my view to the point where ideologues of both the left and right think it justified to exaggerate/minimise the scientific truths/uncertainties to sway the democratically voting public one way or the other - here's a video blog by alt-right hero and part of the original Climategate team who publicised the emails, James Delingpole basically saying that 'the left' have infiltrated and corrupted the science for the purpose of using political deception to seize power for themselves.
https://www.youtube.com/watch?v=866yHuh1RYM
Deconstruct or follow up Delingpoles' rhetoric elsewhere and you will find a helluva lot of intelligent articulate people who believe that the public's environmental consciences are being exploited by closet socialist forces to deceive them, using 'fear porn', into voting for policies which they otherwise wouldn't consider voting for, in a dark strategy to bring in some form of latter day Marxism. They insinuate this has got its tentacles into climate science which they assert has led to the reality of the science, as presented to the public, being twisted by them for political ends. It's absolutely not just Greenpeace, as I already said, who've 'gone red' to the point where it has 'noble cause' corrupted their presentations of environmental matters and, crucially, the narrow choice of solutions they favour - those which would enable and bring on that 'great reset' of civilisation that they want to see. It's much, much bigger than that.
I think we are seeing a resurgence and a recrystallisation of those who got convinced by Utopianist politics of the left and free market thinkers of the right taught at University - Marxist-Leninism, Ayn Rand, Adam Smith etc. Most of those students eventually 'grew up' and mellowed in time, leaving only a small cadre of incorrigible extremists but who are now, as the situation is becoming increasingly polarised politically, revisiting their former ideologies. In essence 'woking' up. I submit that the real battle we are seeing played out in the arena of climate matters is not between science and denialism of science - those are only the proxies used to manipulate the public. The true battle is between the increasingly polarised and increasingly extreme and deceitful proponents of the various far left and right ideologies and their re-energised followers.
It is now almost an article of faith, so accepted has it become, amongst many top climate scientists and commentators, that 'denialism' is really NOT motivated by stupidity or a greedy desire to keep on making as much money as possible but is rather a strong resistance to the solutions that they fear are just 'chess moves' to bring about the great Red 'reset' they think the 'opposition' are secretly motivated by.
Here's an excellent article by famous climate scientist Katharine Hayhoe identifying those who are 'solutions averse' as being a major factor in denialism. It touches on the 'watermelon' aspect. You can turn a blind eye to what I am saying if you want, but in that case you should also attack Hayhoe too - but don't expect many to applaud you...
https://theecologist.org/2019/may/20/moving-past-climate-denial
Also try this: https://www.thecut.com/2014/11/solution-aversion-can-explain-climate-skeptics.html
https://today.duke.edu/2014/11/solutionaversion
I think some people who fight climate science denialism still have the naive idea that just enlessly quoting the science to them, and Skepticalscience's F.L.I.C.C logical fallacies, will make denialists fall apart. I too used to think that if one would just keep hammering away, eventually they would give up. Anyone who tries this will find that it actually does not work well at all. Take on some of the smarter ones and you will rapidly find that you are, at least in the eyes of the watching/reading/listening public, who are the only audience it's worthwhile spending any time trying to correct, outgunned scientifically and rhetorically. That's why I don't these days much use the actual nitty-gritty science as a club with which to demolish them because the smarter ones will always have a superficially plausible, to the audience at least, comeback which looks convincing TO THE AUDIENCE. Arguing the science accurately can often lose the argument, as many scientists found when they attempted to debate such notorious, yet rhetorically brilliant sceptic/deniers such as Lord Monckton.
I haven't finished trying to clarify things for you all but right back at the beginning, in post#18, I fairly covered what I was trying to suggest is a more realistic interpretation of the truth than the activist's simplistic 'Evil Exxon Knew' propaganda one. In short, most of you seem to believe, and are arguing as if, the science was rock solid back then and that it said any global warming would certainly lead to bad things. This is utterly wrong, and to argue as if it was true is just deceitful. As I have said, and many significant figures in the field will confirm, I've been fighting denialism for a very long time so when denialists present some paper or piece of text extracted from a longer document as 'proof' of something, I always try and read the original, usually finding out that they have twisted the meaning, cherry picked inappropriate sentences or failed to understand it and thereby jumped to fallacious conclusions - similarly I read the letters and extracts that Greenpeace used and, frankly, either they were trying deliberately to mislead or they didn't understand the language properly and jumped to their prejudiced conclusions and then made all the insinuations that we are familiar with and that nobody else seems be questioning much, if at all. The idea that Exxon always knew that anthropogenic climate change was real (which they, of course, did) AND that they always knew that the results of that would be really bad and so they conspired to cover that bad future up is false and is the basis of the wilful misreading and deceitful interpretation of the cherry picked phrases, excerpts and documents that has created a vastly worse than deserved public perception of how the fossil fuel corporations acted. Always remember that, at least ideally, people (and corporations) should be presumed innocent until proven beyond reasonable doubt to be guilty. Greenpeace/Oreskes polemics are not such proof. Their insinuations of the guilt of Big Oil is just a mirror image of how the Climategate hackers insinuated guilt into the words of the top climate scientists.
Here's a clip from my post#18
NAP: "When activists try to bad mouth Exxon et al they speak from a 'post facto' appreciation of the science, as if today's relatively strong climate science existed back when the documents highlighted in 'Exxon knew' were created. Let me explain what I think is another interpretation other than Greenpeace/Oreskes'/Supran's narratives suggesting 'Exxon knew' that climate change was going to be bad because their scientists told them so as far back as the 70s and 80s. Let me first present Stephen Schneider's famous quote from 1988 (the whole quote, not the edited one used by denialists).
S.S. "On the one hand, as scientists we are ethically bound to the scientific method, in effect promising to tell the truth, the whole truth, and nothing but – which means that we must include all doubts, the caveats, the ifs, ands and buts. On the other hand, we are not just scientists but human beings as well. And like most people we’d like to see the world a better place, which in this context translates into our working to reduce the risk of potentially disastrous climate change. To do that we need to get some broad based support, to capture the public’s imagination. That, of course, means getting loads of media coverage. So we have to offer up scary scenarios, make simplified, dramatic statements, and make little mention of any doubts we might have. This “double ethical bind” we frequently find ourselves in cannot be solved by any formula. Each of us has to decide what the right balance is between being effective and being honest. I hope that means being both.""
Stephen Schneider, as a climate scientist, was about 'as good as it gets' and he said that in 1988. Bear in mind that a lot of the initial framing to prejudice readers that 'Exxon knew' used was based on documents from considerably longer ago, so what are the activists who eagerly allowed themselves to be swept up in it until no-one questioned it turning a blind eye to? It's that the computer models of the time were extremely crude because computer technology back then was just not powerful enough to divide Earth up into enough finite element 'blocks' of small enough size to make model projections of much validity, in particular projections of how much, how fast and how bad or how good... Our ideas of the feedback effects of clouds and aerosols back then was extremely rudimentary and there were widely differing scientific opinions as to the magnitude or even the direction of the feedback. The scientific voices we see in Exxon Knew tend to be those who were suggesting there was lot more certainty of outcome than there actually was. That their version has been eventually shown to be mostly correct by a further 40 years of science in no way means they were right to espouse such certainty back then - just lucky. As I pointed out before, even as late as the very recent CMIP6 models, we are still refining this aspect - and still finding surprises. To insinuate that the science has always been as fairly rock solid as it today is just a wilful rewriting of history. Try reading Spencer Weart's comprehensive history of the development of climate science for a more objective view of the way things developed...
ExxonMobil spokesperson Allan Jeffers told Scientific American in 2015. “The thing that shocks me the most is that we’ve been saying this for years, that we have been involved in climate research. These guys (Inside Climate News) go down and pull some documents that we made available publicly in the archives and portray them as some kind of bombshell whistle-blower exposé because of the loaded language and the selective use of materials.”
Look at the phrases and excerpts that were used in both Greenpeace's 'Exxon Knew' and 'Inside Climate News's' exposés. You will find they actually are very cherry picked and relatively few in number considering the huge volumes of company documents that were analysed. Does that remind you of anything else? Because it should. The Climategate hackers trawled through mountains of emails - over ten years worth - to cherry pick apparently juicy phrases and ended up with just a few headline phrases, a sample of which follow. Now, like most of us now know, there are almost certainly innocent and valid explanations of each of these phrases, and independent investigations in due course vindicated the scientists. Reading them, and some of the other somewhat less apparently salacious extracts that got less publicity, and comparing them with the 'presented as a smoking gun' extracts from Greenpeace/Oreskes/Supran etc I have to say, on the face of it, the Climategate cherry picks look more evidential of serious misdeeds than the 'Exxon Knew' excerpts. Except we are confident that the Climategate hackers badly misrepresented the emails by insinuating shady motives where none were. Why should we not consider that those nominally on the side of the science did not do the same? Surely readers here are not so naive aas to believe that everyone on 'our side' is pure as the driven snow and all those on the 'other side' are evil black hats?
Here's a 'top eight'
1) Phil Jones "“I’ve just completed Mike’s [Mann] Nature trick of adding in the real temps to each series for the last 20 years (i.e. from 1981 onwards) and from 1961 for Keith’s [Briffa] to hide the decline.”
2) “Well, I have my own article on where the heck is global warming…. The fact is that we can’t account for the lack of warming at the moment and it is a travesty that we can’t.” [Kevin Trenberth, 2009]
3) “I know there is pressure to present a nice tidy story as regards ‘apparent unprecedented warming in a thousand years or more in the proxy data’ but in reality the situation is not quite so simple." Keth Briffa
4) Mike [Mann], can you delete any e-mails you may have had with Keith [Trenberth] re AR4? Keith will do likewise…. Can you also e-mail Gene and get him to do the same? I don’t have his e-mail address…. We will be getting Caspar to do likewise.” [Phil Jones, May 29, 2008]
5) “Also we have applied a completely artificial adjustment to the data after 1960, so they look closer to observed temperatures than the tree-ring data actually were….” [Tim Osborn, Climatic Research Unit, December 20, 2006]
6) “I can’t see either of these papers being in the next IPCC report. Kevin [Trenberth] and I will keep them out somehow, even if we have to redefine what the peer-review literature is!” [Phil Jones, July 8, 2004]
7) “You might want to check with the IPCC Bureau. I’ve been told that IPCC is above national FOI Acts. One way to cover yourself and all those working in AR5 [the upcoming IPCC Fifth Assessment Report] would be to delete all e-mails at the end of the process. Hard to do, as not everybody will remember it.” [Phil Jones, May 12, 2009]
8) “If you look at the attached plot you will see that the land also shows the 1940s warming blip (as I’m sure you know). So, if we could reduce the ocean blip by, say 0.15 deg C, then this would be significant for the global mean—but we’d still have to explain the land blip….” [Tom Wigley, University Corporation for Atmospheric Research, to Phil Jones, September 28, 2008]
Please at least consider the possibility that Greenpeace, who have been deceiving the public about the toxicity and carcinogenicity of this, that and the other for decades (ask me how if you want to see how blatant their deceit or delusion is... showing this is actually very quick and easy to do) were, in a very similar way, and motivated by their underlying ideology, deliberately (or delusionally) misrepresenting innocent phrases to blacken names excessively too.
- The New Climate War by Michael E. Mann - our reviews
RedBaron at 07:03 AM on 22 June, 2021@Nick Palmer,
There is one important potential unintended emergent property of complex systems effected by industrial CCS that I don't think you or anyone else has fully taken into account, and it is actually beyond my capabilities to fully understand as well.
Currently there is more carbon missing from our agricultural land and degraded ecosystems than extra CO2 in the atmosphere.
Lets just suppose that full scale CCS and BCCS are implemented worldwide at the same time as dramatic reductions in fossil fuel emissions happen. This would be in effect the "best case scenario". I don't see the best case scenario happening any time soon, but that does seem to be the goal in the short to mid term to at least stop AGW for now.
There might be a time when the monetary value of CO2 is so high that instead of a fight to reduce CO2 from the atmosphere, there could be a fight to extract CO2 beyond what is beneficial. There might also be some outgassing from the oceans or other sources that I cant begin to calculate.
As it turns out complex living biological systems are self regulating. So the risk of problems with BCCS are pretty small I think. However, it would seem to me that we could slip right past that so called "goldilocks zone" you mentioned. If CCS is profitable, and it must be made to be profitable or it will never happen, then we could potentially find ourselves with a new climate war in the future, with those benefiting from CCS fighting to extract every dime they can, including denialist think tanks obfuscating the issue in much the similar way fossil fuel companies hired the merchants of doubt to obfuscate AGW.
I personally don't trust the right decisions to be made from any centralized player, government or industry, where such huge temptation is fostered by the huge amounts of money floating around. It is one of many reasons my Red Baron Plan focuses so strongly on local, and profitability with or without a carbon price at all. The economics of abundance that support regenerative agriculture are in direct conflict with the economics of scarcity used by almost all economic systems used in the world today, left or right.
In either case though, this is a long term factor that needs addressed.
Can you imagine the disaster of a potential future where the Worldwide soils and ecosystems that support all life on Earth (including us) were not restored yet, but where the atmospheric CO2 was already dropping past 300 ppm down to 200 ppm and lower? It's a very serious part of the system that must be at least considered along with contingency plans.
- DMI show cooling Arctic
wideEyedPupil at 14:26 PM on 10 June, 2021Is the mean ocean temperature and/or mean air temperature at the e plat regions greater than the global mean (1.0-1.1 °C in the car of air temperature) or less than. I take it from this thread that it's the ice mass which determines the air temperature, rather than the other way around, acknowledging there must be a conservation of energy.
- A critical review of Steven Koonin’s ‘Unsettled’
citizenschallenge at 13:29 PM on 4 June, 2021
According to Koonin and the IPCC, there is no emerging “climate crisis.” And any change to climate that might occur will not bring economic devastation: it will result in a very modest reduction in what will still be extraordinary economic growth.
It's all fine and good rolling our eyes at the stupidity. But, you know: Why should they change what they're doing, if what they're doing, continues working like a charm?
People are terrified of our global/local Environmental Problem because they can't let go of their faith in a job that pays better and endless growth, so we can have more stuff (So we continue dancing to the contrarian script.
Think about Koonin's book and the idiotic articles, spreading like wildfire on the internet, that are being spoon fed to their constituents.
It's the same talking points, like a decades old broken loop. Bluster, misdirection, cynicism, backed by a self-certainty that only the thoughtless are capable of. - Still, somehow the other side* of honest, rational, pragmatic thinking (SkS and such), keep getting drown out and lost in the dust.
{*That is scientific constructive debates - where truthfully representing your opponent position and all around fidelity to the facts and honest are demanded, because learning as the goal.
As opposed to lawyerly political debate, where winning is all that matters and honesty is treated with contempt.}
Instead, it's the same old story, same old mind-boggling misdirections, knock people off their balance and always drawing the discussion away from the issues at hand.
Derailing every serious attempt at dialogue is their only goal.
I'm astounded at how well it works, and how the liberal science loving crowd still don't seem to be capable of bringing these discussions back on point.
Every idiot climate science contrarian claim, has the seeds of a wonderful story that can expose the lie being purpetrated, while helping explain this, or that, aspect of our Global Heat and Moisturer Distribution Engine, {which is our climate, atmosphere, ocean, land and crysophere in a dance of cascading consequences).
But most the time no one takes the time to make the effort to help explain simple science to willfully ignorate people. They tell me its a waste of time and effort. But, I keep wondering, if not for our 'opponents,' what about the folks on our own side. We could benefit from a better understanding of smarter arguments ourselves?
{Check out SkS Arguments section. Good basics, the facts.
Unless we are changing minds, we are losing. People who care, need to figure out how to make those facts come alive, in a way that helps people, not only understand our complex global weather systems, but to inspire them, this Earth is worth being in love with - Why not argue for trying to nurture, rather than consume and discard.
- SkS Analogy 22 - Energy SeaSaw
Evan at 19:05 PM on 7 May, 2021scaddenp@12 You make a valid point, and perhaps we should plot ocean temperatures together with air temperatures to emphasize their link and that they are driving each other upwards.
michael sweet@13, thanks for your comments. It's good to get affirmation of what is and is not connecting with readers (e.g., concept of decadal averages). The point of these analogies is certainly not to educate the experts (which I am not), but rather to communicate what the experts know to non-technical people.
I appreciate the time all of the experts have given to adding their comments here. Thanks.
- 2021 SkS Weekly Climate Change & Global Warming News Roundup #17
Eclectic at 21:29 PM on 27 April, 2021Dale H @6 ,
a somewhat brief overview from me as a non-expert :-
The atmospheric CO2 level was very high "from the start", in the sense of Pre-Cambrian times. Fortuitously, the early Sun was significantly lower in output (insolation has been increasing by 1% per 120 million years approx.)
In the long run up to now, exposed rock has very slowly absorbed CO2 by "weathering" to form carbonate which ends up on the ocean floor (and/or subducted by tectonic movement). And part of these carbonates is recycled into the atmosphere by volcanic venting.
The rate of weathering has varied at times. Also, there was a large "plunge" in CO2 level during the fossil-carbon formation in the Carboniferous age (much plant life, and no large herbivores?). A separate plunge during the Ordovician age (somewhat unclear, owing to uncertainty from poor time-resolution). And some major spikes in CO2 (and temperature) owing to Large Igneous Province eruptions such as the Siberian Traps and the Deccan Traps events.
Overall, it's been quite a ride !
The present latitudinal positions of the continents (plus Antarctica at polar position) has predisposed to glacial times for our planet. And likewise, the current "low" CO2. And if I have gathered correctly ~ in about an estimated 15 million years' time, the CO2 level would have become low enough to embarrass the present species of plants (unless they suitably evolve their photosynthetic mechanisms). Obviously the 15 million year time-scale gives the human race considerable leeway in tackling that particular problem.
Dale H , my apologies if you were already aware of much of this broad background. The SkS website has a vast amount of detail available for your self-directed searching.
As you have said you have already spent a goodly amount of time researching climate matters, then it might be advantageously efficient if you gave specific indication of where you feel puzzled or where you feel the mainstream climate scientists might be wrong.
If you need to raise particular questions, then it is standard SkS policy that you place one or two questions in the most appropriate thread . . . and deal with those questions . . . and then progress to the next question you have in mind.
- It hasn't warmed since 1998
Vonyisz at 01:51 AM on 21 April, 2021I would have a methodological questions. As this text suggests:
„To claim global warming stopped in 1998 also overlooks a simple physical reality - the land and atmosphere are just a small fraction of the Earth's climate (albeit the part we inhabit). The entire planet is accumulating heat due to an energy imbalance. The atmosphere is warming. Oceans are accumulating energy. Land absorbs energy and ice absorbs heat to melt. To get the full picture on global warming, you need to view the Earth's entire heat content. More than 90% of global warming heat goes into warming the oceans, while less than 3% goes into increasing the atmospheric and surface air temperatures. Nuccitelli et al. (2012) showed that the Earth has continued to heat up since 1998.”
– global warming is not really about temperature, but about the amount of energy.
But this is often misunderstood. Throughout the media, global warming is portrayed as if it could be characterized by changes in temperature.
Q = c * m * ΔT, but here c is not an exact value, consider large pressure and temperature differences
E (pot) = m * g * h, E (kin) = (m * v ^ 2) / 2
And I would have more questions here.
1. What do we refer to the amount of energy? Atmosphere? The kinetic and potential energy of air? With or without hidden heat? (The equivalent potential temperature (theta-e) is the temperature a sample of air would have if all its moisture were condensed out by a pseudo-adiabatic process (i.e., with the latent heat of condensation being used to heat the air sample), and the sample then brought dry-adiabatically back to 1000 hPa.) Surface? How deep? One meter? More? Caves? Groundwater that has a connection to the surface? Top 200 meters of oceans? Or the whole ocean? Energy stored in salinity and depth? Ice? Melting or freezing energy? Potential energy?
1.conc. Average global temperature? Why? When misleading in light of the above: the amount of energy (no matter how we determine what we include in it) is not equal to temperature. Thus, a change in temperature cannot be equal to a change in the amount of energy! Not me saying that. The quoted text does this.
2. We determine what we want to measure. Can it succeed? Can we assign a global average to the temperature of the entire earth? When I buy myself a pair of pants, at least three metrics help me with that. And do we characterize the average temperature of the earth (or rather the total amount of energy) with a single data? Even if we do, what are we going to do with it? What usable speech data does this tell us? This is because exactly what spheres are included in the total energy calculation are closely related to this data. If we calculate this as accurately as we wanted, what can we say about how long this accuracy has been available to us in the past? 10 years ago? 100 years?
2.atm. Do we really measure the temperature and humidity and density of the entire atmosphere? Do we really know the temperature of the earth's surface all over the earth at a depth of one meter?
2.surf. Do we know how much energy is stored in that part of the earth’s surface that is involved in the processes detailed here, absorbs sunlight, and largely heats the atmosphere? Do we know its density? Do we know your specific heat? Do we know its water content? Maybe it's not just the top one that counts? Could it be several meters in some cases? Who can say that? How to calculate? If someone says something, what to expect from him? How do you justify his theory?
2.oce. Do we know the temperature and the amount of dissolved salt everywhere in the oceans? Of course, we don't have an instrument everywhere, we fill in the missing data with approximation calculations. What is the ratio of the total error rate caused by the approximate calculations to the percentage of change to be examined? I read in several places that only the top 200 meters of the oceans matter in terms of global warming. Others write 100 meters. Many people write that the deep ocean has only long-term effects, it doesn’t count in the heat balance in the short term. Why a hundred? Why two hundred? Why doesn't it matter? The limit drawn here seems very arbitrary to me, and in terms of the change in total energy ... it is important to decide and justify: whether or not to include the deep ocean in the energy balance when examining global warming!
2.conc. I see a lot of temperature charts pros and cons. This is how the temperature goes up or how the earth cools. But none of the camps really show how the total amount of energy on earth measured according to the principles detailed above has changed, at least in the last 10-20 years, where perhaps we already have evaluable data in this regard. How can we start a scientific debate without clarifying the framework? The concepts? Principles of repeatable measurements? How is the data processed? Both camps bombard the media with marketing texts that pick it up as raw material and distort it so that it will no longer be completely untraceable to the average person.
3. A degree of warming of the whole ocean is approx. on the order of 10 ^ 24 Joules. Melting the ice of Antarctica would absorb 10 ^ 24 Joules of energy. A degree of warming of the dry air is on the order of 10 ^ 21 Joules. The Sun kisses the Earth with 10 ^ 24 Joules of energy in one year.
Based on these, the scare that the entire Antarctic ice sheet will melt soon seems rather doubtful. This event would eliminate the amount of energy in a whole year of solar radiation (of the same order of magnitude). This needs to be justified! While land ice heats the air when it forms and cools the air when it melts, the formation of coastal ice hanging in the ocean heats both the surface of the ocean and the air, but its melting typically cools the deeper layers of the ocean. Interestingly, land ice can be coastal ice. I hope I use good concepts. The direction of energy as a whole: heat is transferred to the atmosphere from the deeper parts of the ocean. People with CO2 can't warm up the ocean as a whole, just the top few hundred meters. And that is my next question. Are we counting the incoming solar rays and the outgoing infrared rays in the total amount of energy on earth? For example, the city is 35 degrees Celsius in vain if objects are 50-70 degrees Celsius and radiate heat unbearably to humans, while the same 35 degrees in the forest is unpleasant but tolerable because here the temperature of the objects is not higher than the air temperature. Here, the air temperature alone is very misleading. And sorry for the analogy, do we count the energy on the ocean heat transfer road to the total amount of energy on earth? I would like to draw attention to a trap. When the ocean conveyor delivers less energy, the average temperature in the upper part of the ocean is lower, but in this case heat is trapped around the Equator and the poles cool. On the other hand, with higher energy transport, the surface temperature of the oceans increases, most of the excess heat arrives at the poles from around the Equator, so significant warming begins here, more significant than at the Equator. However, the excess heat at the poles also means that the earth's surface can radiate over a larger surface at a higher temperature (T ^ 4). Overall, more heat is dissipated compared to when the capacity of the oceanic strip was smaller, disregarding other factors. I am thinking in particular here that, as soon as the Arctic ice melts in the summer, this process must be taken into account, because the thermal insulating effect of the ice will disappear.
3.conc. Is it conceivable that a change in the latter will affect a change in the distribution of the total amount of energy on earth? Perhaps these and other relevant metrics can bring the understanding and explanation of global warming closer to both experts and the average person? - It's planetary movements
Daniel Bailey at 02:45 AM on 30 March, 2021
"there is no effect on our climate"
Likeitwarm, while the Sun can influence the Earth’s climate it isn’t responsible for the warming trend we’ve seen over the past few decades. The Sun is a giver of life; it helps keep the planet warm enough for us to survive. We know subtle changes in the Earth’s orbit around the Sun are responsible for the comings and goings of the ice ages. But the warming we’ve seen over the last few decades is too rapid to be linked to changes in Earth’s orbit, and too large to be caused by solar activity.
One of the “smoking guns” that tells us the Sun is not causing the recent warming of Earth’s surface and ocean comes from looking at the amount of the Sun’s energy that hits the top of the atmosphere. Since 1978, scientists have been tracking this using sensors on satellites and what they tell us is that there has been no upward or downward overall trend in the amount of the Sun’s energy reaching Earth.
A second smoking gun is that if the Sun were responsible for global warming, we would expect to see warming throughout all layers of the atmosphere, from the surface all the way up to the upper atmosphere (stratosphere). But what we actually see is warming at the surface and cooling in the stratosphere. This is consistent with the warming being caused by a build-up of heat-trapping gases near the surface of the Earth, and not by the Sun getting “hotter.”
Scientists have quantified the warming caused by human activities since preindustrial times and compared that to natural temperature forcings.
Changes in the sun's output falling on the Earth from 1750-2011 are about 0.05 Watts/meter squared.
By comparison, human activities from 1750-2011 warm the Earth by about 2.83 Watts/meter squared (AR5, WG1, Chapter 8, section 8.3.2, p. 676).
What this means is that the warming driven by the GHGs coming from the human burning of fossil fuels since 1750 is over 50 times greater than the slight extra warming coming from the Sun itself over that same time interval.

https://science2017.globalchange.gov/chapter/2/#fig-2-3
The reality is, over the past 6 decades of significant global warming, the net energy forcing the Earth receives from the Sun had been very slightly negative. As in, the Earth should be cooling, not warming, if it was the Sun driving the observed warming of the past 6 decades. Does this mean the Sun is dimming? No. Over the centuries, the Sun’s output waxes and wanes between more active periods of time, like during the 1950s and 1960s, and periods when it is very quiet for decades like in the1600s (called a Grand Solar Minimum). However, the difference between the more active periods and the quieter periods isn’t very great and is not by itself long enough or great enough to propel Earth’s climate into either a runaway heating (like happened on Venus) or into an “snowball Earth”. Overall, the Sun has increased its output by roughly 10% per billion years of its life.
https://climate.nasa.gov/faq/14/is-the-sun-causing-global-warming/
https://www.climate.gov/news-features/understanding-climate/climate-change-incoming-sunlight
"brightening of the Sun is unlikely to have had a significant influence on global warming since the seventeenth century"
https://www.nature.com/articles/nature05072
What this means, in plain English: the warming caused by the greenhouse gas emissions from the human burning of fossil fuels is 6 times greater than the possible decades-long cooling from a prolonged Grand Solar Minimum.
Even if a Grand Solar Minimum were to last for a century, global temperatures would still continue to warm. Because the Sun is not the only factor affecting global temperatures on Earth.
https://agupubs.onlinelibrary.wiley.com/doi/full/10.1029/2010GL042710
https://agupubs.onlinelibrary.wiley.com/cms/asset/6dbf95a2-e322-4c92-838a-faf4dd77fa93/grl26938-fig-0002.png
https://agupubs.onlinelibrary.wiley.com/doi/10.1029/2011JD017013
https://agupubs.onlinelibrary.wiley.com/cms/asset/50198c16-0139-4e49-a7f2-e3e66e3af759/jgrd17754-fig-0006.png
https://agupubs.onlinelibrary.wiley.com/doi/full/10.1002/grl.50361
https://agupubs.onlinelibrary.wiley.com/cms/asset/a4f99608-109a-410d-99e6-d1c80799bccc/grl50361-fig-0002-m.jpg
https://agupubs.onlinelibrary.wiley.com/doi/full/10.1002/grl.50806
https://agupubs.onlinelibrary.wiley.com/doi/full/10.1002/2014JD022022
https://www.nature.com/articles/ncomms8535
https://www.nature.com/articles/nature21364
https://www.swsc-journal.org/articles/swsc/abs/2017/01/swsc170014/swsc170014.html
https://academic.oup.com/astrogeo/article-abstract/58/2/2.17/3074082
https://iopscience.iop.org/article/10.3847/2041-8213/aaa124/meta
https://www.atmos-chem-phys.net/18/3469/2018/
https://www.sciencedirect.com/science/article/pii/S0277379118307261
https://www.nature.com/articles/s41561-019-0402-y
https://journals.ametsoc.org/doi/abs/10.1175/JCLI-D-19-0059.1
https://climate.nasa.gov/blog/2953/there-is-no-impending-mini-ice-age/
https://www.nasa.gov/press-release/solar-cycle-25-is-here-nasa-noaa-scientists-explain-what-that-means
The human forcing is now the dominant forcing of climate, dwarfing all natural forcings combined. Even that from the Sun.
- 2021 SkS Weekly Climate Change & Global Warming News Roundup #9
jamesh at 03:08 AM on 3 March, 2021I have 2 final comments that I believe ot be on topic (please keep in mind that I am an engineer by training and experience and we tend to see the big picture; it's not easy to focus on individual issues) My first comment relates to Bobs posting #2; Item #4. The statement that "CO2 in water does not behave like most other gases" addresses a question that has bothered me for a long time; that is how can CO2 as an ordinary GHG force global warming. Thank you Bob for a clear explanation. I assume SKS on in agreement as are associated scientists. The second comment is just an observation. The comments above focused mainly on ocean temteratures whereas Dr Mann's paper dated 01 April 1998 delt with measured on the ground temps in industrial areas and he did introduce the concept of climate forcing and CO2's ability to force climate change is related to it's ability to perform as a super GHG
- A Climate Bet Impossible to Lose
Philippe Chantreau at 05:20 AM on 2 February, 2021You cheated. Ocean cycles were rebooted in the middle and then commandos of invisible leprechauns were lighting fires everywhere to heat up things. I'm pretty sure I saw it on FaceBook. It's all a hoax.
- Arctic Sea Ice Minimum Volumes Video - 2020 edition
Bob Loblaw at 10:37 AM on 6 December, 2020Wilt:
Regarding your first point, keep i mind that large bodies of water in the Northern hemisphere, such as Hudson's Bay and the Great Lakes, already go through seasonal cycles from ice-free to substatially ice-covered. Even an "ice-free" Arctic Ocean will have a lot of ice for a lot of the year.
https://www.glerl.noaa.gov/data/ice/#historical
Yes, penetration of solar radiation into open water is a primary mechanism of feedback for additional warming. Maximum solar radaiation is on June 21, though - not in September when the ice minimum will (most likely continue to) occur.
As for point #2: RealCimate has freqently dicussed the Atlantic Meridional Overturning Circulation (AMOC) and it's potential climate effects. A search there for AMOC turns up several posts over the years. The most recent one is:
- Climate's changed before
Eclectic at 16:41 PM on 28 October, 2020Hal Kantrud @860 (continued)
The rise in sea level during the past 150 years or so is the result of oceanic "swelling" - roughly half from thermal expansion and half from increased mass (the contribution from melting of land ice). Land rebound is too small to make much difference over 150 years. Likewise the "oceanic siphoning" as the ocean floor slowly sags a bit, under the increased weight of total ocean.
In short, it's a matter of the observed global warming. If you are questioning the connection between the recent spike in Greenhouse Gasses [ GHG's ] and the recent spike in global warming . . . then you've come to the right place, here at SkS website. Loads of info available via the Home Page.
- 2020 SkS Weekly Climate Change & Global Warming News Roundup #37
KR at 22:58 PM on 14 September, 2020NOAA (US National Oceanic and Atmospheric Administration), responsible for much of US weather prediction, has hired David Legates as new deputy assistant secretary of Commerce for environmental observation and prediction, a position that would report directly to acting NOAA Administrator Neil Jacobs.
Legates has a long history of climate denial, including a series of poorly written papers coauthoring with Willie Soon. This is likely another move by the current adminstration to put climate denialists and industry boosters into environmental posts, and to influence science reports with political oversight.
DesmogBlog write-up on David Legates
Washington Post article on his hiring
The next administration, assuming it's not Trump and company, will have a great deal of work to do reversing this dismantling of the US environmental and climate frameworks.
- Spreading rock dust on fields could remove vast amounts of CO2 from air
daveburton at 16:20 PM on 14 August, 2020Eclectic, I agree that it's drifting from the core topic, into a discussion of the key assumption behind the core topic, but the Mod asked me for it, so I obliged.
What do you imagine resembles "cherry-picking" in my response to him? I tried to avoid anything which could be considered cherry-picking.
I showed him the highest and lowest temperature indexes. I showed him the effects of eCO2 on the most important C3 and C4 crops. I showed him the best sea-level measurement record in the biggest ocean, which has a very typical trend. I showed him both hurricanes and tornadoes. Etc, etc. What do you think I omitted?
He asked a very broad question. He asked me to provide "creditable evidence, preferably peer-reviewed publication" in support of my contention that rising CO2 levels aren't a problem.
To thoroughly answer that would require a full cost-benefit analysis!
That's obviously not doable here. But even to quantitatively address the question of whether or not rising CO2 levels are a problem requires an examination of both costs and benefits. So I touched on all the major supposed costs, and also on the major benefits. I tried to answer his question, as best I could, without writing a whole book, and while providing credible references for every claim, as he requested.
I relied on measured evidence, rather than speculative studies based on models, because, in science, measurements are much, much stronger evidence than modeling. Computer model outputs are just calculations: at their best representing the consequences of robust hypothesis, at their worst representing bugs — and usually, actually, somewhere in-between. - Milankovitch Cycles
Eclectic at 13:49 PM on 4 August, 2020Kylesa @63 , your question is a bit off the bulls-eye.
The climate change caused by the Milankovitch cycle during the past 1 million years, has occurred in cycles of approx 100,000 years. It is much more correct to say that those climate cycles have been triggered by the Milankovitch orbital alterations ~ because the Milankovitch changes in solar heating of the Northern Hemisphere are very slight (purely in themselves much too weak to make a difference in global climate). However, these slight changes are then greatly magnified by the consequent change in atmospheric CO2, as the atmospheric CO2 leaves or enters the planetary oceans.
Basically, I think of the recent glaciation/de-glaciation cycles as being caused 10% by the Milankovitch changes (which are the trigger) and 90% by the CO2 rise/fall (the CO2 being the main charge of gunpowder moving the bullet).
More than 1 million years ago, the Milankovitch cycles were still in operation, but were having near-zero effect on climate because the atmospheric CO2 level was so high it swamped the tiny Milankovitch effect.
The anthropogenic causes (mostly the fast-rising CO2) have been so rapid and powerful in causing GW, that it's fair to say that the weak and ultra-slow Milankovitch effects are tiny/negligible ~ like comparing a cockroach to an elephant.
- 2020 SkS Weekly Climate Change & Global Warming News Roundup #31
gseattle at 08:12 AM on 3 August, 2020The science is clear. Unless we're missing something.
"A 2015 study suggested that the Atlantic meridional overturning circulation (AMOC) has weakened by 15-20% in 200 years."
"May 20, 2020 - Over the last 200 years, the magnetic field has lost around 9% of its strength on a global average."(ESA)
"Atlantic Circulation [is] Consistently Tied to Carbon Dioxide". Weakening AMOC means more CO2 is left in the air instead of absorbed in the ocean, no?
The missing piece of the puzzle is whether electrically conductive salt water experiences the Lorentz force moving through earth's magnetic field.
Weaker field = less AMOC = less ocean CO2 = more air CO2 which is what we're seeing and most of it is from nature (NOAA), and the time frame is even correct.
Since the field is only half a gauss, the question is the quantity of force compared to the coreolis effect, convection or other forces.
Scientists are currently frustrated in trying to model AMOC so that might be a missing factor.
It's presented here as just a theory that can be checked out if we want to cover all the bases to avoid missing anything.
Does this fall into one of the four categories or might there be a fifth? - It's only a few degrees
MA Rodger at 21:00 PM on 30 June, 2020Jasper @3, Yet another take.
You write "I get that a few degrees make a huge difference. I don't fully understand why a few degrees matter so much." Although a huge difference is suggestive that it does matter, I read your meaning that you are after an authoritiative take on the effects of "a few degrees" and something with a bit of meat on it.
Warming the globe by "a few degrees" will make a big difference to the climate system which has been previously reasonably fixed for millenia and so will bring unprecedented change for human civilisation. But providing an authoritative account of what that change will amount to isn't so easy.
Will those "few degrees" be enough to stop the AMOC and plunge Europe into a mini-ice age, enough to broaden the Hadley Cells and turn the central US lands and the Mediterranean lands into deserts, to green the Sahara and turn the Amazon into a treeless savannah? The answers are not straightforward. There is no long list if definitive outcomes set out in the headlines of the IPCC AR5 Synthesis Report. The word "risk" features too often when IPCC describes such outcomes.
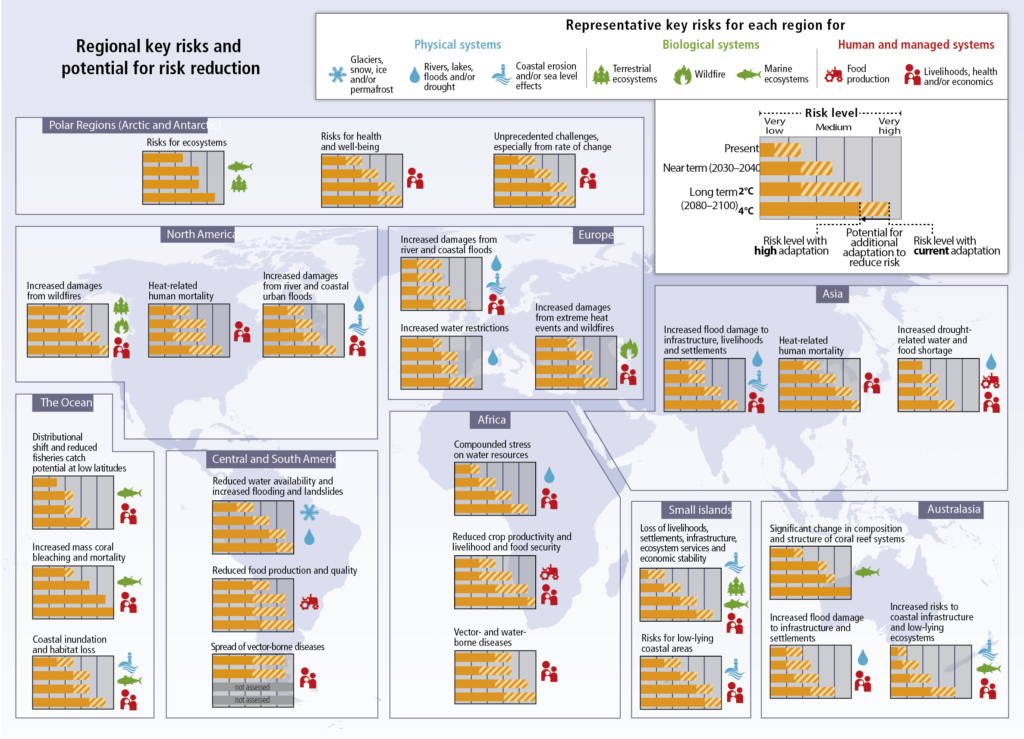
But there are a couple of definitive temperature-related outcomes from AGW.
One is that Greenland will melt out somewhere between +1ºC and +2ºC threatening serious sea level rise. (The IPCC AR5 puts the upper bound at +4°C which is rather a fudge. Antarctica's ice caps are similarly a threat but how quickly they will react to global temperature rise is not well enough understood to be so predictable.) Another is the habitability of the tropics for humanity and perhaps a third is ocean acidification which would be unprecedented in tens of million of years.
If Greenland were to melt down (a process that once started will not stop as the top of the Greenland ice sheet today sits happily frozen high up in the cold upper atmosphere), the oceans would rise by over seven metres. This compares with the last six thousand years (which spans the period of human civilisation) when changes in sea level could be measures in centimetres. A seven metre rise would be a big problem as so much of our populations today live close to sea coasts. (About a third of humanity inhabit land less than 100 metres above sea level while the loss of both Greenland and Antarctica would raise sea levens 75 metres.) The melt-down of Greenland would take a few centuries to make its mark but the process certainly becomes unstoppable if global warming remains two degrees centigrade above pre-industrial.
The "few degrees" global temperature rise that accompanied the warming from the last glacial maximum 20,000 years ago and the dramatic impact on climate has been mentioned up-thread. The change in climate resulting from another similar-sized rise in global temperature would be just as dramatic for humanity. If global temperatures rose by six degrees celsius above pre-industrial, it could perhaps be described as a "Steam Age" as the increase in wet bulb temperatures would make the tropics a death trap for humans outside air conditioning. And such a six-degree temperature increase by 2100 is within the projection of the Business-As-Usual scenario of the IPCC.
The ocean acidification would rival that of the PETM 55 million years ago but would happen in decades rather than tens-of-millenia.
There is a big pile of reason not to let AGW run beyond +1.5°C. The implications for humanity and for much of the biosphere will be catastrophic if we let AGW run. It's a bit like jumping off a cliff. Predicting the height it would require for the fall to split your skull open is not straightforward but that is no reason to consider jumping. Besides, when you fall it's the intracranial hypertension that usually kills.
- Sea level is not rising
Eclectic at 15:52 PM on 19 February, 2020Duncan61 comments today on another thread [wildfires] :-
< "O.K. where is the sea level rising.I took it upon myself to contact Freemantle port Authority and they have measured no change in 163 years.If a lot of the ice has melted why is the sea not going up???.Is it O.K. for me to ask or is it a secret " >
Duncan, the scientific data shows a 200 mm rise in sea level at Freemantle in modern times ~ which is kind of average for worldwide sea leve rise (currently rising about 3mm per year and accelerating). The moderator indicates that you sometimes have to adjust for vertical land movement also : but that's less than 0.2 mm per year for coastal Western Australia, so quite insignificant.
Why would you think (or believe) that 100+ years of global ice melting and global ocean warming . . . would not produce an ongoing sea level rise? Even the science-denying propaganda shill who calls herself JoNova and who loves to deceive & mislead her readers . . . even she admits that the Freemantle level has risen 200mm in just over 100 years.
So it's a puzzle, Duncan, how you came to take up the ridiculous nonsense you got from the Freemantle Authority. Sounds like maybe your informant was a jokester enjoying pulling your leg . . . or he's a rabid Flat-Earther . . . or his brother is a Real Estate agent trying to clinch a big waterfront land deal. Could be all sorts of reasons for someone coming up with such rubbish, don't you think?
Freemantle sea level does fluctuate 150 mm over a decade or so, as the oceanic current is affected by the larger-scale effects of El Nino & Indian Dipole oscillations ~ but that averages out to about zero alteration to the underlying mean sea level rise coming from AGW. But I doubt it was that half-truth cherrypick which was what your misinformant was trying to trick you with.
Best just to stick with the reliable mainstream science, rather than listen to a source similar to "a guy you met at the tavern".
- Murry Salby's Correlation Conundrum
Bob Loblaw at 06:24 AM on 17 February, 2020It looks like Max Polo's tenure here has ended, but for the benefit of anyone reading this far and not wanting to read the thread over at AndThenTheresPhysics, here is the lowdown on what Max gets wrong in his post above.
Max does fine until he gets to the point where he breaks natural uptake into two components, Un = Unn + Una.
- There is no physical basis to seperate those two fluxes. Max's equation is imply an algebraic distraction.
- One might divide natural uptake into physically-real components such as ocean vs. terrestrial, biotic vs. chemical, etc. Each of these would react differently over time, because there are different process involved.
- Each of those simply responds to the current atmospheric CO2 concentration, though - with no differentiation between CO2 that was emitted from natural sources, and CO2 that was emitted from anthropogenic sources.
- Where Max says "Unn = “natural” carbon that would get absorbed by natural sinks in absence of human emissions", he is wrong. His Unn term is actually carbon that would get absorbed by natural sinks if atmospheric CO2 had not increased. Except CO2 has ncreased. And natural uptake changes as a result. It is now Max's Unn+Una, algebraically, but it is not two different things - it's just natural uptake.
CO2 uptake varies with time. The Mauna Loa (Keeling) curve shows this clearly when the seasonal cycle is included. It does this for physical reasons, not algebraic ones.

The rest of Max's algebraic manipulations are meaningless. There is only one "natural uptake" term that can be used: Max's Un. And Un>En, so nature is a net carbon sink, not a source.
Max's "nature can be a net emitter" only applies when you fail to include a portion of the natural uptake, which is exacly what Max has done (his Una term). It's like saying "my gambling debts are not draining my bank account, because my bank account shows a net increase if I ignore my gambling expenses". There is a pyschololgical term for what that gambler is thinking.
- 1934 - hottest year on record
Eclectic at 16:18 PM on 1 February, 2020Map @109 , the chart at Figure 2. shows a very strong warming from about 1975. In the early part of that century, there were some colder years around 1910 ~ but no strong trend 1880 - 1930.
I think you would need to do some careful statistical analysis, to demonstrate a trend there. AFAICT, there's nothing much. Taking a wider swathe of data, pre-1910 , shows a gradual & slight warming trend from mid-Nineteenth Century, but it's rather weak. There are of course fluctuations, from clusters of large volcanic eruptions, or from slight variations in solar output or from El Nino events. All part of the natural random variations . . . plus possibly (and dubiously) some multidecadal oceanic overturning currents (but these are only very slight in their effects ~ if they exist at all, and are not simply figments of imagination as humans indulge their tendency to see "shapes & patterns" in random data points).
Map, I suspect you are "seeing" trends that don't exist.
Weather tends to vary around the cyclic seasonal changes, because it is small-scale fluctuations against a global (hemispheric) background . . . but climate change requires major alteration in global-level gain (or loss) of heat energy over a sustained period of time.
The important point with climate, is that climate does not change unless something causes it to change. That's why the often-seen idea that our modern period of warmth is just a "rebound" from the Little Ice Age . . . is a complete nonsense.
Map , if you wish to step back and look at temperatures of the entire Holocene period, then it becomes apparent that the world has been in a gentle cooling trend for roughly 5,000 years ~ which would have continued (owing to the Milankovitch orbital change) but for the modern strong warming from AGW. The LIA and Medieval Warm Period were only very slight alterations of the underlying cooling trend. But that long term cooling trend has been so gradual as to be invisible on the scale of a few decades or a few centuries.
Your "2030 speculation" is baseless. Even the idea of a possible Grand Solar Minimum is (if it were to occur) something that would be swamped by the ongoing warming effect of rising Greenhouse Gasses.
- With the En-ROADS climate simulator, you can build your own solutions to global warming
ilfark2 at 03:17 AM on 31 January, 2020Taxes are always convuluted, avoided, re-directed, sabotaged and distorted. "Serious Economist" is largely and oxymoron.
Many have shown elsewhere, Paris won't get us to 1.5, more likely will result in 3 by 2100. Likely articles are metioned on this very website.
They first few versions of any carbon tax in capitalist countries will rest heavily on the middle and lower classes. The argument that you can have a public trust that will be re-distributed is fantasy.
Even if, by some a-historic miracle you got a Citizens Climate Lobby like plan through, it would take years to be effective. Likely decades. Think of all the plant and equipment relying on fossil fuels. Unless the taxes are incredibly high, companies will continue to use that equipment for years. Ditto households.
If the taxes are high enough to force a quick change, companies would try to pass that on to customers, resulting in a supply side shock depression.
If taxes and markets were used to make the change in 1859, when Tyndall discovered the way molecules absorb infra red radiation, it might have worked.
The only way we'll substantially lower carbon output in a useful timeframe is either a WWII style mobilization, which means heavily controlled markets and means of production, or a complete replacement of capitalism and markets with a rational system of production and distribution.
Carbon taxes have no place or use in either scenario.
It's like saying, "alright, the Fascists might be coming across the ocean in a couple of years... let's raise taxes on consumer items in order to fund war production..."
- Ocean acidification isn't serious
Eclectic at 07:58 AM on 21 January, 2020Markoh , the answer is in the reply I gave you. Please read it again, particularly the second paragraph.
It is the combination of ocean chemistry status and the biological evolution of organisms to suit the status quo.
Buffering effects within the ocean, plus the ability of organisms to evolve protein structures that fit their environment. The calcite and aragonite forms of calcium are stabilized/supported by protein matrices, analogous to the way that protein matrices maintain the calcium crystals in your own teeth and bones.
Given enough time, organisms can produce remarkable evolutionary adaptations. Look at the chemistry of single-celled organisms that thrive on the deep surfaces of arctic/antarctic ice, at sub-zero temperatures (at which you yourself would be dead within the hour). At the other end of the scale, are thermophile organisms that thrive in hot springs ~ at temperatures where your own body proteins would be cooked (literally cooked . . . into a frizzle of damaged proteins).
Markoh, evolution takes time to get there. It's the rapid changes which are damaging to individual species and the total ecology of lifeforms.
- Ocean acidification isn't serious
Eclectic at 21:55 PM on 20 January, 2020Markoh @84 , read this thread's OP (both the basic and intermediate form) for some detailed information. You will also find much of interest in the subsequent comments.
The short answer is the combination of acidity & carbonate & bicarbonate balances, with the gradually-evolved capabilities of organisms to produce calcite and/or aragonite structures (bound in organic matrices that are properly suited to the conditions). The rapidity of change in modern ocean chemistry ~ is the big problem. The rapidity of change is outstripping the ability of organisms to evolve to meet the new circumstances. Some organisms do okay, some are adversely affected . . . and the whole ocean ecology worsens (in the "short term" of a few thousand years). It's not just the shell-forming creatures, but the huge pyramid of fish species etcetera resting on the calcium-users.
If you are thinking of purely relevance to humans, then the problem is that we have a huge population ~ and where many have a high proportion of marine diet for protein.
If I may quote from a NOAA fact sheet :-
"Ocean acidification is an often overlooked consequence of humankind's release of carbon dioxide emissions into the atmosphere from fossil fuel burning. Excess carbon dioxide enters the ocean and reacts with water to form carbonic acid, which decreases ocean pH ... and lowers carbonate ion concentrations. Organisms such as corals, clams, oysters, and some plankton use carbonate ions to create their shells and skeletons. Decreases in carbonate ion concentrations will make it difficult to form hard structures, particularly for juveniles. Ocean acidification may cause some organisms to die, reproduce less successfully, or leave an area. Other organisms such as seagrass and some plankton may do better in oceans affected by ocean acidification because they use carbon dioxide to photosynthesize, but do not require carbonate ions to survive. Ocean ecosystem diversity and ecosystem services may therefore change dramatically from ocean acidification."
[my bold]
The second problem : is that we don't yet have a firm idea of how bad it would all get, for humans as well as the ocean ecology. And as the saying goes ~ it would foolish to gamble big-time with Planet-A.
Markoh, I don't know whether you've see it, but there's an old movie "Soylent Green" [a mixture of very good and very "corny"] . . . classic Sci-Fi . . . set in the "near future" ~ grossly over-populated world, food shortages, major civil unrest, deteriorating farmlands (with armed guards). Suicide is almost a patriotic duty. In one of the final scenes, the hero learns a State Secret : the oceans are dying.
That concept was an over-dramatic fantasy, for a 1973 movie. But more worrying, today.
- I had an intense conversation at work today.
Doug_C at 10:04 AM on 15 January, 2020We see the current massive wildfire activity as associated with climate change because it is global in scale not local. And repeated.
Claiming there was an isolated wildfire season 50 or 70 years in a limited geographical local that was larger in scale therefore the current spate of massive wildfires is not an indication of a changing climate is rational white noise.
We don't just have the evidence of a changing Earth due to climate change from this global accelerated wildfire activity, we have all the other empirical evidence and all the theory learned over centuries to back it up. You just have to go through the volumous articles on this one site to totally refute claims that this vastly expanded wildfire activity in EurAsia, both Americas, Australia and other locations isn't linked to the very well support fact of how much heat we've added to the Earth mostly from burning fossil fuels.
Just scroll up and check the heat equivalent meter on this page based on solid science and explain how we can have added 2,828,000,000 and counting Hiroshima bomb heat equivalents to the Earth since 1998 alone and not profoundly altered the way that weather and climate operates on Earth. Especially since most of that heat is going into the oceans which are the weather and climate drivers of the planet as they contain most of the heat in the ocean/atmosphere system and move most of it around the planet with ocean currents.
This is happening, it's us and it's already devastating. Anyone living in Australia with the massive and deadly wildfires and a rapidly dying Great Barrier Reef should know this as well or better than anyone on the planet.
- 2019 in climate science: A continued warming trend and 'bleak' research
Cooper13 at 15:27 PM on 10 January, 2020@MA Rodger and @anticorncob6:
Rodger- you are correct; looking at 1975 to 2018, where the increases have become fairly linear (likely because of the continually increasing forcing with higher GhG concentrations), the trend is absolutely 2x.
We do need to be careful with cherry-picking a particular starting point, as that does alter the slopes somewhat. Choosing more like 50 years, 1968-2018 we get slopes of:
+0.17°C/decade (+0.31°F/decade) for Land AND Ocean (global)
+0.29°C/decade (+0.52°F/decade) for Land ONLY
So, 2x isn't all that bad a guess, really. Certainly the land-amplification (which is just an average - it's not the same everywhere) is somewhere between 1.5x and 2x of the global number. If you're a conservative farmer, concerned about your livelihood, I'd be going with the 2x assumption and acting accordingly (e.g. making your legislative representatives aware that you CARE about this and want action taken to minimize it)
Here are direct links to the page with those calculations, 1968-2019, as the pages will load with those selections saved:
So, my 'back of the napkin' guess in the first post may not be all that 'alarmist', the numbers indeed support it. Pass that along to people you encounter on this topic - perhaps SS will run a short post on this, as it's more about communicating the understanding than some magical revelation here. They will likely be able to cite sources which better clarify the background science, as well.
-Cheers
- Water vapor is the most powerful greenhouse gas
KR at 16:08 PM on 3 January, 2020pbezuk: Relative humidity over land has decreased, as predicted by the models; the slower cooling of the oceans has shifted some humidity to the waters. The specific humidity, the total amount of water in vapor form, has on the other hand increased again as predicted, with resulting increases in precipitation and flooding.
Your post is simply wrong.
- Byrne and Gorman 2018 - Relative humidity trends as per models
- Feng et al 2016 - Specific humidity trends and resulting rainfall changes
- How substances in trace amounts can cause large effects - Yes, it's CO2
- CO2 lags temperature
thejean at 09:42 AM on 13 December, 2019Hi Folks! Great site, learning Kt of CO2 info!
On this particular topic, I do have some questions regarding CO2 solubility. CO2 solubility decreases with increasing temperature, we all know that. We also know it's in equlibrium with the ocean and atmosphere. However, I can't find any solid data indicating the actual soluble CO2 levels in the ocean.
However, CO2 solubility is quite high and is above 300 ppm even at elevated temperatures. So, shouldn't our oceans be constantly absorbing CO2 and never truly be releasing it? I mean, a small temp rise would only release CO2 if we were at saturation (and I don't believe we are otherwise the pH of the ocean would be much lower). Also, once CO2 enters the ocean, it converts to carbonic acid and then bicarbonate (alkalinity). So, My understanding is that in order to release CO2 below saturation you decrease pH to convert bicarbonate to CO2 per the carbonate equilibrium.
I guess what I am trying to figure out is why the ocean would release CO2 when it's aqueous concentration is well below it's solubility limits for the temperatures we are looking at? I have modelled it and it seems I can easily get seawater to accept CO2 concentrations up to 1000 mg/L at ocean temps
This brings me to my next question which is why the oceans would offgas when the concentrations never exceed 300 ppm historically (within the timeframe that is being considered in the graphic at the top of this topic) and the delta T never increased more than 4degC?
Does anyone have a link to any good papers describing this in more detail with actual CO2 solubility charts and references to ocean pH and such? I have scoured the web and haven't found anything that I would be willing to take to the bank. I really want to understand better how this small temp rise would have been capable of releasing this much CO2 into the atmosphere) when most of this CO2 is almost immediately converted to bicarbonate and would require a substantial pH shift to drive it out of solution. I'm not syaing for a minute that this is not the case but clearly I am missing something and just want to learn...
- Skeptical Science New Research for Week #48, 2019
John Hartz at 08:46 AM on 7 December, 2019Doug @13: Here's the "About" statement posted on the website of MIT's Center for Global Change Science (CGCS). Note the final paragraph in particular:
The Center for Global Change Science (CGCS) at MIT was founded in January 1990 to address fundamental questions about the global environment with a multidisciplinary approach. In July 2006 the CGCS became an independent Center in the School of Science. The Center’s goal is to improve the ability to accurately predict changes in the global environment.
CGCS seeks to better understand the natural mechanisms in the ocean, atmosphere and land systems that together control the Earth’s climate, and to apply improved knowledge to problems of predicting global environmental change. The Center utilizes theory, observations, and numerical models to investigate environmental phenomena, the linkages among them, and their potential feedbacks in a changing climate.
The Center builds on existing programs of research and education in the Schools of Science and Engineering at MIT. The interdisciplinary organization fosters studies on topics as varied as, for example, oceanography, meteorology, hydrology, atmospheric chemistry, ecology, biogeochemical cycling, paleoclimatology, applied math, data assimilation, computer science, and satellite remote sensing.
CGCS sustains a program of discovery science with research on the natural processes in the global environment, concentrating on the circulations, cycles and interactions of water, air, energy, and nutrients in the Earth system.
Parallel CGCS activities incorporate the insight gained into climate prediction models, and climate policy analysis, with the aim of providing it in a useful way to decision-makers confronting the coupled challenges of future food, energy, water, climate and air pollution (among others). The CGCS also interacts with complementary MIT efforts in the Environmental Solutions Initiative, the Energy Initiative, and the Earth Resources Laboratory.
Given that cutting-edge research about carbon capture is occurring at MIT, you might want to nose around the CGS website to see if your question is being addressed.
- Video: Is CO2 actually dangerous?
nigelj at 06:33 AM on 7 December, 2019OPOF @, I do agree to the extent the middle grounds people need a bit of a shock or jolt. The tipping point paper does that nicely, but at least it is science based and makes it clear boiling oceans are just a possibility.
It's also interesting that the extinction rebellion people have resonated with the public in what looks like a largely positive way despite the scary and extreme name. I'm undermining my own argument a bit here, but I like to be open minded and not stubborn.
But mistakes, hype and exaggeration does annoy me. It's possibly because I did a couple of years in quality assurance, in a management role, and it cultivates a nit picking sceptical attitude. I make no apologies for that.
I think past a certain point exaggeration and stupid claims will have the reverse effect of whats intended. Ie self defeating. And while Manns claims are defensible, just, AOC was simply mistaken even if well intentioned and it undermines her many good contributions. The GND is definitely a big shock sort of policy, but that at least can be logically defended.
If people cry "fire" too often people eventually stop listening. But the tipping points research is the right sort of shock doctrine, because its evolving and has a good foundation.
Yes the slow steady kumbya style of the moderates is frustrating, but politics is politics. These people don't respond well when shouted at. They like to see evidence based reassoned argument, and not too much hype and emotional button pushing (like Trump does to people and it only really works well with his base).
- It's cosmic rays
Daniel Bailey at 06:22 AM on 4 December, 2019jmh530, the best available evidence we have is that there is no direct linkage between the sun’s output and cosmic rays impacting the Earth’s climate. Now that’s a broad statement, but let’s examine some more in-depth evidence on those individual components.
Scientists use a metric called Total Solar Irradiance (TSI) to measure the changes in output of the energy the Earth receives from the Sun. And TSI, as one would expect given the meaning behind its acronym, incorporates the 11-year solar cycle AND solar flares/storms.
The reality is, over the past 4 decades of significant global warming, the net energy forcing the Earth receives from the Sun had been negative. As in, the Earth should be cooling, not warming, if it was the Sun.
The scientists at CERN designed an experiment called CLOUD to evaluate the potential impacts of cosmic rays on clouds and cloud nucleation (Cloud Condensing Nuclei = CCN).
Per CLOUD director Kirkby:
"At the present time we can not say whether cosmic rays affect the climate."
Looking at the results of CLOUD, if cosmic rays were a significant factor in affecting our climate, the Earth should have been cooling, not warming. Instead 8 of the warmest 10 years have all occurred in the most recent 10 years.
Erlykin et al 2013 - A review of the relevance of the ‘CLOUD’ results and other recent observations to the possible effect of cosmic rays on the terrestrial climate
“The problem of the contribution of cosmic rays to climate change is a continuing one and one of importance. In principle, at least, the recent results from the CLOUD project at CERN provide information about the role of ionizing particles in ’sensitizing’ atmospheric aerosols which might, later, give rise to cloud droplets. Our analysis shows that, although important in cloud physics the results do not lead to the conclusion that cosmic rays affect atmospheric clouds significantly, at least if H2SO4 is the dominant source of aerosols in the atmosphere. An analysis of the very recent studies of stratospheric aerosol changes following a giant solar energetic particles event shows a similar negligible effect. Recent measurements of the cosmic ray intensity show that a former decrease with time has been reversed. Thus, even if cosmic rays enhanced cloud production, there would be a small global cooling, not warming.”
Modern CCN are pretty much insensitive to cosmic rays and changes in TSI from the Sun, compared to the very much larger anthropgenic and natural contributions (volcanoes, oceanic oscillations and wildfires):
"New particle formation in the atmosphere is the process by which gas molecules collide and stick together to form atmospheric aerosol particles. Aerosols act as seeds for cloud droplets, so the concentration of aerosols in the atmosphere affects the properties of clouds. It is important to understand how aerosols affect clouds because they reflect a lot of incoming solar radiation away from Earth's surface, so changes in cloud properties can affect the climate.
Before the Industrial Revolution, aerosol concentrations were significantly lower than they are today. In this article, we show using global model simulations that new particle formation was a more important mechanism for aerosol production than it is now. We also study the importance of gases emitted by vegetation, and of atmospheric ions made by radon gas or cosmic rays, in preindustrial aerosol formation.
We find that the contribution of ions and vegetation to new particle formation was also greater in the preindustrial period than it is today.
However, the effect on particle formation of variations in ion concentration due to changes in the intensity of cosmic rays reaching Earth was small."
And
"...solar cycle variations of ion concentration lead to a maximum 1% variation of CCN0.2% concentrations. This is insignificant on an 11 year timescale compared with fluctuations due to, for example, the El Nino-Southern Oscillation, variations in wildfires, or volcanoes."
Gordon et al 2017 - Causes and importance of new particle formation in the present-day and preindustrial atmospheres
And the coup de grace for cosmic rays, being proven to unable to significantly affect clouds and climate, is that CCN respond too weakly to changes in Galactic Cosmic Rays to yield a significant influence on clouds and climate.
Pierce 2017 - Cosmic rays, aerosols, clouds, and climate: Recent findings from the CLOUD experiment
Scientist Richard Alley pretty much killed the cosmic ray hypothesis here (the relevant part of the lecture starts at 42:00)
"We had a big cosmic ray signal, and the climate ignores it. And it is just about that simple! These cosmic rays didn’t do enough that you can see it, so it’s a fine-tuning knob at best."
To recap, the Laschamp excursion (the strongest cosmic ray event in the past 40,000 years) hammered climate for 2,550 years about 40,000 years ago. The flux of beryllium-10 produced by cosmic rays greatly increased as the Earth’s magnetic field weakened by 90%.
Here is the chart he’s referring to, showing how the flux of beryllium-10 produced by cosmic rays greatly increased as the Earth’s magnetic field weakened by 90% about 40,000 years ago.

From the AR5, WG1, Chapter 7, p. 573:
"Cosmic rays enhance new particle formation in the free troposphere, but the effect on the concentration of cloud condensation nuclei is too weak to have any detectable climatic influence during a solar cycle or over the last century (medium evidence, high agreement). No robust association between changes in cosmic rays and cloudiness has been identified. In the event that such an association existed, a mechanism other than cosmic ray-induced nucleation of new aerosol particles would be needed to explain it. {7.4.6}"
- It's the sun
Wibblefish at 22:30 PM on 27 November, 2019Reading though the comments, there are mentions of the cooling/warming effects of El Nina/Nino. Looking at this from a marine biologist perspective, I'd like to bring up the effects of climate change on tropical coral, particulary in the indian ocean and south pacific and how examining coral biodiversity records could be used to support AGW. Coral live between a fairly narrow temperature range. Extreme rises in temperature lead to bleaching and usually coincide with el nino events where vast bodies of warmer become trapped in the indian ocean and southern pacific. What we are seeing is a decline in biodiversity and massive bleaching events in the last 30 years, notable events in 1998, 2005 and 2017. Studying in the Maldives, there was evidence of coral recovery but ONLY for a few species compared to what can be found in historical records. Then the whole system got hit again in 2017 so back to square 1. To me, it is apparent that such a delicate ecosystem can be thriving for thousands of years and then hammered by prolonged, frequent, intense el nino events in a short space of time is a smoking gun. The reversal of trade winds seems to hinge on a delicate energetic balance in the atmosphere. I don't know why it's difficult to comprehend that insulating energy would change the dynamics of a system.
- SkS Analogy 20 - The Tides of Earth
Alan Lowey at 14:54 PM on 10 November, 2019The Moon orbits in the same direction as the Earth rotates, prograde. Because the Earth rotates at a faster rate than the Moon's orbit, the tidal bulge appears to be ahead.
I'm saying that if the Earth didn't rotate, the Moon would be ahead of the tidal bulge.
The image I have in my head is a strong gravitational interaction between the innermost cores of the two bodies. In this scenario, there is a delay for the initial inner bulge to reach the surface.
Because every single schoolchild is taught that "the Moon pulls on the oceans" it's extremely difficult for the average person to comprehend any alternative explanation.
Incidentally, in a book about the science within the Koran, they say that the tides are "Waves upon Waves upon Waves". This just happens to fit the alternative suggestion I'm trying to explain.
- SkS Analogy 20 - The Tides of Earth
Alan Lowey at 04:04 AM on 9 November, 2019I can't stand sloppy unscientific sentences such as "The sun and moon pull on the oceans" as described in the beginning of this topic. They do NOT! It's their gravitational interaction across the entire body of Mother Earth which changes the shape of the planet. It's this bulge which flexes the lithosphere. The bulge of the ocean floor pushes the ocean from beneath to create our daily tides. The person who wrote the intro doesn't understand the very basic nature of how our tides work.
- It's a 1500 year cycle
Alan Lowey at 20:28 PM on 7 November, 2019I'm NOT a climate change denier NOR an AGW denier but wish to express the logical conclusion that BOTH the 1470-year cycle AND man-made greenhouse gas emissions could be the drivers of modern era warming. I take Prof Brian Cox's point of view : The Issue With Climate Change, South China Morning Post, 23rd May 2019. He talks about the framework of science being our best understanding of how the world works. The quantitative amount of energy from gravity via the coriolis effect and via the Moon's gravitational interaction across the entire planet's body giving rise to the enormous power of ocean tides dissipating heat from the equator to the higher latitudes, is much greater than solar radiance combined with AGW. Why are these two driving forces of our climate not quantively compared? Why is gravity missing from the Global Warming Debate?
I'd be surprised if there's a single scientist in the IPCC that actually knows the ocean tides move due to the flexing of the Earth's lithosphere. The oceans move due to being pushed from the ocean floor. Nobody is measuring the mid-ocean to see whether deep ocean tidal mixing is making it cooler, for example.
People like Prof Brian Cox should also inform the public that gravity itself is under scrutiny within the physics community and that it's possible for new physics to have a major bearing on future climate modeling.
- A small electric plane demonstrates promise, obstacles of climate-friendly air travel
Rob Honeycutt at 05:37 AM on 25 October, 2019I keep thinking there should be an attempt to create a rocket assist system to enable electric aircraft to achieve greater range. Rockets can efficiently use oxygen/hydrogen mix without producing carbon emissions.
The initial climb to cruising altitude is the phase of flight that requires the most energy. If you could build a carrier system similar to what Scaled Composites used to put their small manned craft into space, perhaps that—as a rocket propelled carrier—could carry an electric aircraft up to a high cruise altitute from which to initiate the flight. The carrier craft would then fly back to the airport to refueled for the next flight.
My other recent thoughts on the future of electric aviation is that, perhaps people need to get used to slower, more relaxing flights for long trips. If you could create an electric aircraft design that could make a transoceanic flight with an assist to cruise, slower flights might be what make that feasible. The economics of electric flight hold such a large advantage that it may be cost effective to give customers business-class style cabins and expect normal 12 hr flights to last 20 hrs instead. The additional 8 hrs could be very tolerable in a comfortable setting.
Additional note: electric motors offer some clear advantages over fuel-based engines since both ICE and turnbines require air for combustion. At higher altitudes a great deal of additional energy is used to accelerate air into a chamber for combustion. There are efficiency losses for electric motors as well, but I believe it's limited to accelerating air for propulsion rather than propulsion and combustion.
- Tipping Points: Could the climate collapse?
ilfark2 at 00:10 AM on 22 October, 2019One should mention Richard Alley's work on abrupt climate change. Also note the above linked PNAS (from 2007 it looks like) mentions:
“the qualitative change would appear beyond this millennium (e.g.,marinemethanehydrates...”
but we're already possibly seeing more methane from the arctic as well as other parts of the ocean;
they also mention permafrost likely being gradual (though they say <100 yrs)
and of course it's easy to find many journal articles documenting how much faster various things are occurring than expected
it seems clear, they don't know and won't be scientifically certain until it's likely too late (if it's not already too late... which they don't seem sure of either)
point being, the idea of scientific methodical certainty is and has been misplaced in some senses... there were clarion calls in the nineteenth century by Darwin and other natural scientists, not about global warming per se, but that if we continued down the industrial (coal burning, forest clearing) path, we'd end the habitable world...
what was their proof that the world wasn't big enough to handle humans' collective assault? nothing that would pass a sort of vigorous lab experimental approach, rather "look at what has been left..."
critics of course said the earth would regerate after clear cutting and could handle the smoke from the coal (arrhenius pointed out the CO2 would warm the earth, but being a chemist, and not understanding ecology in any way, assumed more warmth would be good)...
so here we are again... no, we can't say when and how much methane will be released from the oceans... so far, in the warmer regions, various organisms intercept it, but a few places these have been overwhelmed... sure the yaley climate connection says don't worry about methane release since it would take the shallow arctic oceans warming by, i forget, 5 to 7 C for them to be released... yet we've seen unprecented warm pacific water incursion into the arctic this summer...
so how long do we have until the permafrost, marine methane and other feedbacks occur? it seems we don't know, and won't know for a while
so, we're driving 80 mph (sorry i'm amurican) in fog on a plain... someone radios there's a cliff ahead, though they aren't sure how far or how large the drop is
time for at least a WWII mobilization, better a reorganization of society along democratic lines (e.g., Free Catalonia of the 1930s).
- Water vapor is the most powerful greenhouse gas
Eclectic at 22:59 PM on 11 October, 2019JamesKL , the answer is more complex, because there are different cases.
For the classic "hot desert" (e.g. the Sahara, near the Tropic of Cancer) then it's true that the adjacent equatorial forests have a higher temperature at night. During the daytime, the forests are cooler ~ presumably from the evaporative cooling effect ~ but I stand to be corrected if you have some good official data saying otherwise. Since the air temperature is measured at 200cm altitude, you get variation according to shading from the forest canopy versus open areas of (moist) grasses/shrubs. But then we get to the question of day/night averaging & how often in 24 hours the temperature is measured for calculating the average. And seasonal or summer vs winter average temperatures for desert/forest.
Then there's the case of a "cold desert" (e.g. the Gobi in Mongolia) compared with adjacent coastal forests having much higher rainfall. The Gobi is indeed cold at night, and the coastal forests warmer. But during the daytime . . . do you have any official temperature figures? I could imagine if you scouted around, you could find some contradictory desert vs forest (or grassland) cases.
Difficult enough to find nicely matched cases, of similar latitude / altitude / ocean proximity / or exposure to prevailing or seasonal winds & rainfall. (Monsoonal rain, or annually well-distributed rain.)
To boil your question down, and over-simplify : you have to balance daytime evaporation in well-vegetated areas, versus nighttime cooling in dry (deserty) low-humidity areas. So I am not giving a black-and-white answer to your original question ~ but I hope you can take consideration of the underlying physical principles involved.
- How the Greenland ice sheet fared in 2019
sgbotsford at 00:57 AM on 11 October, 2019@william In #6:
You could also get increased snow too however. Some years ago, there was a pre-computer model of ice age triggering that was based on an open arctic ocean.
* Increased evaporation led to increased snow fall on surrounding land.* Ungava penninsula has later springs and earlier falls.
* Increased albedo makes Ungava area cooler.
* Two randomly cooler summers in a row result in not all the snow melting.
* Because ground is pre chilled, snowfall accumulates faster.
* Cold air moving from the snowfield to surrounding area prepares that area for snow pack.
At the time they figured a permanent snowfield could advance at about 200 km per year.
No idea if this notion is still credible.
But: An arctic ocean will evaporate whenever it's open — slower winter, as I assume at least pan ice will form. But if the arctic is open while greenland is still 2 miles thick (and high) then soggy arctic air will cool and drop lots of snow.
If the latent heat comes from the formation of dew/frost, then your figures are correct. But it may form in the air, which means it's heat that ends up being radiated to space, no? If it comes down as snow, it melts nothing. If it comes down as rain, it melts some ice depending on the rain temperature.
- Skeptical Science New Research for Week #40, 2019
nigelj at 19:19 PM on 10 October, 2019Postkey @18, while it's fair comment that mineral reserves are of course limited, the numbers you quote on mineral reserves do not describe the complete picture, and they vastly underestimate reserves. The information you quote is based on known land based reserves of these materials at current prices and current quantities extracted.
It's almost 100% certain more discoveries will be made, and there are many more known reserves that are not currently economic to extract, and the data you quote omits billions of tons of each of these metals dissolved in sea water (and several have already been extracted in experimental operations at reasonable cost).
We are not going to run out of metals this century or next century, even at higher use rates than presently, and of course metals can be recycled almost forever. There are enough minerals for solar and wind power and electric vehicles etcetera and other applications. List of some of the minerals in sea water and their concentrations.
"Altogether, there are some 50 quadrillion tons (that is, 50 000 000 000 000 000 t) of minerals and metals dissolved in all the world’s seas and oceans. To take just uranium, it is estimated that the world’s oceans contain 4.5-billion tons of the energy metal."
Of course we have to be sure not to waste resources and to get population growth rates down, but population growth is falling in many places anyway.
- Wind energy is a key climate change solution
FalseProgress at 08:05 AM on 18 September, 2019The wind power issue has taught me that purist environmentalists (protecting nature intrinsically) are far rarer than I assumed (maybe 5% vs. 15% as a guess). Today's environmentalism seeks to sustain modern life with sprawling forms of non-dense energy, and nature's physical grandeur is the big sacrifice. There's also a refusal to admit that energy gains and CO2-reduction are very weak in terms of vast acreage needed to create them. I call it Blight for Naught.
Today's "environmentalists" have decided (for everyone else) that scenery no longer matters. They have to know it's being destroyed, but post deceptive photos ("Oh yuck, look......a wind turbine" - never a whole ridge ruined by them) as they claim to illustrate new vs. old scars. They also won't admit that wind turbines only add to visible damage, formerly the domain of fossil fuel extraction, mining, logging, etc. (plenty of logging is done for mountaintop wind). Nothing is being improved in terms of natural aesthetics. We just see more machines, less nature, and corporate lingo like "installed capacity" to describe ruined scenery.
Here's a far more accurate view of wind energy sprawl: mountaintop desecration, ocean views lost, roads & construction
The total human footprint has grown enormously since the late 1990s when Big Wind took off. There are now over 355,000 wind turbines on the planet, and Mark Jacobson & Co. would like to see over 10 times that many, which radically increases today's "acceptable" bird & bat carnage.
The topic of dying bats is dodged several times in these comments, and the species of birds killed by wind turbines isn't the same as what cats take out, but we're told it can never matter because we've got to coddle this thing called "civilization" at any cost. Big Wind supporters have merely sold out to a new industry and gravy train. That's all I ask them to admit at this point.
- Climate denier scientists think these 5 arguments will persuade EU and UN leaders
nigelj at 07:05 AM on 13 September, 2019One thing that stands out in the denialists letter is they hammer their 'claim' that natural cycles are behind the recent warming trend, and the letter does it in several different ways, for exampe in the first two points they make. Imho this is their key lever for creating doubt used throughout the denialosphere because if they can convince the public "something else is responsible" (or could be responsible), they dont need other arguments too much. It's using a scapegoat just as certain politicians do on various other matters. Therefore its really important to shoot down this argument and make it the number one priority.
In that respect the response made in the article is good, but rather wordy and rhetorical. If we challenge the denialists, its important to get the message across very succinctly and clearly that scientists have looked in extreme depth at all the natural cimate cycles, such as sunspots and ocean cycles and they have been in neutral or cooling phases for the past 50 years so cannot adequately explain the warming trend, while the increasing greenhouse effect does.
- Sea level rise is exaggerated
Daniel Bailey at 00:43 AM on 10 September, 2019As MA sagely notes, Chen 2014 is dated and newer studies with later data show an acceleration in SLR and with the mass component also increasing.
Per Yi et al 2017 - Acceleration in the Global Mean Sea Level Rise: 2005–2015:
"Global mean sea level rise has been accelerating for more than 100 years, and the acceleration in the last two decades seems to further increase"
And
"Our results show that the acceleration during the last decade (0.27 ± 0.17 mm/yr2 ) is about 3 times faster than its value during 1993–2014. The acceleration comes from three factors, that is, 0.04 ± 0.01 mm/yr2 (~15%) by land ice melting, 0.12 ± 0.06 mm/yr2 (~44%) by thermal expansion of the seawater, and 0.11 ± 0.02 mm/yr2 (~41%) by declining land water storage."
And
"we demonstrate that current advances in satellite gravimetry, and marine in situ measurements enable us to detect the acceleration in global sea level rise from 2005 to 2015, 11 years in total"
Other studies:
Cazenave et al 2018 - Global Sea Level Budget 1993–Present
"Ocean thermal expansion, glaciers, Greenland and Antarctica contribute by 42%, 21%, 15% and 8% to the global mean sea level over the 1993-present. We also study the sea level budget over 2005-present, using GRACE-based ocean mass estimates instead of sum of individual mass components. Results show closure of the sea level budget within 0.3 mm/yr. Substantial uncertainty remains for the land water storage component, as shown in examining individual mass contributions to sea level."
"Most recent studies (e.g., Dieng et al., 2017a, Ablain and Jugier, 2017b, Chen et al., 2017a, Chen et al., 2017b, Nerem et al., 2018b, WCRP, 2018) show that the GMSL is accelerating, and that this acceleration mostly arises from accelerated Greenland and Antarctica ice mass loss."
SLR Components, p. 1645, Figure 3:

Other salient studies:
- Dieng et al 2017 - New estimate of the current rate of sea level rise from a sea level budget approach
- Ablain and Jugier 2017
- Chen et al 2017a - The increasing rate of global mean sea-level rise during 1993–2014
- Chen et al 2017b - Groundwater Storage Changes: Present Status from GRACE Observations
On 2018 sea level rise acceleration:
"Global sea level rise is not cruising along at a steady 3 mm per year, it's accelerating a little every year, like a driver merging onto a highway, according to a powerful new assessment led by CIRES Fellow Steve Nerem. He and his colleagues harnessed 25 years of satellite data to calculate that the rate is increasing by about 0.08 mm/year every year—which could mean an annual rate of sea level rise of 10 mm/year, or even more, by 2100.
"This acceleration, driven mainly by accelerated melting in Greenland and Antarctica, has the potential to double the total sea level rise by 2100 as compared to projections that assume a constant rate—to more than 60 cm instead of about 30." said Nerem, who is also a professor of Aerospace Engineering Sciences at the University of Colorado Boulder. "And this is almost certainly a conservative estimate," he added. "Our extrapolation assumes that sea level continues to change in the future as it has over the last 25 years. Given the large changes we are seeing in the ice sheets today, that's not likely."
Also per Nerem et al 2018:
"the observed acceleration will more than double the amount of sea-level rise by 2100 compared with the current rate of sea-level rise continuing unchanged. This projection of future sea-level rise is based only on the satellite-observed changes over the last 25 y, assuming that sea level changes similarly in the future. If sea level begins changing more rapidly, for example due to rapid changes in ice sheet dynamics, then this simple extrapolation will likely represent a conservative lower bound on future sea-level change."

- The North Atlantic ocean current, which warms northern Europe, may be slowing
Human 2932847 at 18:01 PM on 4 September, 2019This Scientific American summary goes into the debate over Seager's stuff. It's from 2013 and so has it been superceded ? It says -
"recent modeling studies with higher resolution of ocean currents suggest that fresh Arctic meltwater may pour mostly into currents that are more restricted to the coastlines and there-fore have less influence on the open ocean, where downwelling primarily occurs. Even if freshwater significantly affected the amount of waters downwelled in the North Atlantic, it turns out to be highly unlikely that this change would effectively shut down the Gulf Stream. A shutdown is unlikely because the path and the strength of the Gulf Stream depend largely on the speed and direction of the large-scale midlatitude winds."
Which doesn't sound like much of a threat.
What would be a good source for the latest theories about the Gulf Stream, AMOC etc where these questions are more settled ?
- Residence Time and Prof Essenhigh
daveburton at 21:52 PM on 25 August, 2019Eclectic wrote, "your heated-wire analogy is even wider of the mark..."
It is just a simple example illustrating a general principle. It's how negative feedback systems work. If the removal rate increases with system output level, that's a negative feedback mechanism. A constant forcing input will then result in a plateau at "equilibrium," where the negative feedback has caught up with the constant input.
That's true when the input forcing is energy added to your toaster via electricity, and the negative feedback mechanism is radiative & convective heat loss from a nichrome wire.
It's also true when the input forcing is CO2 added to the atmosphere, and the negative feedback is CO2 removal from the atmosphere via dissolution in the oceans and terrestrial plant uptake.
The principle is true regardless of whether the negative feedback is linear or nonlinear. For the nichrome wire example, there are actually three significant negative feedbacks, all with different transfer functions: radiative heat loss goes up in proportion to the 4th power of the temperature relative to 0K, convective heat loss goes up in approximate proportion to the temperature difference between the wire and ambient air, and the resistance of the wire also goes up with temperature. The fact that all three have different-shaped transfer functions doesn't affect the conclusion: because they are negative feedbacks, a constant input (forcing) must result in a plateuing output, gradually approaching equilibrium.
Eclectic continued, "The design of the Simple Model fits at best tangentially with physical reality."
It fits extremely well for the period for which we have accurate measurements:
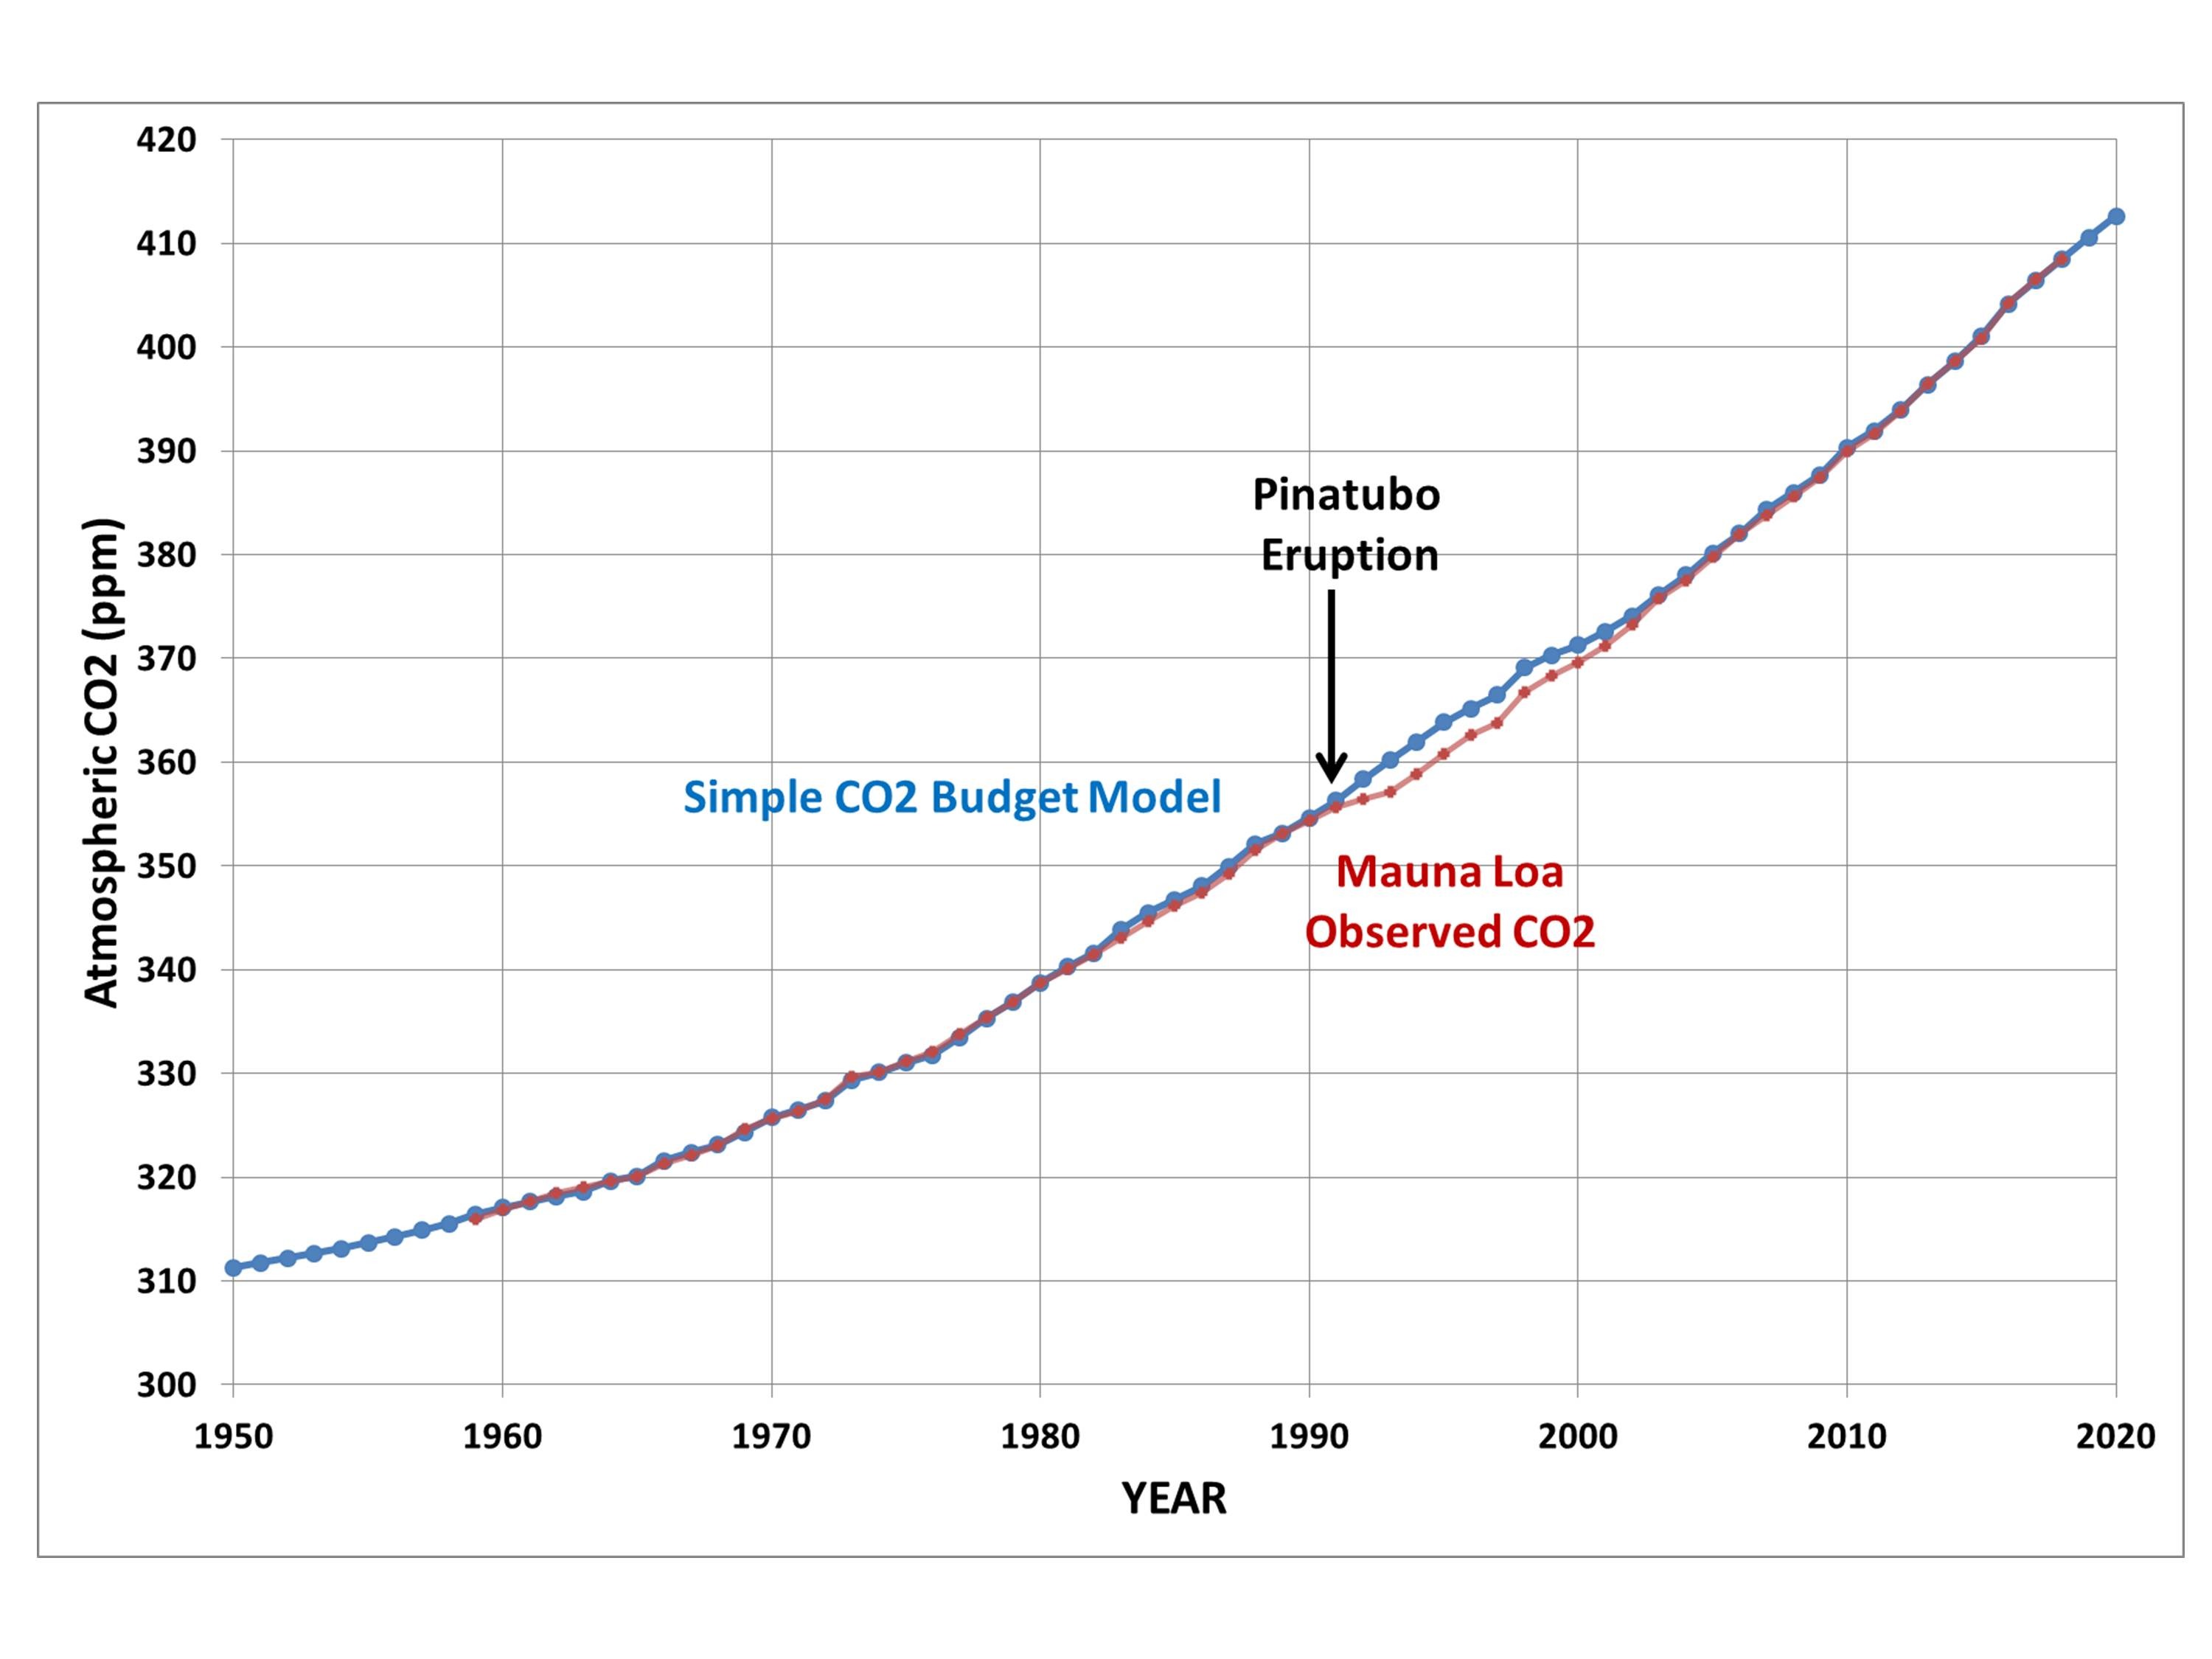
Eclectic continued, "nor do we have the luxury of time to sit back and observe another 40 years or so, as the Simple Model diverges from the (complex) real world."
Well, I obviously don't, at my age.
But mankind does have that luxury, and you should not expect Roy's Simple Model to diverge much from reality over the next 40 years. It is the "long, fat tail" (due to increased carbon levels in non-atmospheric reservoirs) which is not modeled by the Simple Model. Regardless of what happens with CO2 emission rates, CO2 removal over the next 40 years will be dominated by the removal mechanisms which the Simple Model models well.Eclectic continued, "the paleo evidence demonstrates the falsity of Spencer's too-simple Simple Model."
All models are false, but some are useful. Roy's Simple Model is very useful. It is a very good fit to measured reality, and it will continue to be a good fit as long as the CO2 removal mechanisms which are currently most important continue to be most important. When CO2 levels drop below 300 ppmv, and the accumulation of anthropogenic carbon in non-atmospheric reservoirs becomes an important factor affecting atmospheric CO2 levels, then his Simple Model will diverge from reality.
MA Roger wrote, "Yes, the oceans are big. Yes, the oceans contain contain sixty-times the carbon found in the pre-industrian atmosphere (which was in full equilibrium with the oceans). But what has that got to do with your "fact"?"
Mankind has increased CO2 level in the atmosphere by about 47%. We've increased carbon content in the oceans by only about 0.4%.
So, why does that matter? Because it is that accumulation of carbon in non-atmospheric reservoirs that is not modeled by Roy's Simple Model. In other words, his Simple Model assumes the other carbon reservoirs have infinite capacity.
That's a pretty good simplifying assumption, as long as the anthropogenic increase in atmospheric CO2 dwarfs the anthropogenic increase in carbon in other reservoirs. It will diverge from approximating reality during the "long, fat tail," when the anthropogenic increment in atmospheric carbon dioxide no longer dwarfs the anthropogenic increase in carbon in other reservoirs.
MA Roger wrote, "it is very odd that they would ever allow atmospheric levels to remain constant while the ocean absorbed a large constant flux of dissolving CO2."
Atmospheric levels will remain constant when transfer of carbon to the oceans and other carbon reservoirs removes CO2 from tha air as quickly as anthropogenic emissions are adding it. (They're currently removing it only about half as fast as we're adding it.)
MA Roger asked, "Have you actually examined the workings of Spencer's model?"
Of course.
MA Roger wrote, "If you set the future anthropogenic emissions to a fixed value... atmospheric CO2 levels tend to a constant value"
Which is, of course, correct.
MA Roger wrote, "while negative emissions, suck out 15Gt(C)/yr and by AD2191 the atmosphere is entirely denuded of CO2. daveburton, doesn't that strike you as "very odd"?"
Not at all. If you start with a physically impossible assumption, you get a physically impossible result. The only thing I can think of which could possibly remove a net 15 GtC/year from the atmosphere when CO2 levels are below 300 ppmv, is some idiot genetically engineering a fast-growing, fast-propagating C4 tree.
Please don't do that! The Earth doesn't need another K-T Extinction! - Residence Time and Prof Essenhigh
daveburton at 00:54 AM on 24 August, 2019Eclectic wrote, " ...the 500ppm figure that the model indicates cannot be exceeded under Dr Spencer's stated conditions of artificiality."
Dr. Spencer's simple model does not say that 500 ppmv can never be exceeded under any circumstances. But if emissions are held steady at 10 Gt/year, atmospheric CO2 level will level-off at just shy of 500 ppmv.
That should not surprise you. It is a natural result of the historically-verified fact that when CO2 levels go up, so do CO2 removal rates. That simple fact, alone, even without reference to a particular quantified model, ensures that a constant CO2 emission rate must result in a plateau in CO2 level.
Do you have an electric stove or toaster? Even though you keep pumping electricity into the nichrome wires, the temperature levels off, and ceases to rise. That's simply because the rate of energy loss rises with the temperature. So the temperature plateaus as it approaches equilibrium: the level where incoming and outgoing energy flows are balanced.
Since the rate of CO2 loss from the atmosphere rises with the CO2 level, the CO2 level must plateau, as it approaches the level at which the flows of CO2 into and out of the atmosphere are the same.MA Rodger wrote, "This is plainly nonsense. Where does all this extra carbon accumulate?"
It's not nonsense, it's fact.
The extra carbon migrates to other reservoirs, like the oceans (the biggest), soil, marine sediments, etc. Those reservoirs dwarf the amount of CO2 in the atmosphere, and, importantly, dwarf the amount of carbon available in recoverable fossil fuels.
MA Rodger wrote, "if humanity restricts itself to pumping 10Gt(C)/year ... continuing year-after-year for ever-&-ever-&-ever..."
Fossil fuels are a finite resource. So we obviously will not (cannot!) continue to emit 10 GtC/yr from fossil fuels "for ever and ever."
Have you never wondered why most people assume CO2 levels won't ever exceed 600-800 ppmv? It's because for CO2 levels to continue to rise at their current rate, CO2 emissions must continue to accelerate — and resource constraints ensure that that can't continue forever. So the rise in CO2 levels must taper off.
What's more, even if CO2 emissions accelerate fast enough to maintain the current growth rate in atmospheric CO2 level, that would mean CO2's climate forcing trend will fall below linear. Since the warming effect of CO2 is logarithmically diminishing, in order to maintain a linearly increasing temperature forcing from CO2, the growth rate of CO2 levels in the atmosphere must increase approximately exponentially.
That is, in fact, what has happened, for the last forty years or so. CO2 emissions have increased so dramatically that CO2 levels have increased on an approximately exponential curve, so the temperature forcing from rising CO2 levels has increased at an approximately linear rate (actually slightly more than linear). You can see that in a graph of log(CO2). Notice how straight the graph is for the last forty years:
https://www.sealevel.info/co2.html?co2scale=2
- Residence Time and Prof Essenhigh
daveburton at 10:31 AM on 23 August, 2019Trying again, with explicit line-breaks added...
Mr. Moderator, I meant no offense, but I'm not aware of any comment policy that I violated, and I do not understand why you deleted so much of my comment.
MA Rodger, here's where the "about fifty year" practical residence/adjustment time comes from. Well, actually, a number of scientists have independently calculated approximately the same figure, but this is how I did it.
Start with the observation that the rate at which natural systems (oceans & terrestrial biosphere, mainly) remove CO2 from the air is governed chiefly by the CO2 level in the air. When the CO2 level is higher, so is the removal rate. When the CO2 level is lower, so is the removal rate.
Some people think the removal rate is governed by the emission rate, and that it's necessarily "about half" (leaving an "airborne fraction" which is also about half). They are mistaken. There is no physical mechanism by which any of the major contributors to the removal rate could be governed by the emission rate. It is the CO2 level, not the CO2 emission rate, which primarily governs the removal rate.
For the oceans, the removal mechanism is dissolution into surface water per Henry's Law, and then then transport to the ocean depths by currents and calcifying coccolithophores, and complex chemistry which is beyond my ken.
For the terrestrial biosphere it is "greening."
AR5 estimates that the terrestrial biosphere removes about (2.5/9.2) = 27% [p. 6-3] or 29% [Fig 6.1] of anthropogenic CO2 emissions from the atmosphere, each year, and that the oceans remove another 26% [Fig 6.1]. (There are wide error bars on those numbers, but the ≈55% sum has narrower error bars than the two addends have.)
Of course, other things also affect the CO2 removal rate, as is obvious, for example, from the detectable effect of very large volcanic erruptions on measured CO2 levels. But the most important factor governing the CO2 removal rate from the atmosphere is clearly the CO2 level in the atmosphere.
Those numbers are known, with fair precision. For the last sixty years we have very good records of both atmospheric CO2 levels and production/use rates of fossil fuels & cement (from which can quantify the main sources of anthropogenic CO2 emissions).
From those data we can calculate how much CO2 was removed from the atmosphere by natural sinks (oceans, biosphere, etc.), each year.
Since we also know the atmospheric CO2 level each year, we can easily build a spreadsheet, and fit a curve, showing the approximate net rate of CO2 removal as a function of the CO2 level.
Dr. Roy Spencer did that, and found it is very closely approximated by a very simple function, which you can read about here:
http://www.drroyspencer.com/2019/04/a-simple-model-of-the-atmospheric-co2-budget/
Using Dr. Spencer's "simple model," I wrote a tiny Perl program to simulate the effect on atmospheric CO2 level of a sudden cutoff of CO2 emissions. Counting 280 ppmv as "pre-industrial," 63% of the anthropogenic CO2 is gone from the atmosphere in 54 years, and 2/3 is gone in 60 years:#!/usr/bin/perl
# estimate CO2 removal rate in ppmv/yr as a function of CO2 level in ppmv,
# per Dr. Roy Spencer's "simple model"
# ref: http://www.drroyspencer.com/2019/04/a-simple-model-
# of-the-atmospheric-co2-budget/
sub removal_rate {
local($co2level) = shift;
local($removalrate) = 0;
local($co2elevation) = $co2level - 295.1;
local($ratio) = 47.73;
if ($co2level <= 295.1) {
$removalrate = 0;
} else {
$removalrate = $co2elevation * 0.0233;
}
return $removalrate;
}
# SIMULATE DECLINE IN CO2 LEVEL IF EMISSIONS SUDDENLY WENT TO ZERO
$co2level = 410;
$year = 2019;
print "Simulated CO2 level decline, with level starting at
$co2level ppmv in $year, and zero emissions:\n";
while ($co2level > 300) {
printf("$year %5.1f\n", $co2level);
$year += 1;
$removalrate = &removal_rate( $co2level );
$co2level -= $removalrate;
}
Here's the result of a simulation run, with CO2 starting at 410 ppmv in 2019, and zero emissions:
2019 410.0
2020 407.3
2021 404.7
2022 402.2
2023 399.7
2024 397.2
2025 394.8
2026 392.5
2027 390.3
2028 388.0
2029 385.9
2030 383.8
2031 381.7
2032 379.7
2033 377.7
2034 375.8
2035 373.9
2036 372.1
2037 370.3
2038 368.5
2039 366.8
2040 365.1
2041 363.5
2042 361.9
2043 360.4
2044 358.8
2045 357.3
2046 355.9
2047 354.5
2048 353.1
2049 351.7
2050 350.4
2051 349.1
2052 347.9
2053 346.6
2054 345.4
2055 344.3
2056 343.1
2057 342.0
2058 340.9
2059 339.8
2060 338.8
2061 337.8
2062 336.8
2063 335.8
2064 334.9
2065 333.9
2066 333.0
2067 332.2
2068 331.3
2069 330.4
2070 329.6
2071 328.8
2072 328.0
2073 327.3 <== residence/adjustment time (e-folding time) = 54 years (using 280 ppmv as base)
2074 326.5
2075 325.8
2076 325.1
2077 324.4
2078 323.7
2079 323.0 <== two-thirds of the anthropogenic CO2 is gone in 60 years (using 280 ppmv as base)Of course we know that this simple model would not accurately model the "long, fat tail," with CO2 levels under 300 ppmv. But the point I made previously is that, for practical purposes, that doesn't matter, because we all know that CO2 levels that low are harmless.
More than 100 comments found. Only the most recent 100 have been displayed.
More than 100 comments found. Only the most recent 100 have been displayed.


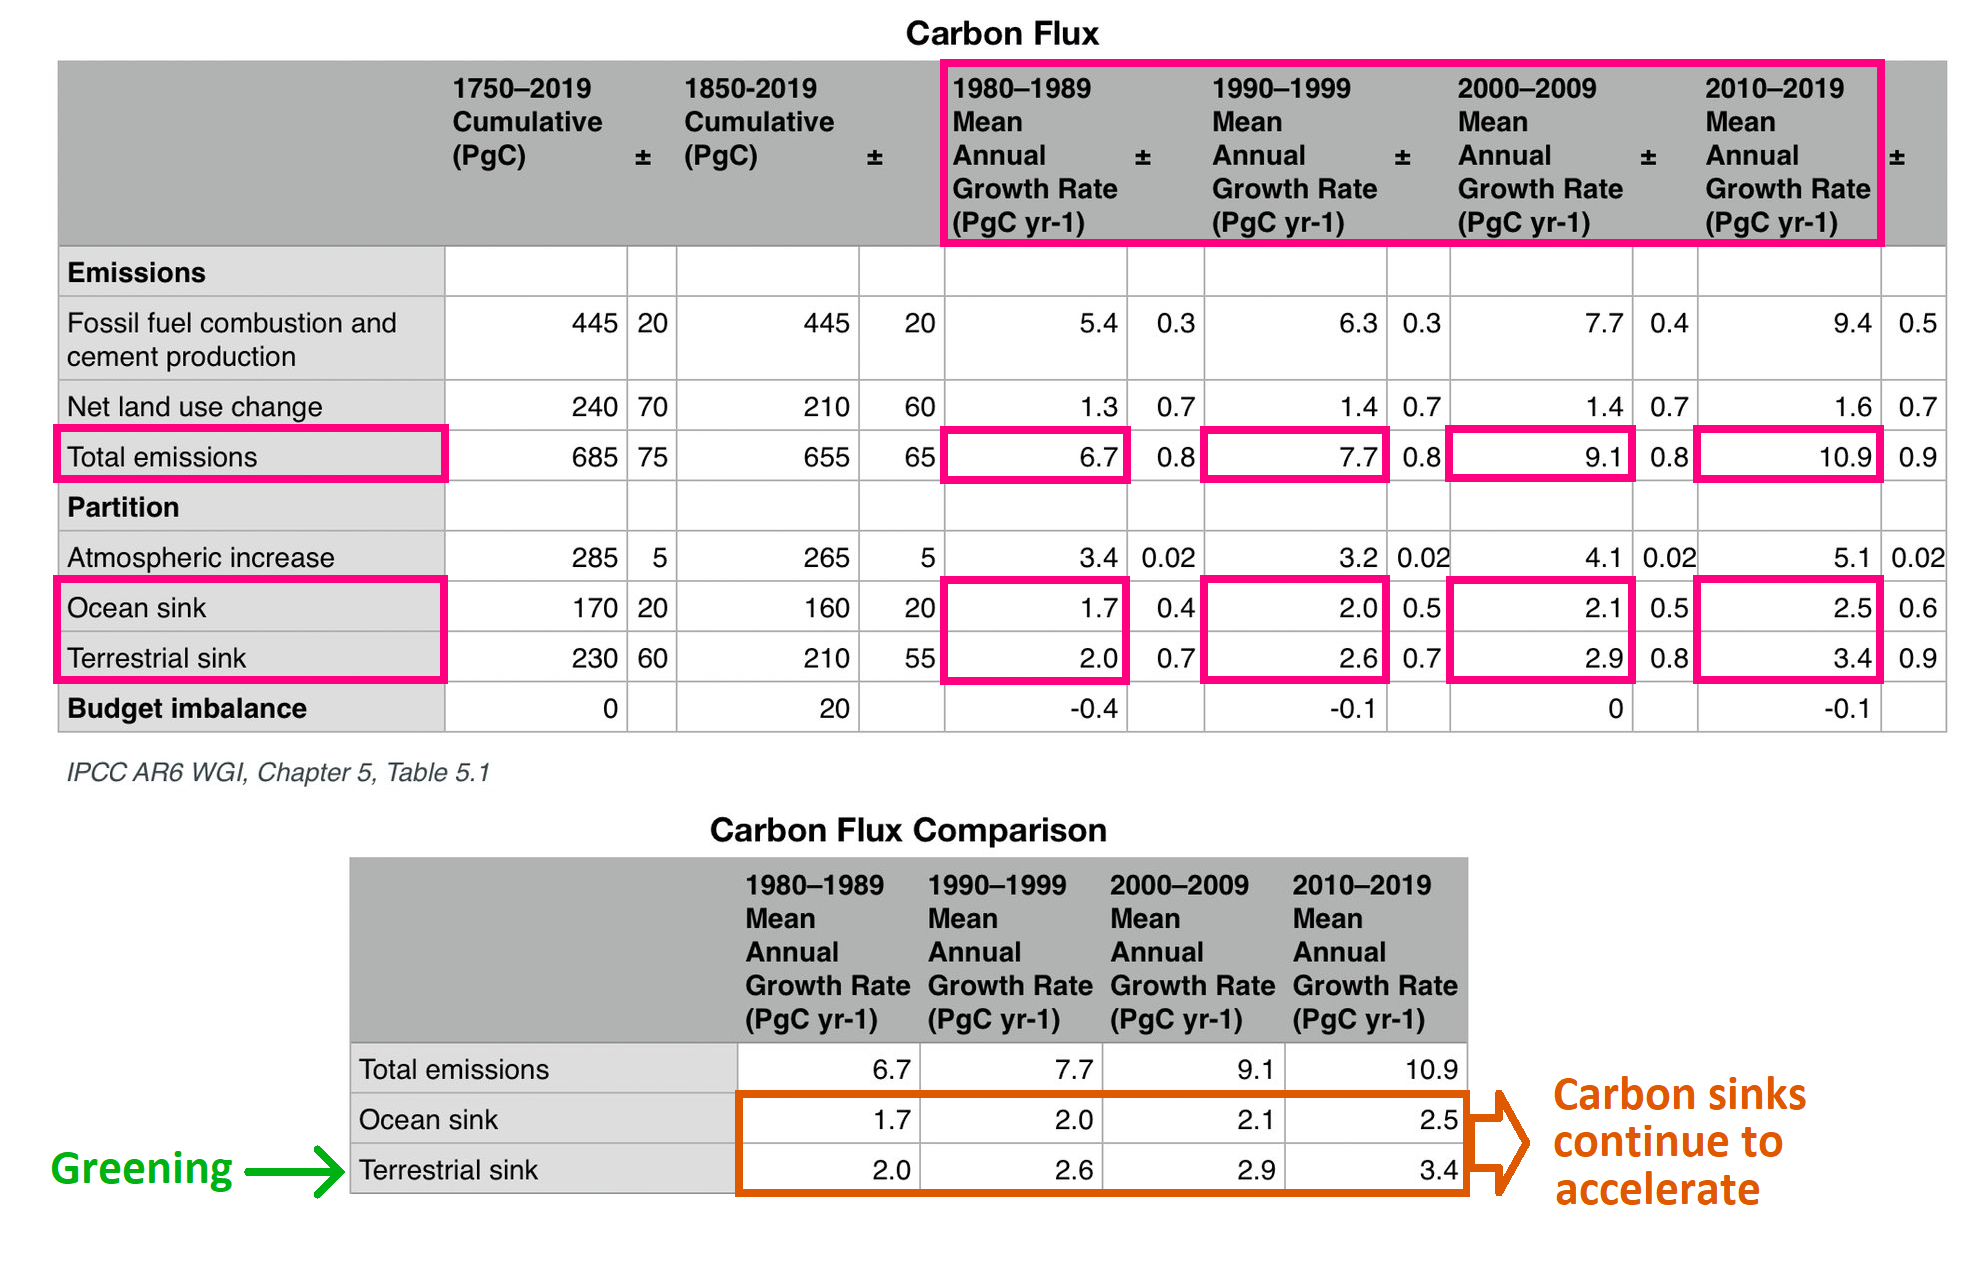
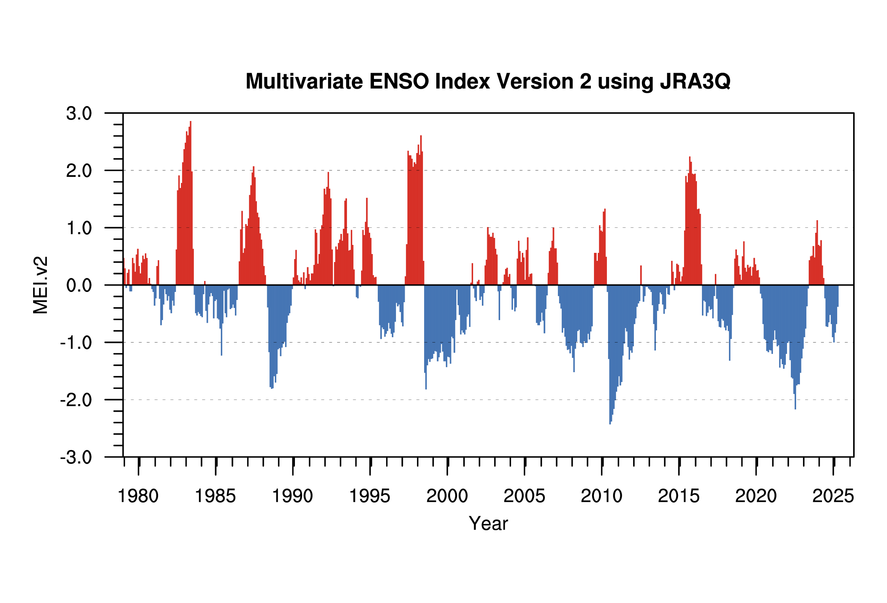
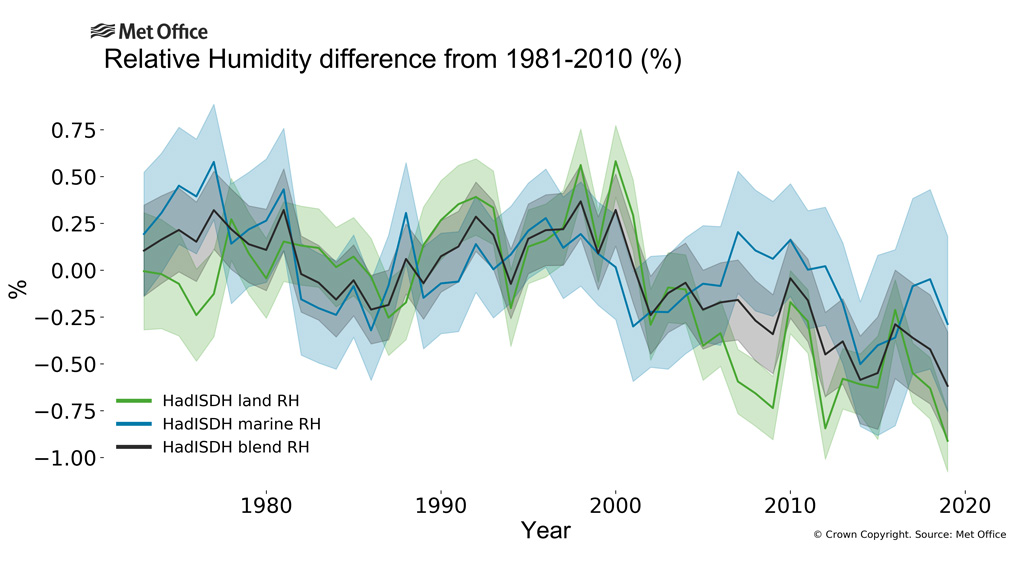
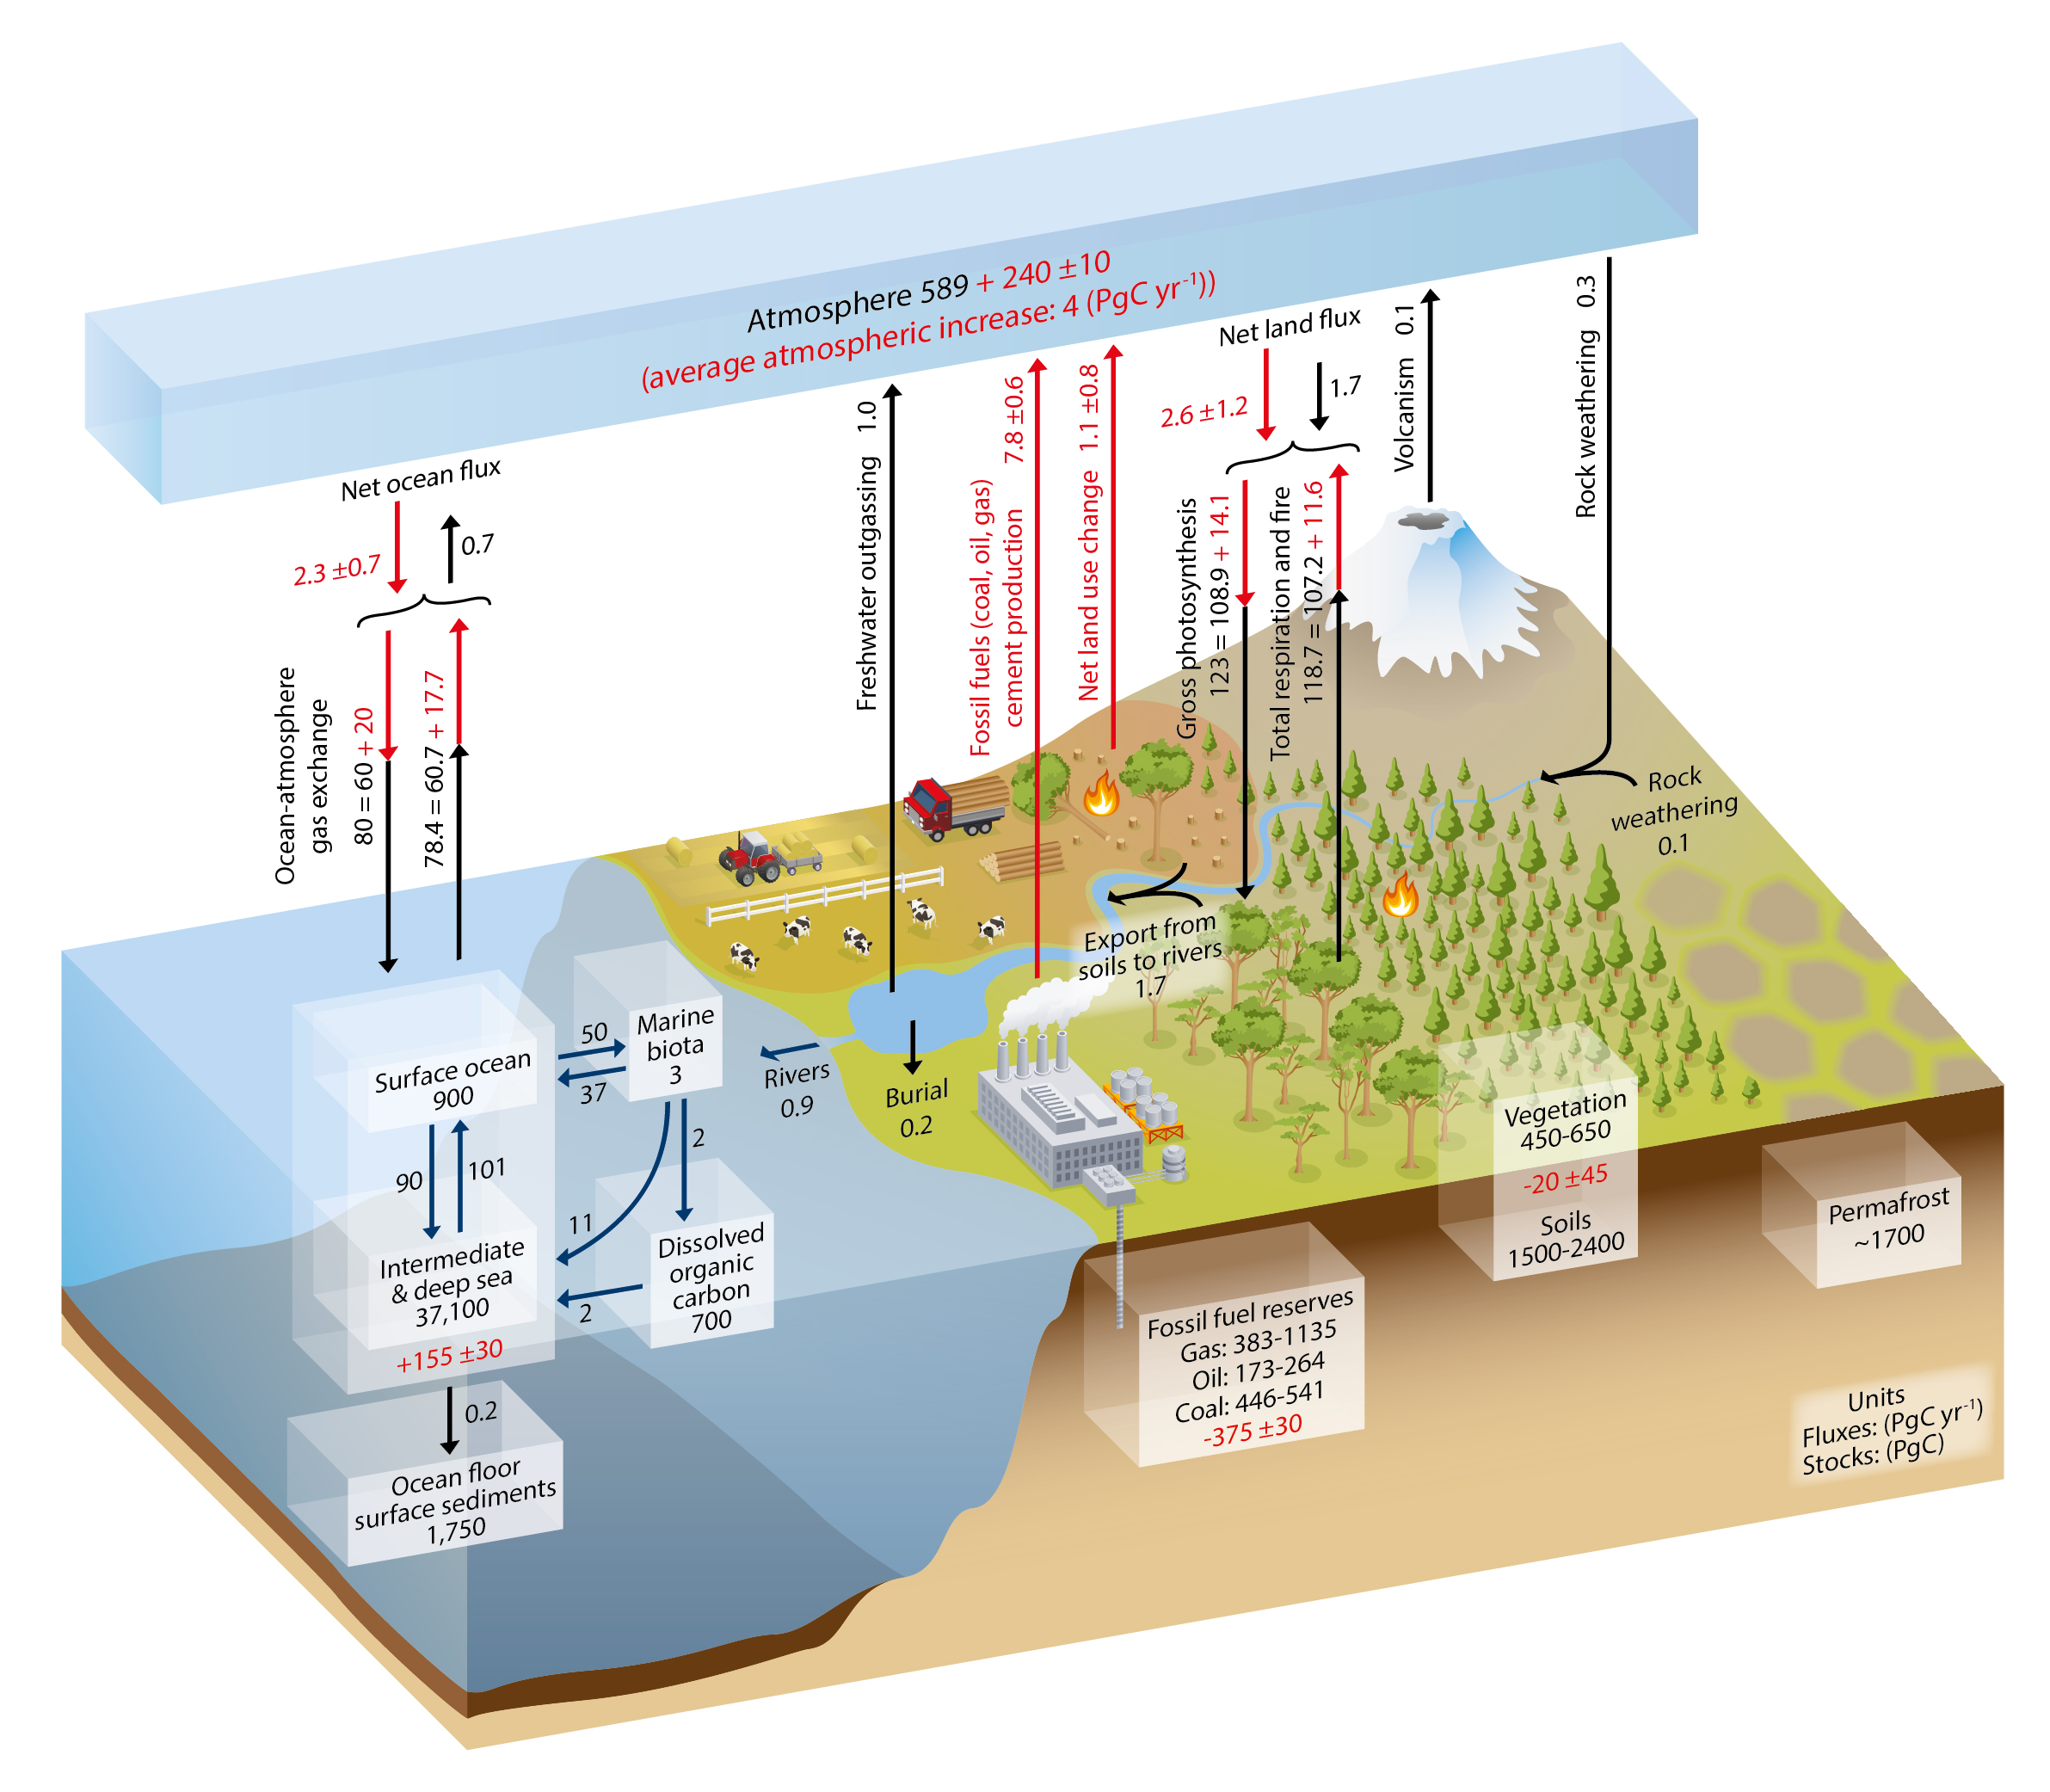
THE ESCALATOR

(free to republish)