


 Arguments
Software
Resources
Comments
The Consensus Project
Translations
About
Support
Arguments
Software
Resources
Comments
The Consensus Project
Translations
About
Support
![]()
![]()
![]()
![]()
![]()
![]()
![]()
![]()
![]()
![]()


![]()


Latest Posts
- Skeptical Science New Research for Week #17 2024
- Water is at the heart of farmers’ struggle to survive in Benin
- At a glance - The difference between weather and climate
- India makes a big bet on electric buses
- 2024 SkS Weekly Climate Change & Global Warming News Roundup #16
- EGU2024 - An intense week of joining sessions virtually
- Skeptical Science New Research for Week #16 2024
- How extreme was the Earth's temperature in 2023
- At a glance - Is the science settled?
- What is Mexico doing about climate change?
- 2024 SkS Weekly Climate Change & Global Warming News Roundup #15
- Fact Brief - Did global warming stop in 1998?
- Skeptical Science New Research for Week #15 2024
- EGU2024 - Picking and chosing sessions to attend virtually
- At a glance - The Pacific Decadal Oscillation (PDO) is not causing global warming
- Climate Adam: Is Global Warming Speeding Up?
- 2024 SkS Weekly Climate Change & Global Warming News Roundup #14
- Gigafact and Skeptical Science collaborate to create fact briefs
- Skeptical Science New Research for Week #14 2024
- How can I make my retirement plan climate-friendly?
- At a glance - Global warming and the El Niño Southern Oscillation
- A data scientist’s case for ‘cautious optimism’ about climate change
- 2024 SkS Weekly Climate Change & Global Warming News Roundup #13
- Skeptical Science New Research for Week #13 2024
- You can start applying for the American Climate Corps next month
- At a glance - Human fingerprints on climate change rule out natural cycles
- Want clean electricity? These are the overlooked elected officials who get to decide.
- 2024 SkS Weekly Climate Change & Global Warming News Roundup #12
- Climate - the Movie: a hot mess of (c)old myths!
- Skeptical Science New Research for Week #12 2024
Comment Search Results
Search for joanne nova
Comments matching the search joanne nova:
- Climate Scientist reacts to Donald Trump's climate comments
MA Rodger at 06:17 AM on 26 November, 2019prove we are smart @21,
The muppet in the video simply combines a number of weak or falacious argument to support his grand "there is no AGW" delusion.
The first bit of it is feeding off this weblog at denialist site http://joannenova.com.au. There are genuine reasons for adjusting temperature data but the usual nonsense from denialists is that such adjustments are fake, or at least they are fake when the raw data is more favourble to their delusions.
The Mayor of Glen Innes featured in the denialist video says nothing about what data is used to establish AGW. I'm sure if the number of +40ºC daily maximums was how to measure AGW, we would have debunked that particular denialist argument many times before.
The Glen Innes Annual Max data for the period 1907-2012 doesn't show any significant warming trend, although when combined with the Annual Min data, the Annual Average data 1907-2012 does. And over the period 1975-2012 the Average data is running at +0.15ºC/decade although the noise reduces the statistical significance (+/- 0.12ºC/decade at 2sd). The Annual Max also shows a reasonable warming trend but the noise makes it statistically insignificant at 2sd +0.12ºC(+/-0.21)/decade.
And the various reports of cold winters are not incompatible with AGW although it is wise not to listen to other swivel-eyed climate deniers unless you are happy broadcasting fake news. So the blather about a cold winter ahead for the UK is nought but blather. "Claims that the UK is set to face the chillest winter in a century and even a white Christmas have been dismissed by the Met Office."
And arguing against a swivel-eyed loon in full flow isn't for the faint hearted. Unless you have history with the guy, or you can succinctly debunk his nonsense, I would suggest you let this Rowan Dean make a fool of himself. He appears not to always be careful with what he spouts. For instance, I see last year that he proclaimed that "A growing number of scientists now believe solar activity is the real culprit behind so-called climate change." This is the sort of nosense that can be addressed assertively. "A growing number of scientists"? What are their names? Put up or shut up!!
- It's the ocean
jesscars at 15:10 PM on 13 June, 2019I believe this is a misrepresentation of the "skeptics'" argument being made.
"Skeptics" believe that, before the industrial revolution, the correlation betweeon CO2 and temperature (as shown on records such as the Vostok Ice Coe records) was explained by:1) Natural factors causing the earth's temperature to change e.g. Milankovitch cycles, solar radiation cycles, and the circum-polar jet-streams.
2) The ocean beng warmed or cooled due to these natural factors - which takes several hundred years (thus explaining the 800-year lag found on the Vostok Ice Core samples).
3) The release or absorption of CO2 from the oceans, as the natural solubility or equilibrium level of CO2 in water changes with temperature. (The linear relationship of CO2 to water temperature (below about 23 degrees C.) also explains the linear historic relationship of temperature to CO2 (found at Vostok): which is about 1 degree C. to 10 ppm atm. CO2.)
So yes, the historic source of CO2 was the oceans - and it was the temperature change, caused by natural factors, that caused this change. - Increasing CO2 has little to no effect
jesscars at 12:51 PM on 13 June, 2019I have a couple of questions re. the historic vs future predicted relationship between CO2 and temperature:
If you look at the Vostok Ice Core Records, the relationship between CO2 and temperature is linear, and is approximately 1 degree change per 10 ppm change.[1]
1) Why is this not the expected predicted relationship of CO2 to temperature? Why does it go from 1 degree per 10 ppm to 1 degree per doubling, the first doubling being 300 ppm (then 600, 1200, etc.)? Why does the sensitivity of the earth's temperature to CO2 change so severely to have only 1/30th the sensitivity? What is the reason for this reduction in sensitivity?
2) Why does the relationship change from linear to logarithmic? There is a steady and consistent linear relationship of 1 degree for 10 ppm - why should this change to a logarithmic relationship of degree per doubling i.e. instead of 1 degree per 10 ppm, we now have 1 degree per 300 ppm, then per 600 ppm, then per 1200 ppm, and so on. What is the cause of the change of the nature of this relationship?
It seems to me that the "skeptics'" explanation - which assumes temperature is causal in the observed temperature-CO2 correlation - does not involve such erratic and unexplained behaviour.
N.B. The linear 1 degree per 10 ppm can be explained by the linear relationship of CO2 solubility in ocean water (at temperatures below 23 degrees, see link [2]).
As the temperature changes (measured by the atmospheric temperature), this causes the ocean temperature to change. Within the temperature range seen on the graph in link [2] i.e. below about 23 degrees, you would expect a similar amount of CO2 to be released or absorbed, per unit or degree of change, per volume of water, resulting in a linear atmospheric temp-CO2 relationship.
The Vostok Ice Core records also show an 800-year lag where temperature changes before CO2 does. This indicates that temperature is causing CO2 to change, not vice-versa. (The Shakun study only attempts to provide an explanation for this for the last deglaciation, not the entire duration of the Vostok samples (400,000 years), so really is inadequate.) This can be explained by the fact that the oceans take so long to heat or cool. So it takes hundreds of years for the warming or cooling to have an effect on the CO2 levels, as this has to happen via the oceans.
2) The causal mechanism to explain the temperature-CO2 correlation is explained by: natural causes (e.g. Milankovitch cycles, sun radiation cycles, circumpolar jet-streams, etc.) to be caused by ocean absorption of CO2, is expected
[1] http://joannenova.com.au/global-warming-2/ice-core-graph/
[2] https://i1.wp.com/www.geological-digressions.com/wp-content/uploads/2016/12/CO2-solubility.jpg
- Increasing CO2 has little to no effect
jesscars at 19:54 PM on 9 July, 2018Hi All,
I have another question re. temperature predictions.
If the expected warming is an increase of 1 degree per doubling of CO2, why is this not matched by the Vostok Ice Core samples? These show about a 1 degree per 10 ppm linear relationship.
Why would the historic linear trend be replaced by a logarithmic one? At what level of CO2 does this happen?Thanks,
Jessica - CO2 lags temperature
Eclectic at 10:07 AM on 18 February, 2017Adri Norse Fire @540
You mention a New little ice age, coming in the next few years and decades. That is the assertion by Mr Peter Ferrara in Forbes Magazine in 2013 (the link supplied by you).
Since 2013, the world has had its three hottest years in recorded history ( 2014 / 2015 / 2016 ). And there is absolutely no sign that Mr Ferrara's assertion could become true. His assertion is total Unsinn (as the Germans say). Total nonsense.
Adri, you should not be surprised to find Unsinn coming from Mr Ferrara. He is a lawyer and a professional propagandist and an Amerikaner . . . a truly toxic combination!! Mr Ferrara is paid to give you Dreck instead of Wahrheit / Sanningen / Truth. And it is the same with JoanneNova.
Adri, please attempt to be scientific with your thinking. When you wish to assess the health of a forest, then you should look at the health of all the trees - not simply look at the healthiest 4 trees which you can find to please you.
- CO2 lags temperature
Adri Norse Fire at 23:41 PM on 17 February, 2017MA Rodger
What I meant was that I am using scientific data in the sense that my arguments are exclusively in scientific terms, regardless of whether my claims are true or not.Rob Honeycutt/scaddenp
Why do you say that I am not using scientific data? Do not scientific documentaries and scientific journals make scientific knowledge public? Is that knowledge invalid? So everything the public knows is a lie ... including global warming, right?
When I said that the current temperature was below about 1.5 ° I relied on a documentary where a gentleman, I think he was Norwegian who was in the Antarctic and claimed that the ice cores of his own research proved that the temperature was 1.5 ° higher to the present during the Medieval Warm Period. But also, it is known that historically the peoples of contemporaries of that time recorded that in Greenland agriculture was possible, among other things, etc. I think it is out of place to think that everything is part of a subtle conspiracy, of wich I am part, of course.
Tom Curtis
Thank you.
Okay, this is the kind of thing I said that misinterpretations were likely to occur. I have not said that the current increase in CO2 comes from volcanoes. And you're right, I thought it was a question I asked John Hartz, it's my fault. Sorry. Again you are right, I have no problem accepting that the recent increase in CO2 is due to human industrial activity, although there are other scientists who deny that conclusion with their own data, since from the beginning I said CO2 does not cause the current global warming by greenhouse effect or by feedback. I just do not see it likely. Sources I read some time ago claimed that water vapor is the main greenhouse gas and that it is responsible for two-thirds of the natural greenhouse effect. As you say very well it is a stable process, but the Earth makes all kinds of movements and we do not really know how much impact the orbital changes have on the greenhouse effect and Milankovich attributed the intervals of glacial periods and warm periods to the orbital changes. Which is no small thing in terms of climate.
Sorry for putting that graphic, I knew it was just a very nice graphic. I have taken note.
Well, as I said above the Antarctic data show also, that the temperature was higher than the current approximately 1.5 degrees during the Medieval Warm Period.
"All of this may be a side issue, but I am unsure as to what point you are trying to make with two charts of CO2 concentration over the last 800,000 years, or the chart of CO2 concentration over the Holocene." Why the current Temperature is 1.5 ° lower than the medieval warm period? " It is not. See chart above.'' Yes it was, why do you think it was called the Medieval Warm Period? Let's look at some recent research:
Working with a 2.5-foot-long core of peat in Penido Vello (Galicia, Spain) Martinez-Cortizas et al. (1999), a Mercury deposit record was extracted that extended until 4000 years ago. The work revealed that warm periods were characterized by a low accumulation of mercury. They also standardized the variables extracted and related them to the temperatures of the last 30 years. The work revealed that the medieval warm period in the northwest of Spain was 1.5 ° C warmer than the current one and that the average temperature of the warm Roman period was in no less than 2 ° C. Even a period of 80 years in the Middle Ages with average temperatures 3 ° higher than the current ones.
Desprat et al. (2003) studied the climatic variability of the last three millennia through the sediments of the Vigo estuary, clearly recognizing three warm periods and three cold periods, without seeming to be a relation between the variability and the increase of carbon dioxide. The authors concluded that the solar radiative balance and the ocean circulation seem to be the main mechanisms that force these cyclical variations in the Peninsula.
Pla and Catalan (2005) analyzing sediments of chrysophytes in more than 100 lakes of the Pyrenees reproduced a record of winter and spring temperatures during the Holocene. Warm and cold oscillations were recognized for these oscillations over the past few millennia. From the Medieval period it is deduced that the temperatures were then 0.25 ° higher than the current ones.
Here a chart: http://www.biocab.org/Holocene-Delta_T_and_Delta_CO2.jpg And as I liked the dissection you did to the other here is more: http://www.biocab.org/Boreholes_Reconstruction.jpg http://3.bp.blogspot.com/_H07QGNhZQzA/S_gGpyDlDQI/AAAAAAAAAHw/ADQvLwN-9U0/s1600/temperaturas+%C3%BAltimos+2000+a%C3%B1os.jpg http://www.biocab.org/Holocene_Delta_T_and_Delta_CO2_Full.jpg
''Of course, in your version it is labelled Northern Hemisphere temperatures, not global temperatures. The point still stands, however. A Greenland ice core no more shows Northern Hemisphere temperatures by itself than does a thermometer in Moscow show temperatures in Tucson, Arizona.'' The question then remains valid, but to avoid falling into the little trick of geography I will rephrase: Why the current temperature of Spain is lower (0,25º - 1,5º) than the Spain's Medieval Warm Period, if the current concentrations of atmospheric CO2 in Spain is higher without any doubt?
(Can we extend the geographical scope to the Mediterranean and even Europe? I do not know; http://science.sciencemag.org/content/291/5508/1497 , http://science.sciencemag.org/content/342/6158/617)
--And someone asked me why I'm so skeptical or something--
Well, it is not very difficult to be a skeptic of anything since we have been able to see everything from the millionaire Red Cross scam in Haiti after the earthquake to hear the Greenpeace co-founder say that this organization has become a corrupt gang and then you see scandals with emails and what some IPCC scientists say, and so on. When I saw the Al Gore's documentary I believed it and when I saw the documentary of The Great Scam of Climate Change, I also believed it. So we must be very careful not to be deceived by the official tone, as some have pointed out: http://joannenova.com.au/2010/10/is-the-western-climate-establishment-corrupt-part-4-past-temperatures/
MA Rodger
It's funny that you mention sidelong to the ''Little Ice Age revivalists'' because according to NASA members, this very century we can face a solar minimum such as the Maunder Minimum or the Dalton Minimum and presumably a new Little Ice Age. Here's a link: http://www.forbes.com/sites/peterferrara/2013/05/26/to-the-horror-of-global-warming-alarmists-global-cooling-is-here/#5c8c582669bb
- How to inoculate people against Donald Trump's fact bending claims
ryland at 19:42 PM on 24 March, 2016Dr Death @8. Not unsurprisingly despite your comment "I will look at scientific facts and the reasons for it and then I look at the debunking side of it as to why people believe that part is not true" none of those responding to your post have provided you with any sites where "debunking" occurs on a regular basis.
Some of those sites are Wattsupwiththat run by an American "meteorologist" but probably more accurately a TV and radio weather presenter; Jonova run by the Australian Joanne Nova who has an Honours degree majoring in Microbiology and Molecular Biology from the University of Western Australia; ClimateAudit run by Steve McIntyre a Canadian with a Bachelor's degree im Mathematics from the University of Toronto and a degree in politics, philosophy and economics from the Unversity of Oxford; Climate Etc run by the American Dr. Judith Curry who is a climatologist with many peer reviewed publications in the field of climate science; Global Warming Policyh Foundation started by the Englishman Nigel Lawson (aka Lord Lawson) who was the Chancellor of the Exchequer in Mrs thatcher's government. Others you might like to look up are the American Dr. Richard Lindzen an atmospheric physicist educated at Harvard, the American meteorologist Dr Roy Spencer and the American climate scientist Dr john Christy who, with Roy Spencer monitors the global climate using information from satellites
All of those who I have mentioned are persona non grata at this site but as your stated aim is to examine the views from the "debunking side" it seems remiss not to point you in the direction of some, but by no means all, of those who frequently comment on the 'debunking side" of the climate debate
- Oceans are cooling
Cedders at 18:09 PM on 11 March, 2016A more recent sceptical argument is that, while the ocean appears to show the energy imbalance, the rate of warming is negligible. See for instance http://joannenova.com.au/2013/05/ocean-temperatures-is-that-warming-statistically-significant/ which alleges that the error from network of buoys is greater than thought (I didn't find that line convincing, but the temp graphs get recylced).
Judith Curry writes "with the 2nd law of thermodynamics, it is not easy to get much of that heat back to surface... since the 1960s, the warming of that layer [0-2000m] was 0.06 °C... can anyone figure out why 0.06C is a big deal for the climate".
Cheng, Zhu and Abraham find warming of 0.0061 °C/yr in 0-700m, close to models, but one naive question might be why this is less than half the rate of surface warming, and less than 1 °C in a century. Does this slowness mean the oceans will moderate or delay the surface warming more than thought? Is there a simple model to explain this? I wonder if this deserves its own article.
- The gutting of CSIRO climate change research is a big mistake
Tom Curtis at 10:53 AM on 12 February, 2016On the same topic, funglestrumpet @16, it is very dubious that the former British Chancellor of the Exchequer has much direct influence on the Treasury Department of the Commonwealth of Australia, or the Treasurer in the Australian Government. Given the details @19, the idea that this redeployment of CSIRO resources results from the undue influence of Lawson in UK politics is not credible.
For deniers as for supporters of science, this came as a bolt of lightning out of the blue. The only difference is that they while they celebrate the loss of fundamental research on climate, supporters of science regret it.
- 2015 SkS Weekly Digest #42
Tristan at 10:03 AM on 19 October, 2015Meanwhile, over at Gina Rinehart's favourite website, Dr David Evans, PhD has gone full Galileo, and his wife has so far devoted 13 posts to it.
- 2015 SkS Weekly News Roundup #31C
Tom Curtis at 15:42 PM on 2 August, 2015jenna @2, the claim echoes those made by Fabius Maximus, and echoed by Joanne Codling three days ago. They relate to the release of additional data from Verhenger et al (2014). (Note, the PDF document is a data release, not a new paper - contrary to the misrepresentation by Codling.)
A couple of things are worth knowing about the data.
First, the authors invited responses from a number of groups chosen for their having authored scientific papers on climate change plus a small group invited because they had signed "... public statements disapproving of mainstream climate science". That group represented just 2.4% of invitees, but 4.7% of respondents. We are told that "about half of [the respondents only invited because of public political statements against climate science] only published in the gray literature on climate change"; ie, that they are not climate scientists at all. Further, even for the "about half" who are climate scientists, it is unlikely that that many of them would have been invited from a random sample of climate scientists. Indeed, we know that they would not because there is not a 50% overlap between the "unconvinced" and those invited on their merits.
Fairly obviously, because the rest of the respondents were invited based on their names appearing of authors on climate science related papers in the scientific literature, that introduces another bias into the group. Those who have published fewer papers are less likely to have been invited. Ergo, even ignoring the deliberately introduced bias in favour of the "unconvinced", the sample is also biased in favour of frequent publishers. Ergo the the sample does not represent a random sample of climate scientists, and therefore it is impossible to infer from the sample frequencies the frequencies of particular beliefs among climate scientists in general. The results are merely indicative, and when we look at patterns among subsamples, informative.
Second, the survey explicity asked about the respondents breadth of knowledge in climate science. That is very important because "climate science" is a multidisciplenary subject with a very complex field. As a result, many climate scientists are very expert in a particular issue relating to climate science without therefore being expert in all, or even many aspects of climate science. In fact, among respondents only 34% indicated that their "general knowledge of physical climate science" was "broad" or "quite broad", with another 31% indicating that their knowledge was only "slightly broad", or that it was "not broad" at all (Question 8a).
A similar question was asked about depth of knowledge of even one aspect of climate science ("one or more aspects of physical climate science"), with only 38% indicating it was "very deep" or "quite deep" on even one aspect, while 35% indicated it was only "slightly deep", or "not deep" on even one aspect of climate science. The low level of stated depth of knowledge would be a function of two factors. One is the level of comparison. Scientists would compare their depth of knowledge to the acknowledged experts in the specialist field (aspect), so that even "slightly deep" knowledge may well represent at least an undergraduate level of understanding of the topic. Further, because climate science is multidisciplenary, coauthors of climate sciense papers may be authors because of their specialist knowledge in a related field, but not in how it applies to climate science. A paper on dendroclimatology (determing past climates from tree rings) may include as an author an expert in tree rings who has not studied any aspect of climate science beyond the effects of temperature and precipitation on treering density and width.
Given these stated limits on the knowledge of climate science by the respondents, it is absurd to argue (as Joanna Codling does) that:
"Fabius Maximus suggests we exclude the “I don’t knows” which brings up the number to 47%. Since these are “climate scientists” I don’t see why those responses should be excluded. An expert saying “I don’t know” on the certainty question is an emphatic disagreement with the IPCC 95% certainty."
Climate scientist is not the same as "expert on attribution of temperature increases", the latter being a distinct and very small subset of the former. Therefore when a climate scientist says about an attribution question that "I don't know", it is safe to assume that is because attribution is not their area of expertise, and that they should not be included among the experts in that area.
So, where does the 43% come from? Essentially, Maximus takes the percentage of respondents who agreed that 50% or more of "global warming since the mid-twentieth century can be attributed to human induced changes in atmospheric greenhouse gas (GHG) concentrations" (question 1a), which is 65.9%. He multiplied that by the percentage that agreed that the certainty was "extremely likely" or "virtually certain" (65.2%), thereby obtaining a percentage that agreed with the IPCC AR5 both with respect to the attribution level and certainty (43%).
So, even on face value, the claim becomes that only 43% of a non-representative group of climate scientists and skeptics without necessarilly having detailed knowledge on attribution agree with experts in attribution who have spent more than a year in a detailed review of all the relevant data on attribution both on amount and certainty. To that, I think, the appropriate response is, "so what". Without a detailed study of attribution, climate scientists have no independent knowledge of the level of attribution, let alone the certainty of the attribution. Do Maximus and Codling realy expect detailed study of (for example) ENSO, will magically confer the knowledge of not just the best estimate of the attribution percentage, but also the certainty of the estimate? Perhaps they do. Codling at least certainly seems to believe it is possible to make detailed and exact attribution statements by studying just the Sun - and may well carry a similar magical view of science across to other areas. But just because they live in a fantasy land is no reason for us to take them seriously.
Of course, many, including many who don't have an investment in "anything but CO2" being the cause of recent warming may find such a reponse unsatisfying. For them it may be necessary to examine the numbers.
If we do that, the first thing to notice is that the IPCC AR5 says that:
"More than half of the observed increase in global mean surface temperature (GMST) from 1951 to 2010 is very likely due to the observed anthropogenic increase in greenhouse gas (GHG) concentrations."
But that:
"It is extremely likely that human activities caused more than
half of the observed increase in GMST from 1951 to 2010."(My emphasis in both quotes)
As the survey question relates to the effect of greenhouse gases, it is the first statement, not the second that is the relevant comparison. That being the case, if you want to compare those who agree with both the attribution level and the certainty, it is the certainty of the first statement (not the second) that should be used. That immediately lifts the percentage to 65.9% (attribution) * 89.3% (certainty), or 59%. Puting it simply, Maximus fudged the issue by using an incorrect comparison. Without that fudge he could not have claimed a minority of scientists agreed with the IPCC.
The second thing to notice is that the percentage increases significantly if we eliminate the non-climate scientists and the overrepresented "skeptics" from the sample. This is a necessary step if we want to interpret the result as anything meaningful with relation to climate scientists.
As it happens, 14 (15.9%) of those "unconvinced" respondents agreed with the concensus that more than 50% of recent warming is due to changes in GHG concentration. Removing those 14 from those agreeing on attribution, and the other 74 "unconvinced" from those 'disagreeing' lifts the attribution percentage to 68.4%, and hence the total agreeing on both attribution and certainty is lifted to 61%.
The third thing is that not only the "I don't knows" but also the "others" should be excluded from the response. The first because (as note above) "climate scientist" is not the same as "expert on attribution" so that when they say that they do not know, that response should be taken as a statement of personal ignorance, not (as Maximus and Codling would have it) just a variant formulation of "it is unknown". That is, a statement of personal ignorance is not a conclusion that the experts are wrong in stating that they know something.
The "other" category needs to be excluded because it is logically incoherent. The available responses allowed you to respond that there was "no warming", or that the cause of the warming was "unknown". It also allowed you to respond that GHG was responsible for "less than 0%" of the warming. That is, it covered all logical bases. For something to be "other" you have to agree that warming was greater than zero (to exclude the "no warming response"). You further have to agree that the answer to the attribution question is known (to exclude the "unknown" response), known by you (to exclude the "I don't know" response, and that GHG caused neither less than nor more than 0% of the warming (to exclude all other possible responses). Having done that, you are at least a sixth of the way to dining at Milliways. Put simply, the "other" responses are inchorent and therefore should be excluded.
Excluding these two cagegories excludes 222 responses from all responses, and 7 responses from the "unconvinced". That means excluding them raises the attribution level to 74%, and the 66%.
To summarize, if we did a valid comparison with the IPCC AR5, and did not pad out the survey numbers with known "skeptics" and by including explicity statements of ignorance and incoherent results to pad out the denominator, the proportion we would obtain would be, not 43%, but 66% agreeing on attribution and certainty, and 74% agreeing on attribution. That is, Maximus has deflated the agreement to fit his narrative by 35% at minimum. (Given that the survey is of climate scientists in general, not of researchers into attribution in particular, I would say he has deflated it by 58%.
Having said that, I would still not call 74%, let alone 66% a consensus. It is a supermajority. This should bring some caution in the over interpretation of studies like Cook et al (2013), which showed a 97% concensus in published literature - not among climate scientists. That however, has been evident for a while. What is known, however, is that the more expert climate scientists are on the topic, the more likely it is that climate scientists will agree with the IPCC consensus. The same is shown with Verheggen et al, with 84.5% of respondents having published 30 papers or more (and exlcuding those who express personal ignorance or have an incoherent response) agree with the IPCC on attribution. Only 8.5% think GHG concentrations are reponsible for less than 50% of warming, or think there has been no warming; and only 7% think the answer unknown. (Percentages calculated by pixel count, and are only accurate withing approx 0.5%). No doubt the percentage would be even greater among climate scientists with experience in attribution studies.
- 2015 SkS Weekly Digest #27
MIchael Fitzgerald at 11:03 AM on 16 July, 2015KR,
Actually, it was his post here (#35.1) that inspired my question.
http://joannenova.com.au/2015/07/climate-scientists-more-scared-of-an-inquiry-into-the-science-than-they-are-of-climate-change/
Based on your denial that these questions even have answers, co2isnotevil appears right and the answers clearly dispute the accepted sensitivity, and this scares many who believe otherwise. I'm also a physicist and his descriptions of the underlying physics are spot on. The climate is certainly complex, but in the final analysis, its macroscopic behavior must still obey the laws of physics. The many inconsistencies pointed out in the threads you referenced is astonishing, especially how so many laws of physics must be violated to support a high sensitivity. I still have trouble believing how so many smart people can be so wrong in so many ways about something so important, but the evidence presented is powerfully compelling.One piece of evidence is a plot of monthly average surface temperatures vs. monthly average emissions by the planet, extracted from decades of satellite measurements, where the only possible conclusion is that the Earth is nearly an ideal gray body from space with an emissivity of 0.62 and answers the question about whether an ideal gray body model is sufficient for modeling climate change or at least bounding the sensitivity. The theoretical range of the sensitivity for an ideal gray body model of Earth is in the range of 0.2 – 0.3 and spans most of the estimates from the so called 'consensus of skeptics' and is far from the 0.4 – 1.2 range asserted by the 'IPCC consensus'. There's no room for compromise where both sides can say they were right and that's part of the problem. I predict that a sensitivity significantly less than the accepted lower limit of 0.4 must inevitably be accepted, and when it is, climate science will be disrupted in a way that no field of science has ever experienced and it will be both interesting and scary to watch with many far reaching repercussions.
- Climate sensitivity is low
Tristan at 00:30 AM on 18 May, 2015Apologies for this one folks. Bobl over at joannenova is adamant that he has been banned from sks for his truth-telling, and I told him I'd ask a question for him. A couple commentators now have a bee in their bonnet given I tried to address it myself, so here you have it:
In 1850 the temperature was about 0.75 deg C lower than now, the CO2 was supposed to have been about 270PPM. Now it’s 400 PPM.We know from Arhennius that deltaT = k ln(CO2-2/CO2-1)
So, therefore 0.75 = k ln(400/270) and therefore k=0.75/ln(400/270)
k = 1.91
So lets then calculate the warming for a doubling
DeltaT = 1.91 × ln 2 = 1.34 degrees per doubling between 1850 and 2014
Now the IPCC says that 50% of warming is probably coming from humans and 50 % is natural variation so if we assume that 50% of all the warming from 1850 to now is CO2 induced (which it is not, the bit from 1850 to 1950 is unlikely to be CO2 related) at best we causing just 0.77 degrees of warming due to mans gasses, and the other 0.77 degrees must be something else which won’t necessarily accumulate.
0.77 degrees per doubling implies feedback was negative over the period from 1850 to 2014.
Given CO2 warming over the last 130 PPM was at best 0.37 to 0.75 degrees and the implied climate sensitivity from that is therefore 0.77 to 1.35 degrees per doubling, therefore the magic 2 degree figure (noting that the IPCC says up to 2 degrees of warming will be positive for the human race) is likely 500 – 1000 years away from happening, why are we even worried about it?
- Antarctica is gaining ice
bozzza at 09:29 AM on 10 May, 2015How does a climate change advocate deny the reality of this?
- Roy Spencer finds negative feedback
Tom Dayton at 02:37 AM on 26 January, 2015CO2 and temperature trend not directionally consistent: http://joannenova.com.au/global-warming-2/ice-core-graph/
See "CO2 Lags Temperature--What Does It Mean?" Put comments on that topic on that thread, not this one. Off-topic comments on this thread will be deleted.
Shorter cycles have an impact: http://www.ncpa.org/pub/st279?pg=13
See "It's a 1,500 Year Cycle." Put comments on that topic on that thread, not this one.
3) The dominant opinion in Climate Science appears to ignore the above, or to acknowledge this with qualification. The most worrying element in this is the propaganda: human activities are causing climate change. Causality. If, at this moment you are not slightly uncomfortable, you might be practicing in the wrong field. [At the same time the statement can be so ambiguous as to allow the bigot to claim correlation.]
See "It's Not Us." And comment there, not here.
I don't have time to answer Deon's #4 and #5 right now. If nobody else has done so after a few hours, I will.
- Roy Spencer finds negative feedback
Deon van Zyl at 22:17 PM on 25 January, 2015I have read the comments posted here and have a few of my own to make.
1) There is a great desire to discredit Spencer as a junk scientist. Allow me to advance the following argument. Even though the elitism of Science and its direct disconnect from the majority of the people on this planet has resulted in a large number of geniuses playing with mathematical models largely irrelevant to daily existence, the impact of guesswork is not minute. The entire exercise witnessed here strikes me as the pot calling the kettle black. Climate modeling is a political issue. No, it is not a Scientific issue, because it is not Scientific. Science relies upon direct observation – not extrapolation. Empiricism underpins Science. Modeling is an aid to Science. Theory is not Science. At best a theory is a guess at the consistency of Reality. Climate modeling is an exercise in Mathematics. Models are based on assumptions. Assumptions prove nothing.
2) Geology as an empirical Science has demonstrated a long term trend in global climate. On average, every 100,000 years temperature peaks accompanied with a high in CO2 levels. Yet, the relationship is not consistent, nor does it explain the effect of shorter cycles - more precisly our current placement within all the cycles: long, medium, and short.Milankovitch in brief: http://ossfoundation.us/projects/environment/global-warming/milankovitch-cycles
CO2 and temperature trend not directionally consistent: http://joannenova.com.au/global-warming-2/ice-core-graph/
Shorter cycles have an impact: http://www.ncpa.org/pub/st279?pg=13
3) The dominant opinion in Climate Science appears to ignore the above, or to acknowledge this with qualification. The most worrying element in this is the propaganda: human activities are causing climate change. Causality. If, at this moment you are not slightly uncomfortable, you might be practicing in the wrong field. [At the same time the statement can be so ambiguous as to allow the bigot to claim correlation.]
4) I have a number of questions regarding climate modeling:
a. How is “human activity” operationalized? In research, concepts have to be measurable. Data has to be obtained. That data must be accurate, valid, and reliable. It would appear that in Climate Science that this concept is largely imputed.
b. What dataset used in Climate Science dates back more than 100 years (do recall the long term cycle of 100,000 years) and:
i. Is continuous,
ii. Measured consistently (across the globe, using the same methodology), and
iii. Applied without extrapolation.
5) As a suggestion this question may be relevant: if there is a natural long term trend, what impact does human behavior have on raising global temperature above the natural trend? Please explain to me how you will answer this question. Even propose an alternative to it if you must. - Antarctica is gaining ice
dvaytw at 21:55 PM on 21 November, 2014I know someone in the comments section must've already brought it up, but I don't really want to fish through eight pages. Can anybody tell me what's the deal with the papers from Frezzotti et al and Zwally saying that in fact the Antarctic is actually gaining ice overall over the last 800 years?
Antarctica gaining Ice Mass (balance*) — and is not extraordinary compared to 800 years of data
- CO2 effect is saturated
Jonathan Doolin at 13:52 PM on 13 October, 2014Hello. I found the graphs from Barrow Alaska very helpful.
The graphs from Barrow make it seem that Carbon Dioxide operates like a blackbody in wavelengths near 15 micrometers (667/cm) and is transparent in (most) other wavelengths.
Looking up, in the 600/cm - 760/cm range, there is roughly 100 milliWatt's per (square meter • steradian • cm^-1). Looking down, there's only 50. There is a much higher photon count in that range looking up than there is looking down.I did a little calculation using these numbers; based on the units of the vertical and horizontal parts of the Barrow Alaska graph... I could draw a little rectangle 100 high and 150/cm wide.
This rectangle would have an area of 15,000 milliWatt per (square meter • steradian). I would multiply by the area of the entire sky in steradians, which is about 6.25. which comes out to about 93.75 Watts per square meter.
----The graph that I referenced was not directly from joannova, but was from comment #58 at http://joannenova.com.au/2010/02/4-carbon-dioxide-is-already-absorbing-almost-all-it-can/
which in turn comes from http://theresilientearth.com/?q=content/why-i-am-global-warming-skeptic
Except for the color, this seems identical to the graph here.
http://noconsensus.wordpress.com/2010/04/19/radiative-physics-yes-co2-does-create-warming/What has been changed is that the infrared spectrum of Earth has been added.
Wein's Law says that lambda_peak * Temperature = .0029 meter • Kelvin
But what temperature should you use? 290 Kelvin yields a peak wavelength around 10 micrometers. When I did this earlier today, I thought the resilientEarth graph was too far to the left... (Using a temperature near 325 Kelvin, perhaps--like the Sahara.) However, the Sahara graph has a peak elsewhere, I think... Is Wein's Law an approximation that doesn't work at these temperatures?
======
I worked a good portion of the morning making another video, but unfortunately the screen-capture program crashed. These weren't the only things I addressed but seemed worth mentioning.
- The Skeptical Science temperature trend calculator
KR at 01:05 AM on 26 June, 2014Philip Shehan - I've added a comment on the JN thread to that regard. And noted to Vic Gallus that I've told him this before, only to be ignored.
- The Skeptical Science temperature trend calculator
Philip Shehan at 19:26 PM on 25 June, 2014I often use Kevin C’s trend calculator when discussing statistical significance on “skeptic” blogs.
This regularly attracts comments boiling down to the assertion that anything appearing on SkS must be rubbish, although I give reasons as to why I find it credible.
On Jo Nova’s blog Vic G Gallus has provided an argument which is thoughtful and backed by calculations. His argument is that the confidence limits returned by the trend calculator are too large.
I would very much like Kevin’s opinion on this.
Vic has said that he is happy for me to put his case .
Here are some of Vic’s points:
For the GISS data from 2000 using a free product on the web ZunZun (you can use Excel if you have the ToolPack or just type the equations in yourself.) For the function y=Mx+C
C = -1.3189290142200617E+01
std err: 1.90197E+01
t-stat: -3.02426E+00
p-stat: 2.87675E-03
95% confidence intervals: [-2.17979E+01, -4.58064E+00]
M = 6.8552826863844353E-03
std err: 4.72102E-06
t-stat: 3.15506E+00
p-stat: 1.89629E-03
95% confidence intervals: [2.56634E-03, 1.11442E-02]Coefficient Covariance Matrix
[ 1.34458894e+03 -6.69891142e-01]
[ -6.69891142e-01 3.33749638e-04]0.07±0.04 °C/decade and not 0.07 ±0.15 °C/decade (FFS)
Using GISS data from 1999, it comes out to be 0.097 ±0.04 °C/decade. I checked the coefficient using Excel and it was 0.097.
A comment from me:
Vic,
I had a suspicion of one possible cause of the differences in the error margin output but thought it would take some time to check on so left it until now, but alas when I go to your links, the first fails and the second is not helpful.
So I will pose this thought:
Looking at the output figures in your post and the blurb on microsoft toolpack:
http://support.microsoft.com/kb/214076
I notice that standard error is mentioned.
The algorithm I am using outputs the error margin as 2 standard deviations, (2σ).
This is the usual marker of “statistical significance”
Note that standard error is smaller than the standard deviation. So a standard error of 0.04 would convert to a 2 sigma value of greater than 0.08.
This would save you from being kicked to death by skeptics who would be outraged at the suggestion that their beloved pause was in fact statistically significant warming, and your GISS value since 1999 of
0.097 ±0.04 °C/decade (one standard error)
would be compatible with that of Kevin C’s algorithm:
Trend: 0.099 ±0.138 °C/decade (2σ)
Vic replies:
Look at the output.
The standard error is stated and it is less than the standard deviation. The latter is not stated but the 95% confidence intervals which equate to 2xSD are.
I have calculated this by putting the equations into Excel as well ( I do not have the ToolPack). The 10-15 year linear regressions for a number of examples and they were in the range 0.04-0.08.
The entire thread begins here:
http://joannenova.com.au/2014/06/weekend-unthreaded-39/#comment-1493093
Looking forward to a response from Kevin.
- Brandis confuses right to be heard with right to be taken seriously
Composer99 at 22:47 PM on 7 May, 2014Warren, you state:
we know "about 0.75c per century" is not [alarming].
To paraphrase Dikran, whether some phenomenon is alarming or not is a question of the observer's attitude towards the phenomenon. After all, melting ice, changing weather patterns, and rapid ocean acidification don't have emotions.
You can be as alarmed or not, as you wish. What you can't do, if you want to be taken seriously (at least around here), is argue your case on the basis of misleading evidence (e.g. the material from Joanne Nova and Craig Idso), cherry picking (e.g. "ice-free Arctic in 2013" when the correct estimate is 2016 ± 3 years), and outright false claims (e.g. your comments about the "Hockey Stick", which others have noted has been substantiated over and over in the literature). If you persist in doing so you aren't likely to get any more polite reception than you are now.
Personally speaking, if you don't find an unprecedented temperature change, in geological terms, alarming (or at least potentially alarming), that's your lookout. Frankly it seems that you don't have the slightest grasp just how rapid and significant a 0.7-0.8°C change in global mean temperature over a single century is.
Regarding your (again, apparently reflexive) dismissal of 9+ metre sea level rise: the simple fact of the matter is that 9+ metre sea level rise would become inevitable, given sufficient unabated warming. It would take a few centuries to happen (even worst case scenarios for 2100 call for no more than 2 metres of sea level rise IIRC), but it would be inevitable (because, surprise surprise, ice tends to melt as temperatures rise, and there is a lot of ice locked up in the Greenland & Antarctic land ice sheets).
- Brandis confuses right to be heard with right to be taken seriously
Glenn Tamblyn at 17:54 PM on 7 May, 2014Warren
Regarding your 2nd link, this is a small excerpt from a paper Nordt et al here. Quite a technical paper about variations in the proportion of C3 & C4 plant in the US Great Plains over the last 12 kyr+
Here is the conclusion from the paper:
"Conclusions
The delta 13C and delta %C4 from organic carbon of buried soils within the mixed and shortgrass prairie of the North American Great Plains permits a regional analysis of C4 grassland dynamics for the past 12ka. The delta 13C data compiled from a literature review of buried soils reveal that C4warm season grasses were present throughout the Great Plains study area during the past 12ka, but that there were appreciable fluctuations with 0.6 and 1.8ka periodicities. The crossover latitude of equal relative production of C4 and C3 plants appears to have been several degrees to the south of the modern location of 46 deg N prior to 6.7ka, with a shift to near the modern position after 6.7ka.
Relative C4 production did not increase monotonically in response to orbitally forced insolation between 12 ad 6.7ka, apparently because of a negative feedback from the presence of the LIS, glacial lakes in the northern plains, and cool glacial meltwater pulses into the Gulf of Mexico and North Atlantic. Thereafter, fluctuations in solar irradiance provided a more direct influence on delta %C4 as outflow of warm subtropical air from the Gulf of Mexico became established, interrupted periodically by warm, dry westerly flow contributing to episodes of drought. Here, increased delta %C4 occurred during intervals of elevated solar irradiance and with shifts in the ITCZ into the northwest Gulf of Mexico in the absence of ice-rafting events in the North Atlantic.
The coherency in our buried soil record with pollen spectra, marine cores, and ice cores, demonstrate the reliability of C4 plant dynamics not only as a proxy for grassland evolution but for climate as well. More work is needed to better understand grass dynamics in the early Holocene in response to conflicting reports of whether conditions were warmer or cooler than present. The paradox in the middle and late Holocene is that positive delta %C4 anomalies correspond with periods of dune activation. More work is needed to understand why during drought conditions C4 plants flourished. No doubt, C4 plants were responding positively to elevated temperatures as they should, but either these grasses thrive during drought or were growing between drought events during periods of landscape stability.
Hopefully our work will spawn further investigations into grassland dynamics of the past, provide additional parameters for climate and biome modeling, and create a better understand C and N dynamics in a region that is poorly understood"
So what exactly is the relevance and more importantly significance of your 2nd link?
Then there is this graph from Nordt et al. Seemingly one of the graphs that your graph was based on.

Whereas your looks like this: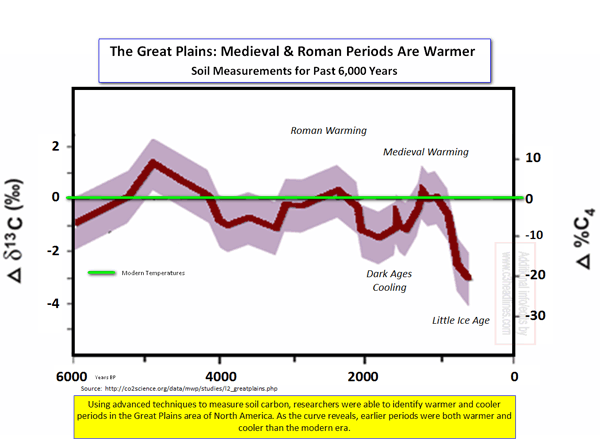
Sort of a bit different isn't it when you leave half the data off. Because the Nordt paper was looking at some quite complex local climatic issues as the Laurentide Ice sheet melted and so on. Again not exactly global.
So who produced this truncated graph that could o easily mislead people? Well lets quote Jo Nova "Thanks to the Craig Idso at CO2Science for compiling so many of these on his site.". Interesting concept don't you think. Truncating graphs and cherry-picking is 'compiling'?
As to your third graph and some more from Craig Idso, try reading this. Note particularly the section labelled CO2 Non-Science on how CO2Science misrepresents Oppo el al (2009).
Here is your graph as shown in Otto et al (b)

Notice the '1997-2007 mean annual SST' line that Craig Idso at CO2Science 'compiled' away in your version and replaced with another line that is not on the original, is not identified, and might suggest well sumfink or uver.

Finally Warren. If you wish to discuss science here with people that's great. But please make them your opinions or the published science itself. Not a blogger said that another blogger said that ... well you get the picture.
Just doing a copy and paste from an old Jo Nova blog doesn't really count as making your own argument does it? Its sort of insulting to everyone here.
- Climate dollars and sense – preventing global warming is the cheap option
KR at 04:12 AM on 23 April, 2014I've had this very discussion on a few of the pseudoskeptic blogs (such as here), pointing out that mitigation is far less expensive than adaptation to climate change under a Business as Usual (BAU) economic strategy. And that if the pseudoskeptic is concerned about economic consequences, BAU is probably the worst choice possible.
The usual responses are sputtering (often accompanied by links to something by Lomborg, whose work has issues such as discussed above) or changing the subject. Sigh.
- Why rainbows and oil slicks help to show the greenhouse effect
KR at 10:19 AM on 6 February, 2014joeygoze - Kerry wasn't just giving an unsupported opinion regarding national security, either. Top U.S. Admiral: Climate Change Biggest Threat.
Other notes - claims that the greenhouse effect doesn't exist are, sadly, neither rational nor rare. They come up time and time again on pseudoskeptic blogs. And as to your quotes about 2013? You appear to have overlooked the qualifiers, such as in "...it could happen in as little as 7 years", not a sole prediction of that single year, and as such you are presenting a strawman argument.
- Corrections to Curry's Erroneous Comments on Ocean Heating
Philip Shehan at 18:32 PM on 1 February, 2014While it is good to sea evidence that heat is indeed being taken up by the oceans, the “pause” in atmospheric temperatures is indeed a myth based on a poor understanding of statistics. Permit me to reproduce part of argument I posted at Jo Nova’s blog.
The first rule of statistics is make sure your sample size is big enough for your result to be meaningful.
"That is where end points come in. It’s not really the end points that matter as such, but the number of years between the endpoints, or how big the data set. That is why I harp on about short data sets. Because of the “noise”, relatively minor variations in temperatures between different data bases can lead to significant differences between linear fits for short time frames. With longer time frames the signal to noise ratio improves and there is good agreement between the linear fits.
When comparing the two satellite data bases UAH and RSS which began in 1979, the regression lines are quite different for 15 years but very similar since 1979.
But the real problem is not apparent from just looking at the regression lines. They do not show how the error margins blow out for short data sets.
http://www.skepticalscience.com/trend.php
For both the RSS and UAH data from 1979, there is a statistically significant warming trend.
UAH Trend: 0.138 ±0.070 °C/decade (2σ)
RSS Trend: 0.125 ±0.069 °C/decade (2σ)For data since 1999, the error margins are so large that it cannot be said with any confidence that the data shows warming, cooling or a pause.
UAH Trend: 0.146 ±0.212 °C/decade (2σ)
RSS Trend: 0.027 ±0.211 °C/decade (2σ)Although the linear regression line values are quite different, the error margins mean that there is considerable overlap between the 95% confidence limits so the two data sets are in fact in statistical agreement.
Returning to the matter of end points. If moving an end point by a single year makes a large difference to the trend line, it is a sure sign that your data set is too short and the results not statistically meaningful.
From 1999 UAH Trend: 0.146 ±0.212 °C/decade (2σ)
From 1998 UAH Trend: 0.060 ±0.223 °C/decade (2σ)Note again that the large error margins means the trends are statistically in agreement, but cannot tell whether the data shows a warming or cooling trend."
- Why climate change contrarians owe us a (scientific) explanation
Brendon at 19:35 PM on 11 October, 2013Joanne Nova attributes the warming to "Something other than CO2", but she's just not sure what.
Then when I explained that she had not presented any science to rebut the attribution studies, nor had she provided any evidence to show something else was to blame, I was placed into permanent moderation.
http://itsnotnova.files.wordpress.com/2013/10/novamod.png
This seems to be a pattern on Nova's forum.
- Latest myth from the Mail on Sunday on Arctic ice
hank_ at 01:25 AM on 19 September, 2013Here's the thing, IMHO. We might have won this small battle, here, (with a video that many will not see), but we may be losing the mainstream media war.
See this article from Joe Nova (prominent Aussie skeptic).
joannenova.com.au/2013/09/skepticism-goes-mainstream-a-tipping-point/
Many may not like what she is saying but she has a valid point. Skeptics are getting airtime on 'big stages' so to speak, WSJ, Washington Times, Finacial Post, Daily Mail, etc. We can laugh at them and call them deniers but is the "rebuttal" message really getting out there as strongly as the skeptic talking points?
- Did Murdoch's The Australian Misrepresent IPCC Chair Pachauri on Global Warming?
Philip Shehan at 16:33 PM on 3 March, 2013Tom Curtis, I hope it is not too much of topic to direct you to my comments #60 and #65 on Mockton's official complaint to the University of Tasmania calling for acadenic Tony Press to be sacked, accusing him of fraud and deception for merely disputing Moncktons argumements. My description of Monckton's conduct uses terms that while entirely correct would probably be struck out here. "Ludicrous" is one should pass muster.
It's on Jo Nova's blog.
- 16 years - Update and Frequently Asked Questions
KR at 05:53 AM on 15 February, 2013Something I pointed out on JoNova, where this silly 16 year claim rose once again (sigh)...
Examining any time-span starting in the instrumental record and ending in the present:
- Over no period is warming statistically excluded.
- Over no period is the hypothesis of "no warming" statistically supported WRT a null hypothesis of the longer term trends.
- And over any period with enough data to actually separate the two hypotheses – there is warming.
- Ocean Heat Came Back to Haunt Australia
colinkirk at 23:45 PM on 16 January, 2013
I lived in Australia for over 30 years and it's a hot country in January! (perihelion was in early Jan). With regards to 'records':
http://joannenova.com.au/2013/01/australia-was-hot-and-is-hot-so-what-this-is-not-an-unusual-heat-wave/
Thoughts? - A vivid demonstration of knee-jerk science rejection
Bernard J. at 20:07 PM on 16 September, 2012
I'd encourage all Australian academics and non-university scientists to contact Chris Evans and ask him to take an explicit stance defending peer-reviewed and institutionally overseen work such as Lewendowsky's.
Stephan's work is demonstrably compliant with the federal government's HERDC specifications that define what constitutes an acceptable standard of research. These are the standards that set the bar for the highest level of research at Ausatralian universities.
The paper qualifies as an A1 publication, and it is published in a journal that is recognised by UlrichsWeb and Thomson Reuters Master Journal List as being scholarly and peer-reviewed.
That Joanne Codling sees fit to interfer with appropriately-conducted tertiary level research, simply for her own political ends, is reprehensible.
And it should be pointed out that Lewendowsky's work took not a cent from cancer research. If it prevented anything at all, it was possibly the slim chance that a climate change denialist might have tried to scam a publication trying to link climatologists to the conspiracy and fraud that Codling and her ilk perceive under every bed. - Monckton Misrepresents Reality (Part 3)
Tristan at 01:32 AM on 30 July, 2012
Monckton tries his hands at some anti-Muller math. - Madness over sea level rise in North Carolina
Tristan at 23:46 PM on 21 July, 2012
Richard Pearson is the Noosa LNP member who proposed that anti-science motion Bernard linked to.
He just commented over at JoNova's blog. Not that I recommend the link. The fact that he's even there is a sad indictment of where Australian politics is at the moment. - Models are unreliable
Clyde at 05:21 AM on 1 June, 2012
Sorry about the post above.
More evidence the computer models are not good at predicting future climate change.
One minor "type O" & things come out wrong. - Why Are We Sure We're Right? #1
Doug Hutcheson at 11:37 AM on 23 April, 2012
bill @ 63, I gave up reading the comments at JoNova, after finding this gem:It is probable that oil existed before plant life – that fossils found in coal are merely plant life enveloped in solidified oil.
And this one:“‘controlling the natural flux of CO2 is ... a fool’s errand to try”"
Sigh.
How do we get this message into the public domain after so many years of “scientific” indoctrination in schools?? - Why Are We Sure We're Right? #1
bill at 14:23 PM on 22 April, 2012
dikran, caerbannog,
Connoiseurs of the true train-wreck should really take time to savour what happens here [HVR* warning] to even one of the faithful where he dares point out that Salby's Emperor is, um, starkers!...
*Head-Vice Required. - Solar Cycle Length proves its the sun
KR at 10:07 AM on 30 March, 2012
BernhardB - Actually, the appropriate topic for your argument is the interminable Greenhouse effect and the 2nd Law thread.
This is one of the classic 'skeptic' arguments, demonstrating serious shortcomings in physics knowledge, that quite frankly makes 'skeptics' look bad. Some have realized this - for example both Fred Singer and JoNova have weighed in, pointing out that this is a bad argument, and reflects (backradiates?) rather poorly on skeptics in general. - It hasn't warmed since 1998
s0nathan at 03:38 AM on 11 March, 2012
I am trying to find a response to the data collected by Dr David Evans. It show climate modeling has not proceeded as predicted

and flattening in the ARGO data.

Four fatal pieces of evidence
- A mishmash of Monckton misrepresentation
Adam at 23:47 PM on 18 February, 2012
John Cook, why do you not reference Monckton's extremely detailed reply to Abraham. Abraham has not been able to answer any of the points that Monckton brought up, and he himself has actually surrendered to Monckton, as he has been forced to significantly edit his original video.
'Response to John Abraham' by Christopher Monckton
Abraham surrenders to Monckton. Uni of St Thomas endorses untruths. - Plimer vs Plimer: a one man contradiction
Bernard J. at 01:11 AM on 10 December, 2011Plimer contradicting Plimer is not an isolated incident. One of his pet arguments is that carbon dioxide has been much higher in the past, without the Earth going into meltdown. He concludes that carbon dioxide can't have much of a warming effect. There's a major flaw in this line of thinking. The further back in time you go, the cooler the sun gets. If it wasn't for the warming effect of carbon dioxide, the Earth would've been a frozen iceball throughout much of its history.
Curiously, Joanne Codling reproduces a screed by Gina Rinehart saying the same thing.
I was gobsmacked to see that Codling reproduced Rinehart's points 1 and 2 in immediate succession, without apparently even blinking at the inherent internal contradiction of Rinehart's propaganda.
Well, perhaps not gobsmacked. Codling long ago proved that she has no demonstrable grasp of science, for all her vaunted involvement with scientific education of children. - David Evans' Understanding of the Climate Goes Cold
oneiota at 20:55 PM on 18 November, 2011
@39
Mark I followed your link and somehow ended up at jonova's site
Wow that is a mud wresting pit! KR to great credit has taken up the argument and the rebuttal is sound and patient but alas it has fallen on "itchy ears".
The argument is not one that can be won by science alone I fear.
A biblical quote applies:
"2 Tim 4:2 Preach the Word; be prepared in season and out of season; correct, rebuke and encourage--with great patience and careful instruction.
2 Tim 4:3 For the time will come when men will not put up with sound doctrine. Instead, to suit their own desires, they will gather around them a great number of teachers to say what their itching ears want to hear.
2 Tim 4:4 They will turn their ears away from the truth and turn aside to myths."
From what I have learned here each of the four points (myths perpetuated) raised by Evans can be debunked but the deaf cannot hear the truth above the noise trapped in their heads. - Visual depictions of CO2 levels and CO2 emissions
Tristan at 22:34 PM on 3 November, 2011
Lots of crowing that the theory of AGW has again been put to death due to patently poor reporting. Plenty of allusions that John was 'fired' from the site he posts on for revealing such earth shattering information. - Is there a case against human caused global warming in the peer-reviewed literature? Part 1
macoles at 13:49 PM on 3 November, 2011
It would be worth clarifying that Jo Nova's real name is Joanne Codling (perhaps in her hyperlink?), as presumably she wouldn't be able to use her stage name in a peer reviewed journal :) - A Scientific Guide to the 'Skeptics Handbook'
Tristan at 00:35 AM on 22 October, 2011
Has there been a rebuttal to JoNova's response?
Her claim:
"Indeed when I have bothered to debunk Cook, Cook had no reply, and didn’t apologize for all his errors, or his use of a flagrantly deceptive graph either." - Hockey stick is broken
Roh234 at 11:56 AM on 14 September, 2011
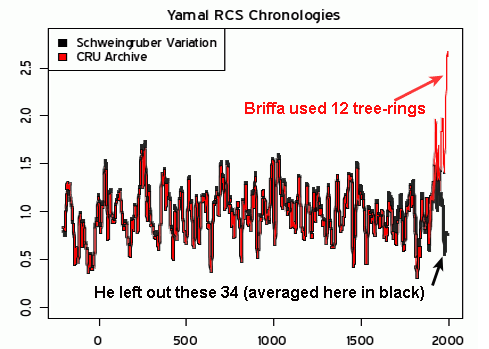
Hey I'm new to this fourm but Steven McIntyre has got a rebuttal to his rebuttal and a rebuttal to any new hockey sticks. here is a reconstruction showing Briffa's exclusion of data and what it really is supposed to be.

From the Keigwin 1996 study.


I will debate the Heat Island Effect on the specific section which I challege the graphs provided here. - Hansen's 1988 prediction was wrong
wingding at 21:02 PM on 3 April, 2011
Another misleading analysis of Hansen's 1988 scenarios
this time bob carter and david evans getting it hideously wrong.
Note the substitution of tropospheric temperatures when the projections were for surface temperatures.
Note the complete disregard of non CO2 greenhouse gases in order to claim scenario A best fits reality. Check the comments. There is a quote mine of Hansen 1988 to support that disregard.
Worse of all a complete lack of research. It's like they haven't even bothered reading any analyses of the 1988 scenarios, including in some of hansen's later papers. Like they didn't even use google.
There's enough wrong in that article for a skepticalscience correction imo. If you google some of the text in the article you will find it's been copy pasted around over the years.
Another bad thing is how none of the commenter seem to know it's wrong. - Climate sensitivity is low
hank at 04:56 AM on 28 February, 2011
Oh. My.
"co2isnotevil: February 10th, 2011 at 8:53 am
"... looking up during the day you will see both primary and secondary IR directly originating from the Sun. This is not ‘back radiation’, but forward radiation from the Sun. Trenberth likes to call this ‘back radiation’ in order to give the false impression that GHG’s radiate this much."
(from the joannenova thread still in progress).
____________
'The question is,' said Alice, 'whether you can make words mean so many different things.'
'The question is,' said Humpty Dumpty, 'which is to be master ...' - Climate sensitivity is low
hank at 04:25 AM on 28 February, 2011
Oh.
Jan 13, 2011 ... Guest Post by George White. Evolution of an Energy Budget ..... Trenberth's atmospheric window includes 40 W/m^2 coming from the surface and ...
joannenova.com.au/.../half-of-the-energy-is-flung-out-to-space-along-with-the-model-projections/ - Climate sensitivity is low
RW1 at 16:51 PM on 22 February, 2011
I'm willing to be shown incorrect on this issue (and I believe George is too), but you're talking around the crux of the issue. Words like "should" and "everyone else" isn't evidence to the contrary, and more importantly doesn't answer the fundamental question. In another thread, you said the total additional absorbed infrared from models/simulations from 2xCO2 was 7.4 W/m^2.
And why haven't you said all this to George on his article and post on the issue at joannenova that you linked? - Climate sensitivity is low
KR at 14:59 PM on 21 February, 2011
scaddenp, RW1 - George White has stated that running the HITRAN models results in an imbalance of 3.6 W/m^2 (here, post #19).
And then he, for some reason, halves that value. Which I cannot consider as other than a blatant mistake. - Monckton Myth #2: Temperature records, trends and El Nino
Roughyed at 09:20 AM on 18 January, 2011
@ Robert Way #5
Phil Jones has stated recently that with fuller data for 2010 the last 15 year trend comes up to the 95% level.
See here -
http://www.monbiot.com/archives/2010/12/08/impervious-to-learning/
I guess it semantics of Feb 1995 to Feb 2010 from when he made his interview to the BBC, or Nov 1995 to Nov 2010 when he made comments in the Monbiot piece.
Also heres a link to the trends I think probably Monkton uses, they don't seem to match yours but state they are from Hadley data?
Jo Nova Graph - The Physical Chemistry of Carbon Dioxide Absorption
co2isnotevil at 15:43 PM on 14 January, 2011
hfranzen,
Your energy balance on page 19 is relatively close to mine as discussed here.
Your 302 W/m^2 of total absorption is close to my 292 W/m^2 and it is generally assumed that CO2 is about 1/3 (I calculate it as about 31%), which is why your 107.6 W/m^2 for CO2 alone may seem reasonable. However, my CO2 only absorption is for the clear sky, while the composite absorption (your 300 and my 292) is the cloud percentage weighted clear sky and cloudy sky absorption.
One other point is the run I did for the earlier data was not at the average surface temperature, but the percentages are all correct, so the actual power absorbed is the percentage times your emitted surface power.
Reading more of your paper, on page 24, you don't acknowledge that most of the power emitted by the atmosphere is not by greenhouse gas emissions, but is the BB radiation emitted by the rest of the atmosphere which has been warmed by GHG's. If you have any doubt that a heated gas emits BB radiation, consider that the photons from the Sun are BB radiation of the heated Hydrogen in the upper layers of it's atmosphere. Consider that we can measure the temperature of interstellar gas clouds by observing them in the IR.
The picture on page 32 makes no sense. Is it CO2 absorption for Venus or something? The composite absorption of the Earth looks more like this.
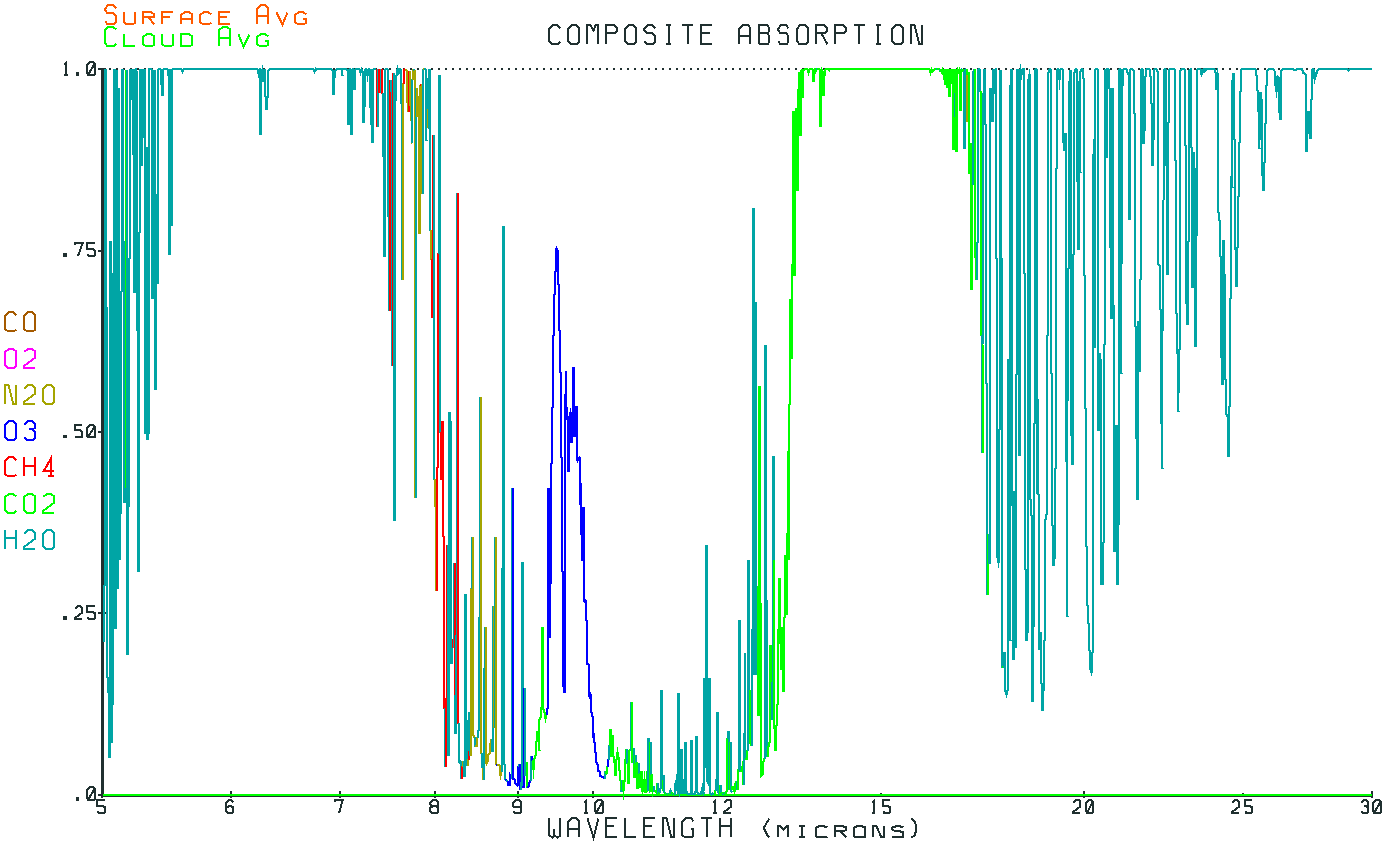
The colors indicate which gas is most responsible for each wavelength bucket. The image is shrunk a lot, so open it for a high resolution view.
The wave;ength resolution I've used is a logarithmic scale of about 26K buckets per decade with calculations performed over 4 decades from .1u to 1000u which is orders of magnitude finer than the spectral resolution you are using. I've also found that large wavelength buckets are not very accurate.
At this point it seems that you have 11 wavelength buckets spread between 9 and 19 microns, while my analysis covers over 100K logarithmic wavelength buckets between .1u and 1000u, moreover; my analysis with HITRAN data is far more accurate than yours using the Burch et all CO2 data. Whether or not your math is correct, which as far as I can tell looks OK, I know that the limited data you are starting from is insufficient to establish what you're trying to show. - Lindzen and Choi find low climate sensitivity
KR at 08:40 AM on 28 December, 2010
Aha! I have found that "co2isnotevil" is actually George White (look for 'co2isnotevil'), creator of the http://www.palisad.com/co2 website referred to by RW1.
Mr. White, please note my comments about your website in this post, also note that your slide presentation appears to be list of the top 20 skeptic arguments debunked here. My apologies, but I cannot take your comments seriously when you have such misinformation on your web site. - Quantifying the human contribution to global warming
TOP at 23:57 PM on 3 September, 2010
Looks nice until you put it in context including H2O.
CO2 closes off the right hand side of the H2O absorption band and CH4 contributes to the left hand side. One thing that is clear from this graph is that climate sensitivity changes with absolute temperature.
The total spectrum of all atmospheric gases is given in the bottom plot. This shows a "window" between 0.3 and 0.8 microns (the visible window), which allows solar radiation (without the lethal UV component) to reach the earth's surface. "Earth radiation", the upwelling infrared radiation emitted by the earth's surface, has a maximum near 10 microns. The total atmosphere plot shows that a narrow window (except for an oxygen spike) exists in the range of wavelengths near 10 microns.Iowa State
The effect of CO2 on absorption of IR and re-radiation is not linear as the equations above suggest. Once a certain level is reached adding another molecule has much less effect. Think of window shades. Once they are shut, closing them more has little or no effect. Nor does a decrease in CO2 below 280ppm cause a negative forcing which the equation for dF suggests. The absorption bands (wavelength regions) for carbon dioxide are nearly saturated, but those for other gases are not, so one additional molecule makes a larger impact.
Iowa State
CO2 is about saturated so adding more has little effect compared to other GHG which are not saturated.

Iowa State - Sea level rise: the broader picture
JMurphy at 20:12 PM on 31 August, 2010
miekol wrote : "Is science sea levels different to island sea levels?"
Don't know what that means but science at Joanne Nova's site (which you have just linked to) is different from science in reality. See :
How Jo Nova doesn't get past climate change,
How Jo Nova doesn't get the CO2 lag,
How Jo Nova doesn't get the tropospheric hot-spot,
A Scientific Guide to the Skeptics Handbook.
Is that the best you can do ? - Sea level rise: the broader picture
miekol at 19:31 PM on 31 August, 2010
Is science sea levels different to island sea levels?
http://joannenova.com.au/2010/08/south-pacific-sea-levels-no-rise-since-1993/ - Newcomers, Start Here
Pete Ridley at 07:12 AM on 18 August, 2010
John, not everyone agrees with what you claim this site is all about. While searching for more information on positive feedbacks I happened across this beauty from Joanne Nova (http://joannenova.com.au/2010/08/skeptics-iphone-app-endorsed-de-facto-by-critic/#more-9801).
QUOTE: .. Cook runs the ambush site SkepticalScience.com. .. SkepticalScience.com is a parody of skepticism. It is “skeptical of the skeptics” .. but it accepts everything offered up by Authorities as if it is the Word of God. “NOAA can do no wrong” (and was that NOAA or Noah?)
All of the points held up by Cook are weak “whatever” issues: things that are hardly a flaw. He’s noticed that the disorganized mass of real skeptics sometimes disagree with each other, golly gee, which proves we think for ourselves and don’t answer to a higher bureaucracy. John Cook — who so wants to be seen as skeptical – instead is anything but, and conforms strictly to the text-book litany as written by the IPCC.
.. Cook of course, doesn’t quote directly. This is a classic modus operandi for unskeptical scientist. If they quote directly, they can’t impute things, like “sceptics citing this fact as if it’s never occurred to climate scientists”, which we don’t say, but Cook says, thus creating a strawman. Why would he bother stringing out this kind of weak speculative stuff if he actually had something real to attack?
He makes preposterous claims that skeptics cherry-pick, focus on small picture, never on the big picture; except the graphs the skeptics use cover the last 30 years, the last 1,000 years, the last 10,000 years, the last 500 million years. There’s no period we won’t talk about — unlike the AGW crowd, for whom a trend is between 10 and 50 years (to get the last warming period 1975 – 2001 in) and who don’t want to talk about the little ice age or medieval warm period. Unskeptical scientists think “long term” means 100 years and repeat graphs from 1880 -2010 ad nauseum. They weren’t exactly producing billboards with graphs of the last 500 million years. UNQUOTE.
I couldn’t have described it better myself.
Best regards, Pete Ridley - Models are unreliable
Pete Ridley at 07:12 AM on 11 August, 2010
Jo Nova’s blog has an interesting new article “The models are wrong (but only by 400%) ” (Note 1) which you should have a look at, along with the comments. It covers the recent paper “Panel and Multivariate Methods for Tests of Trend Equivalence in Climate Data Series” (Note 2) co-authored by those well-known and respected expert statisticians, McIntyre and McKitrick, along with Chad Herman.
David Stockwell sums up the importance of this new paper with “This represents a basic validation test of climate models over a 30 year period, a validation test which SHOULD be fundamental to any belief in the models, and their usefulness for projections of global warming in the future”.
David provides a more detailed comment on his Niche Modeling blog “How Bad are Climate Models? Temperature” thread (Note 3) in which he concludes “But you can rest assured. The models, in important ways that were once claimed to be proof of “… a discernible human influence on global climate”, are now shown to be FUBAR. Wouldn’t it have been better if they had just done the validation tests and rejected the models before trying to rule the world with them?”.
Come on you model worshipers, let’s have your refutation of the McIntyre et al. paper.
NOTES:
1) see http://joannenova.com.au/2010/08/the-models-are-wrong-but-only-by-400/#more-9813
2) see http://rossmckitrick.weebly.com/uploads/4/8/0/8/4808045/mmh_asl2010.pdf
3) see http://landshape.org/enm/how-bad-are-climate-models/
Best regards, Pete Ridley - How Jo Nova doesn't get the CO2 lag
Bill Stoltzfus at 01:52 AM on 7 July, 2010
I was looking at the Vostok graphs at Nova's site (specifically the last one), and was wondering about a couple of things. Perhaps I should ask this first, though--is her graph a valid one to look at, or is there a better one?
There are a few places where the temp and CO2 lines go in opposite directions, or don't seem to follow the lag rule. Around 50,000 years ago they don't match up well. 160,000 to 170,000 years ago there are several temp spikes with no CO2 movement. About 375,000 years ago temp spikes while CO2 continues downward.
I realize these are only a few places out of hundreds of thousands of years of history, and you've said before that CO2 is not the only climate driver, and it's possible that the time resolution isn't detailed enough to show all of the movements, but I am wondering what effects could suspend or negate the CO2 lag? Is the concentration change in CO2 not enough to overpower other effects?
Thanks. - How Jo Nova doesn't get past climate change
danielbacon at 04:08 AM on 24 June, 2010
David Grocott Are you using witchcraft here? Are you a witchdoctor?
http://joannenova.com.au/2010/06/pnas-witchdoctors-of-science/
Real question, do you have a graph of polar land masses for these times? Like our current glacial- inter- glacial is link to the current location of Antarctica. (As well as the snow ball periods to polar land mass at that time)? - How Jo Nova doesn't get past climate change
Doug Bostrom at 03:26 AM on 24 June, 2010
Thanks you for your original post as well as your timesheet, David.
Remarking on work performed elsewhere, David says:
'What is clear is that it has now taken me 1,739 words, at least four peer-reviewed scientific studies, the IPCC's Fourth Assessment Report, various blogs and websites, and several days, to tell precisely no-one (congratulations if you're still reading), why they should partially refute what Jo Nova has told 200,000 people in 7 words. Those 7 precious words being: "Paltridge found that humidity levels have fallen."'
In our neighborhood we have a problem with kids "tagging" various objects with graffiti. The artwork appears to be faddish, with some few youngsters capable of creating an original style, the rest slavishly following. Only a few seconds are required to deposit nominally insubstantial paint just microns thick on a wall. Hours are needed to remove each occurrence of the blight, sometimes it's impossible to entirely undo the scar and inevitably the cycle of giggle-spray-grumble-remove will repeat itself. Graffiti tagging is childish vandalism especially annoying because it's lazy, usually unoriginal and at the same time imposes a disproportionate amount of effort to undo.
To my mind Joanne Nova and her ilk are graffiti artists vandalizing our collective intellect, contributing to cultural dementia. What's different is that thanks to the Internet Nova's can of spraypaint tags minds across the entire globe. - How Jo Nova doesn't get past climate change
Glenn Tamblyn at 19:42 PM on 23 June, 2010
David/John
A great set of posts so far. I have spent some time at Jo's site, trying to argue with her followers about the range of fallacies in her 'handbooks' - have a look at some of the early posts associated with her 'debate' with Andrew Glickson. Have a look at some of this
http://joannenova.com.au/2010/04/no-dr-glikson/#comment-43990 and others
What I find intriguing is how different supposed arguments can be contraditory or interlinked and yet this dosen't get commented on.
The 'missing hotspot' which isn't missing, and on the same graphic the stratospheric cooling.
The deep paleoclimate record mentioned here seems strange until you factor in long term changes in Solar output. Then it starts to make sense. Then the fact that CO2 is an integral part of explaining the deep paleoclimate record also says that the 'Its Saturated' or 'It can't do much more' arguments are totally invalid. So they hinge on the Standard Solar Model.
Actually I am quite surprised that advocates of AGW don't push the deep paleoclimate aspect more strongly. It is a very strong argument for the major future impact of CO2 since it actually addresses a range of sceptic arguments - Saturation, It can't do much more, Feedbacks, Climate Sensitivity, etc.
What things were like 500 Myr ago may not have resonance with the lay public, but if its significance could be conveyed strongly, it is a powerful argument.
As another thought John. You might like to consider a challenge (since we all have so much spare time & energy available to devote to this in amongst the rest of our lives). Invite Jo to supply a series of guest posts here, with you supplying a series of posts on her site. Specific subjects such as topics from her Handbooks. And focused on the science, not 'warmists said...' or 'denialists said...' Gore & Monckton are not invited. And a great time was had by all. - The significance of the CO2 lag
monckhausen at 04:19 AM on 19 May, 2010
Addendum:
Human-emitted CO2, in contrast to the ocean-emitted CO2, does not lag, it is emitted instantaneously. Following the logic applied by 'skeptics' like Joanne Nova, something 800 years ago must have triggered our present human CO2 emissions. This, of course, does not make any sense.
However, since oceans and humans can emit CO2 simultaneously, CO2 can lag and lead at the same time, depending on its source.
monckhausen
http://friendsofginandtonic.org/ - 2009 - 2nd hottest year on record while sun is coolest in a century
D Kelly O at 07:44 AM on 17 January, 2010
John P has placed his exact same comment on The Blackboard as comment 30360 of Lucia's GISS December Anomaly update. http://rankexploits.com/musings/2010/giss-december-anonaly-0-59c-down-from-0-68c/#comments
John from Mn submitted the exact same comment to Watts Up With That http://wattsupwiththat.com/2010/01/15/uah-satellite-data-has-record-warmest-day-for-january/ post on UAH trends.
John also placed the exact same comment on The Air Vent http://noconsensus.wordpress.com/2010/01/15/1934-1998-gissmatic/
Here's another: http://joannenova.com.au/2010/01/climategate-arrives-in-the-us/
John P doesn't care about the topic, he justs repeats himself.
Has anyone found John P or John from Mn repeats? Let's see how many we can find. - Can you make a hockey stick without tree rings?
ProfMandia at 06:47 AM on 5 December, 2009
JoNova makes many, many false claims. Her Skeptic's Handbook is filled with claims that have been debunked countless times.
1) Joanne Nova did not do her research or did so without due diligence.
or
2) Joanne Nova is intentionally misleading the general public. - Can you make a hockey stick without tree rings?
Leo G at 04:39 AM on 5 December, 2009
Leto,
try here -
http://joannenova.com.au/2009/12/fraudulent-hockey-sticks-and-hidden-data/
an excellent graphic representation of the MWP.
Warning, Jo is a strong sceptic, so though the graphic is of immense value, her writing style is quite brunt


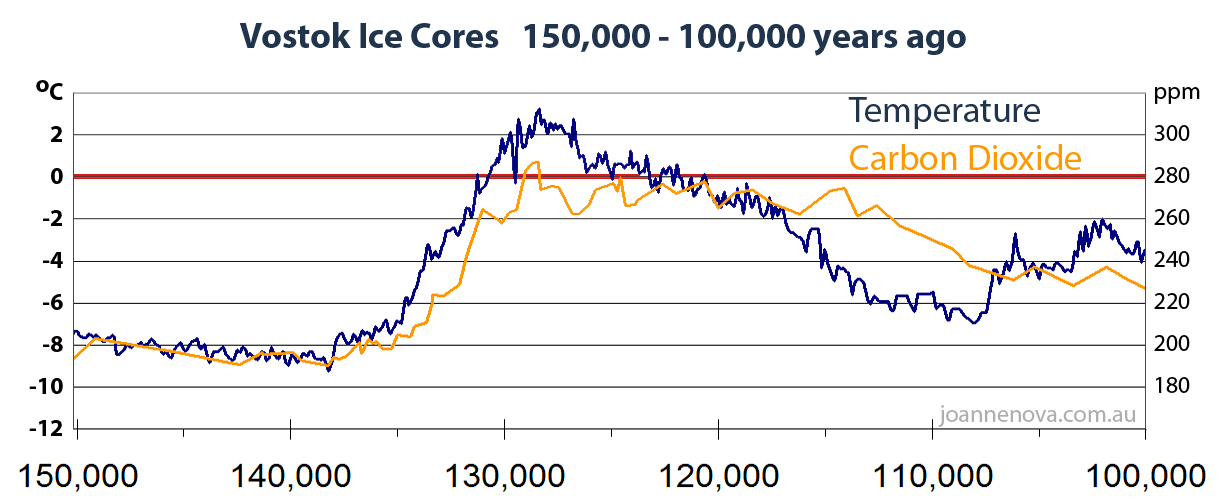
THE ESCALATOR

(free to republish)