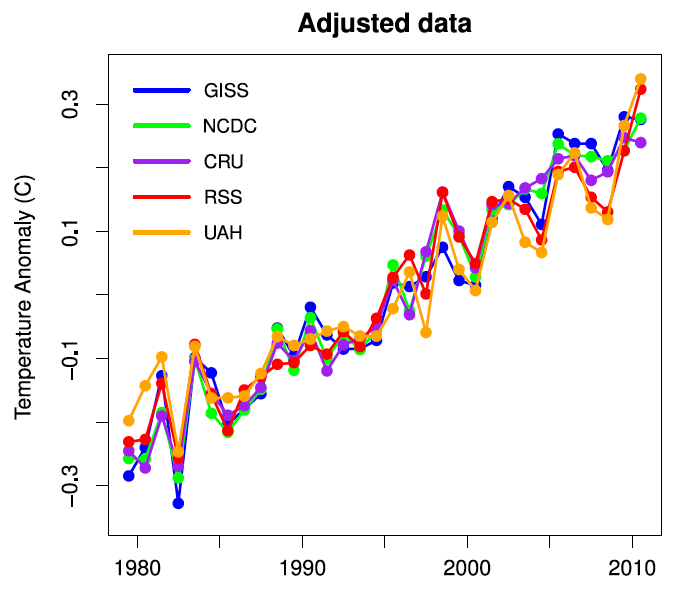
Foster and Rahmstorf (2011) have published a paper in Environmental Research Letters seeking to extract the human-caused global warming signal from the global surface temperature and lower troposphere temperature data. In order to accomplish this goal, the authors effectively filter out the effects of solar activity, the El Niño Southern Oscillation (ENSO), and volcanic activity. The result is shown in Figure 1 below.
Figure 1: Annual averages of the adjusted data - the global warming signal
Foster and Rahmstorf characterize ENSO by using the Multivariate ENSO Index (MEI), aerosol optical thickness data (AOD) for volcanic activity, and solar irradiance data (from PMOD) to characterize solar activity. They also tried using Southern Oscillation Index (SOI) data for ENSO, sunspot number data for solar activity, and a volcanic radiative forcing reconstruction from Ammann et al. (2003), but found these changes made little difference to their results:
"None of these substitutions affected the results in a significant way, establishing that this analysis is robust to the choice of data to represent exogenous factors."
They approximated the influence of these exogeneous factors by using multiple regression of MEI, AOD, and PMOD on temperature data from GISS, NCDC, HadCRU, RSS, and UAH. Since those exogeneous factors can have a delayed effect on temperatures, they tested lag values from 0 to 24 months to see which best fit the data. The results are listed in Table 1.
Table 1: Warming rates in °C/decade for 1979-2010, and lag in months, for each of the five temperature records and each of the three exogenous factors. Numbers in parentheses are standard errors in the final digits of the estimated values.
As Table 1 shows, filtering out these external effects increased the 32-year warming trend in every data set except UAH. This analysis reveals that the underlying human-caused global warming trend in the surface temperature data ranges between 0.170 and 0.175°C per decade, and between 0.141 and 0.157°C per decade in the two main satellite lower troposphere temperature data sets.
This is a very similar result to Huber and Knutti (2011), who estimated that approximately 100% of the observed surface warming since the 1950s has been caused by human effects. This corresponds to approximately 0.55°C warming, most of which has occurred since mid-1970, for 0.15 to 0.20°C per decade anthropogenic warming, based on the Huber and Knutti results.
Additionally, we see that the lag before ENSO is reflected in surface temperature is 2 to 4 months, 5 to 7 months for volcanic effects, and 1 month for changes in solar activity. In the lower troposphere, the lags are 5, 5-6, and zero months, respectively. The authors conclude:
"When the fluctuations in temperature over the last 32 years (which tend to obscure the continuation of the global warming trend) are accounted for, it becomes obvious that there has not been any cessation, or even any slowing, of global warming over the last decade (or at any time during this time span). In other words, any deviations from an unchanging linear warming trend are explained by the influence of ENSO, volcanoes and solar variability....It is worthy of note that for all five adjusted data sets, 2009 and 2010 are the two hottest years on record....All five data sets show statistically significant warming even for the time span from 2000 to the present."
Overall, Foster and Rahmstorf find that ENSO has the largest impact on short-term temperature variations, followed by volcanic activity, with solar irradiance a distant third. However, the contributions of each factor to the 32-year temperature trends were very similar (Table 2, Figure 2).
Table 2: Trends in °C/decade of the signal components due to MEI, AOD and TSI in the regression of global temperature, for each of the five temperature records from 1979 to 2010.
Figure 2: Influence of exogenous factors on global temperature for GISS (blue) and RSS data (red). (a) MEI; (b) AOD; (c) TSI.
These factors contributed to very slight cooling of global temperatures over the past 32 years, with the execption of UAH, for which they have had no net impact on the trend. Figure 3 shows the temperature data before and after the Foster and Rahmstorf exogeneous factor removal.
Figure 3: Temperature data (with a 12-month running average) before and after the exogeneous factor removal
The authors conclude by averaging all of the data sets together (Figure 4):
"Because the effects of volcanic eruptions and of ENSO are very short-term and that of solar variability very small, none of these factors can be expected to exert a significant influence on the continuation of global warming over the coming decades. The close agreement between all five adjusted data sets suggests that it is meaningful to average them in order to produce a composite record of planetary warming. [Figure 3 shows] the true global warming signal."
Figure 4: Average of all five adjusted data sets.
Based on this average of all five adjusted data sets, the warming trend has not slowed significantly in recent years (0.163°C per decade from 1979 through 2010, 0.155°C per decade from 1998 through 2010, and 0.187°C per decade from 2000 through 2010). As Foster and Rahmstorf conclude,
"The resultant adjusted data show clearly, both visually and when subjected to statistical analysis, that the rate of global warming due to other factors (most likely these are exclusively anthropogenic) has been remarkably steady during the 32 years from 1979 through 2010. There is no indication of any slowdown or acceleration of global warming, beyond the variability induced by these known natural factors."
For more on this paper, see tamino's take.
Note: the Foster and Rahmstorf results have been incorporated into the rebuttals to It's the sun (Intermediate and Advanced), A drop in volcanic activity caused warming, It's El Niño, Global warming stopped in [insert year], It hasn't warmed since 1998, and It's cooling
Posted by dana1981 on Tuesday, 20 December, 2011
 |
The Skeptical Science website by Skeptical Science is licensed under a Creative Commons Attribution 3.0 Unported License. |