Sea levels around Australia are currently rising at a rate much greater than the global average, which is probably why there appears to be a surge in Australian skeptic activity strenuously resisting the implications of these observations. One of these said skeptics is Dr.David Evans, a self-described carbon cycle modeler.
In a recent video (starting at 6 mins 55 seconds), David Evans makes a number misleading comments on the continued warming of the oceans, and the rising sea level trend. Indeed many of his erroneous claims were also recently propagated by Cliff Ollier, a retired Australian geology professor. As ever, we'll discuss how and why Evans is wrong, but perhaps the most notable feature of his video clip is that David Evans utilizes key chararcteristics of scientific denialism to reach his ill-founded conclusions.
Before that though, a recap of some relevant background is in order. Informed climate blog regulars can skip the next three headings, as it'll be covering topics you're probably familiar with.
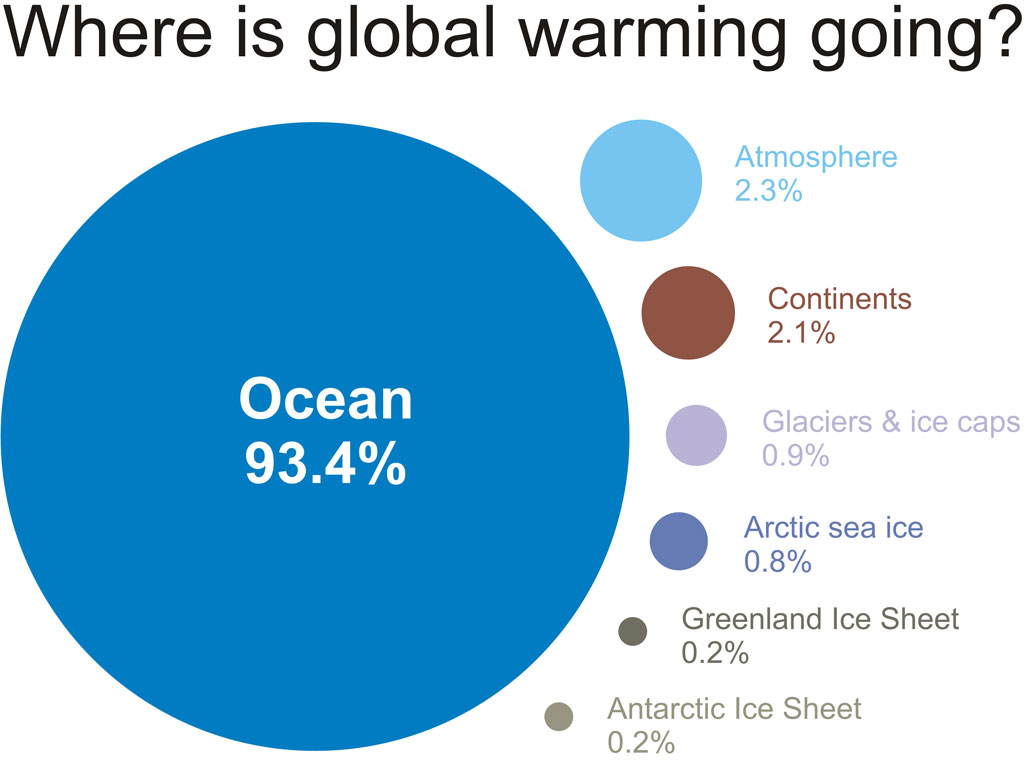
Sunlight entering the upper layers of the ocean is virtually the only means by which the oceans are directly heated. Greenhouse gases, such as carbon dioxide, not only trap heat in the atmosphere, but they also act to trap heat in the ocean too, causing the oceans to gradually warm over time. Considering that over 90% of global warming goes into the ocean, it is arguably the most significant effect greenhouse gases exert on the global climate.
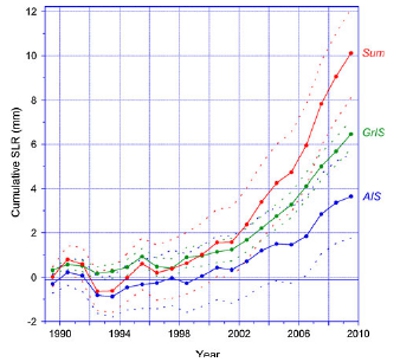
A direct consequence of this warming is that the extra heat causes ocean thermal expansion and sea levels rise as a result. The other contributor to sea level rise is the increase in water volume through the melt of land-based ice. Over the last few centuries almost all of the sea level rise has been due to thermal expansion, and the melt of mountain glaciers. In the last few decades that trend has changed; the main contributor to sea level rise is now the melt of the Greenland and Antarctic ice sheets (Leuliette & Willis [2011]) and this contribution is accelerating.
Figure 1 -Cumulative sea level rise contributions (1989–2009) from the Antarctic Ice Sheet (blue) and the Greenland Ice Sheet (green) and their sum (red). Dashed lines indicate uncertainty margins. From Van den Broeke (2011).
Despite the accelerating ice loss from the Greenland and Antarctic ice sheets, global sea level over the last two decades has been increasing in a near-linear manner, which suggests that the thermal expansion component has slowed over this period. The cause of this slower warming rate is yet to be definitively resolved by scientific research, but it is likely a number of factors have combined to bring about this sea level and ocean heat content trend. First and foremost, it is probable that an increase in human-caused air pollution (sulfate aerosols), over the last decade or so, has reduced the amount of sunlight reaching the ocean surface. These tiny reflective particles bounce some solar radiation back out to space before it can heat the ocean, but the more substantial effect they have is upon cloud formation.
Aerosols act as seed particles for clouds. Because they are more numerous and smaller than most naturally-occuring aerosols, manmade sulfate pollution create clouds that last longer because the clouds are less prone to forming large water droplets which fall back to Earth as rain. Not only that, but the smaller cloud droplets makes the clouds brighter. So the combined effect of the two processes is longer-lived and more reflective clouds.
A second contributor to the trend is a satellite-observed increase in the concentration of natural volcanic sulfate aerosols in the upper atmosphere, the stratosphere, (Vernier [2011]) which, again, has caused a slight reduction in the amount of sunlight reaching the ocean surface. This has trend has arisen due to greater emissions from tropical volcanoes. A global decrease in surface solar radiation from human-made and natural aerosols, plus cloud changes, has recently been measured (Hatzianastassiou [2011]).
And thirdly, the sun has a cycle or around 11 years, where there is a slight increase, or decrease in the amount of radiation it pumps out. For much of the last decade the sun has been on the downward (cooling) part of the cycle, but most significantly it is the coolest solar minimum the sun has been in for about a century. Once again, this solar cycle has reduced the amount of sunlight reaching the ocean.
A further confounding factor, as far as sea level rise is concerned, is the temporary 'potholes' and 'speedbumps' in sea level rise asoociated with La Niña and El Niño. During El Niño sea level rise abruptly rises as rainfall is concentrated over the oceans, and during La Nina sea level plunges when rainfall is concentrated over land. In the last decade La Niña has been dominant which has created a temporary reduction in the rate of sea level rise.
Despite these three opposing trends, the oceans continue to accumulate heat at the rate of two Hiroshima bombs per second, and the continued energy imbalance at the top of-the-atmosphere reveals there is further 'warming in the pipeline'. This implies a very strong warming influence from greenhouse gases has only been partially counteracted by these cooling effects in a warming vs cooling tug-of-war.
Of course not all of these factors are likely to persist. The solar cycle is already on its way to the peak of the next cycle, as the lag in ocean warming is around 18 months to two years there are around 4 more years of ocean warming to come from this increased solar input. The sea level trend should begin to track higher too, once the climate shifts from a La Niña-dominant period to an El Niño-dominant one, as part of this natural oscillation between the two modes.
The future aerosol trends are uncertain. Natural sulfate aerosol concentrations in the stratosphere are naturally variable so it may persist at a near-current level, it may not. Human sulfate pollution, on the other hand, affects mainly the lower atmosphere and is very short-lived (typically days to a week), so it only lingers on because worldwide industrial activity pumps so much of it into the atmosphere every day. Any prolonged slump in global economics could result in a decrease in sulfates and unmask further warming.
The key point to note here is that the warming vs cooling tug-of-war is not an evenly matched contest. Greenhouses gases, especially carbon dioxide, have tremendous staying power due to their long atmospheric lifetime measured in centuries, and are growing slightly stronger every year as more fossil fuels are burnt. But the opposing effects are temporary, so won't always be around to offset greenhouse gas-induced warming. This warming will pose a significant threat to the stability of the kilometres-thick ice sheets which sit atop Greenland and Antarctica, and which, between them, contain the equivalent of 65-70 metres of future global sea level rise.
Because the scientific evidence for manmade global warming is so overwhelming, skeptics tend to employ a number rhetorical debating techniques in their attempts to discredit it. Having watched David Evans' video, it's transparently obvious that he uses a number of these techniques, but relies heavily upon two in particular; 'cherry-picking' - where he selectively chooses information which reinforce his world view and excludes information which undermines it. And the 'strawman argument' - where he misrepresents mainstream climate science, and attacks that instead of the true position. Now it's time to address some of the myths put forth by Evans.
David Evans: "Ocean temperature data before 2003 is almost worthless"
This is a classic cherry-pick by Evans. Some of what he outlines about the collection of ocean heat content data is correct, as is detailed in this SkS post, however he gets critical issues entirely wrong. There is perhaps a clear reason that Evans wishes to dismiss data prior to 2003, and it's shown in the figure below from the NODC, and based upon Levitus (2012) - the oceans have undergone considerable warming since 1955.
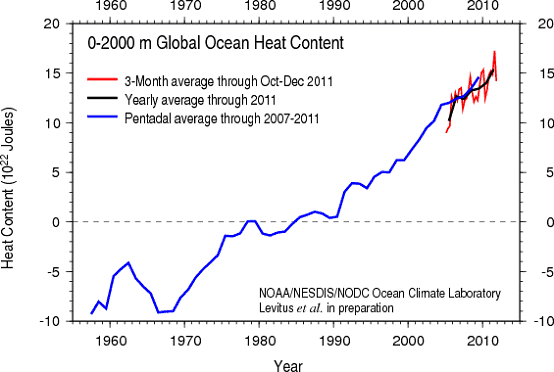
Figure 2 -Global OHC for the upper 2000 meters of oceans (NODC)
If one wanted to hide from this inconvenient truth, summarily dismissing the data before 2003 would be a simple way to accomplish this. Finally, the claims that the data before 2003 are "almost worthless" is simply not true. For example, Church (2011) showed that the sea-level budget (which depends on ocean temperature data) can be closed as far back as 1972.
Evans:"......we sampled the ocean only along northern commercial shipping routes, only sporadically, and only using buckets which we lowered into the ocean and measured the temperature of...."
Measuring the heat content of the ocean using buckets would be no mean feat. In fact it is physically impossible to do so. Evans is confused here. Buckets were used earlier in the 20th century, and were lowered from ships to measure sea surface temperature only, not the temperature of the ocean at depth.
Evans: "......here's what the climate models say ocean temperatures should be doing. We're measuring ocean heat content here, it should be moving up at a fairly steady clip at about that rate"
This is a strawman argument, and is not representative of scientific understanding at all. Given that El Niño and La Niña are intervals when the global oceans either undergo net cooling (El Niño), or net warming (La Niña), there is no expectation of a steady year-after-year increase in ocean heat in the real world. And this is despite some aspects of the climate system (such as the cool-skin layer effects) having to be parameterized (specified) in the climate models in some way.
Furthermore, as Loeb (2012) demonstrates using 15 climate models employed in the 2007 IPCC (Intergovernmental Panel on Climate Change) report, there is considerable variability between each climate model, and they all exhibit substantial variance from year-to-year. In the figure below this large variance is shown as the grey-coloured band, which is consistent with the observations. So the climate models definitely do not expect La Niña and El Niño, or any other natural variance, to vanish either.
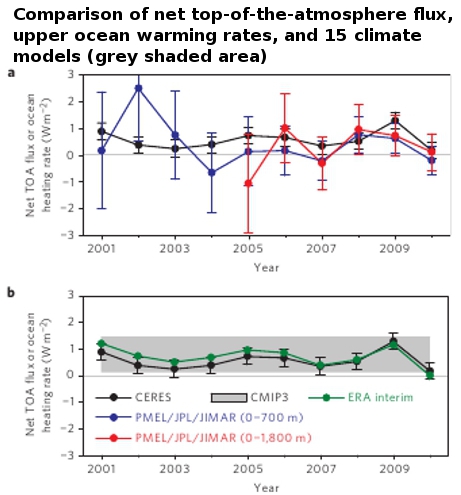
Figure 3 -Comparison of net TOA ?ux and upper-ocean heating rates. a, Global annual average (July to June) net TOA ?ux from CERES observations and 0–700 and 0–1,800m ocean heating rates from PMEL/JPL/JIMAR. Uncertainties for upper-ocean heating rates are given at one standard error derived from OHCA uncertainties. b, Net TOA ?ux from CERES, ERA-Interim reanalysis and the one standard deviation about the 2001–2010 average of 15 CMIP3 models (grey bar) are anchored to an estimate of Earth’s heating rate for July 2005–June 2010. From Loeb (2012).
Evans: "Here's what ARGO says is actually happening. As you can see, since about the beginning of about 2003 the ocean temperatures have been essentially flat."
This is more cherry-picking fare from Evans. When the data for ocean heat down to 2000 metres are considered, there is an ongoing increase in ocean warming, as shown in Figure 2. Also, data collected from the ARGO floats, for the upper 700 metres of ocean, is incorporated into two other ocean temperature datasets (Hadley and PMEL/JPL/JIMAR) and, using different analysis methods, those two datasets also reveal continued ocean warming. Although a slower warming rate since 2003/2004 is evident, likely contributing factors are discussed above under the heading 'A sea level conundrum'.
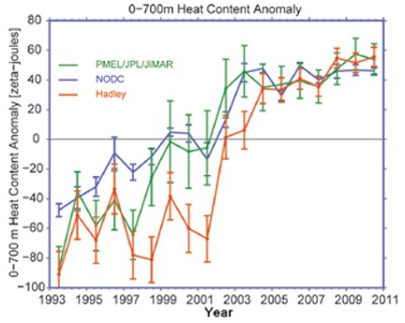
Figure 4 - Ocean heat content anomalies 1993-2010 for the upper 700m of ocean. Vertical bars indicate the standard errors about the mean. See Blunden (2011).
Evans: "This is ENVISAT is the newest satellite that's been up long enough to establish a (sea level) trend"
This is yet another cherry-pick. Evans ignores the satellite record preceding 2002 for good reason, it reveals a longer-term increase in global sea level.
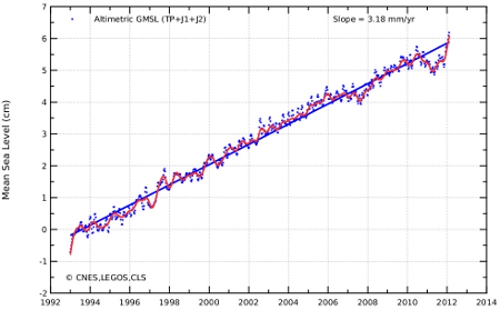
Figure 5 - Global mean sea level rise since 1993 as measured by satellite altimetry. See AVISO.
Evans also ignores that sea level has been measured by other satellites (TOPEX/Poseidon, JASON 1 & Jason 2), and by tide gauges (for many decades). It's the combination of data from all these sources that give confidence in the robustness of the trend of sea level rise, not any particular satellite, no matter how advanced it may be.
But the real crux of the issue here is that the ENVISAT data is flawed largely because of a fault which developed in the ultra stable oscillator (clock) onboard the satellite, which corrupts the altimetry measurements. This fault is so severe it requires a correction of over +2mm per year. By not applying the necessary corrections to the satellite data, Evans' graph does not represent reality.
It should be also noted that sea level fluctuates greatly between La Niña and El Niño, and therefore 10 years is hardly sufficient time to establish what the long-term trend might be. That can only be accomplished with a long enough observational record. There are no short cuts for this, even if technological advances in satellite altimetry improve accuracy. But, of course, by dismissing other satellite observations and tidal gauge data, and ignoring the necessary corrections to data, Evans can pretend the inconveniently long history of sea level rise doesn't exist.
Figure 7 - acceleration of sea level rise from the late 19th century to 21st century. From Church (2008).
Evans: "Now these results are without any model, modeling adjustments. Normally when sea levels are presented they adjust them for various reasons, due to models. These are the raw data. Unadjusted"
Ignoring the conspiratorial connotations here, there is a good reason why so-called raw data undergoes 'adjustment' - because it is often flawed or compromised in some way. What Evans labels adjustments are in reality corrections. For instance, the satellites that measure sea level rise slowly drift in their orbits, atmospheric conditions disturb the radar pulse from the satellites, and the sea surface height changes significantly between calm and rough conditions. These and many more complications and bias have to be corrected for in order to obtain an accurate record of sea level rise. (See the AVISO page for further explanation and links to the relevant scientific literature).
In addition to the problematic ENVISAT data, other good examples of the need for corrections are in the the ARGO ocean temperature dataset, and MSU (Microwave Sounding Unit) satellite records. Some of the ARGO floats which measure ocean temperature developed a leak in their pressure sensor so they were much deeper than calculated and therefore gave an erroneous colder reading. The faults were later identified and corrections have to be made to the data collected from these malfunctioning floats, until they are finally removed from service (see Lyman [2006], Barker [2011]).
A number of spurious cooling trends were also identified in the data collected from the MSU satellites which measure global temperatures in the upper atmosphere. The data require 'corrections' and modeling because the instruments aboard the satellites actually measure microwave radiation given off by oxygen molcules in the atmosphere as a proxy for temperature. During the first decade of operation the satellites gave a false trend of global cooling (Wentz [1998]), but this was later found to be as a result of orbital decay, instrument intercalibration errors, and a number of other 'raw data' issues (Hurrell [1997], Hurrell [1998], Mears [2003], Fu & Johanson [2004], Po-Chedley & Fu [2012]).
Evans: "....And the blue line here, is the rate of increase of the sea level worldwide. And that blue line is going up at around a third of a millimtere per year."
Allowing for error corrections, global sea level rise is currently at 3.18mm per year, around nine times greater than that claimed by Evans.
Evans: "Thats around 3.3 centimetres per century. That contrasts the the IPCC who are saying it's about 26 to 59 centimetres per century."
As noted above, Evans' estimates are in error. But even putting that aside, all he has done is extrapolate his estimate into a century long trend. We could do the same by extrapolating the 10mm of sea level rise in the last year -ending up with 88 centimetres of sea level rise by 2100. Neither approach is valid however, as sea level rates can vary over decadal scales and naively extending 'snapshots' of sea level trends is an extremely unreliable method. Especially so when the greatest threat of future sea level rise is the possible disintegration of the Greenland and Antarctic ice sheets, which have really ony begun to melt appreciably in the last two decades.
The 2007 IPCC report on future sea level rise specifically excluded the possible acceleration of sea level through rapid ice sheet melt because it could not be modeled accurately enough. They did, however, acknowledge such a possibility. Instead the 2007 IPCC assessment simply assumed the contribution of ice melt to sea level rise, throughout the 21st century, would be at the same rate as the central estimate for the period 1993-2003. But, as Figure 1 shows, this has been a gross underestimate.
As detailed above, David Evans utilizes defining characteristics of scientific denialism to make his claims, in particular the use of the logical fallacies - the 'strawman argument' and 'cherry-picking'. By ignoring the bulk of the scientific evidence (see animation below) Evans comes to erroneous conclusions about ocean warming and sea level rise.
In reality the Earth's persistent energy imbalance, in spite of a number of counteracting effects, reveals that further global warming is inevitable. This will cause further warming of the ocean and drive sea levels higher, through the thermal expansion of seawater and the melt of the land-based ice.
How much sea level may rise through the 21st century is a legitimate question. A number of scientific estimates being in the region of just under a metre, however the continued burning of fossil fuels and the greenhouse gases they emit, places the vast kilometres-thick icesheets on Greenland and Antarctica at risk of partial disintegration.
Posted by Rob Painting on Saturday, 19 May, 2012
 |
The Skeptical Science website by Skeptical Science is licensed under a Creative Commons Attribution 3.0 Unported License. |