The myth that Hansen's 1988 prediction was wrong is one of those zombie myths that always keeps coming back even after you chop its head off time and time again. The newest incarnation of this myth comes from Jan-Erik Solheim, who in a 272 word article promoted by Fritz Vahrenholt and Sebastian Lüning (translated by the usual climate denial enablers here) manages to make several simple errors which we will detail here.
Solheim claims that "Hansen’s model overestimates the temperature by 1.9°C, which is a whopping 150% wrong." Yet Scenario A - the emissions scenario with the largest projected temperature change - only projects 0.7°C surface warming between 1988 and 2012. Even if emissions were higher than in Scenario A (which they weren't, but Solheim wrongly claims they were), they would have to be several times higher for Hansen's model to project the ~2.3°C warming over just 23 years (1°C per decade!) that Solheim claims. Solheim's claim here is simply very wrong.
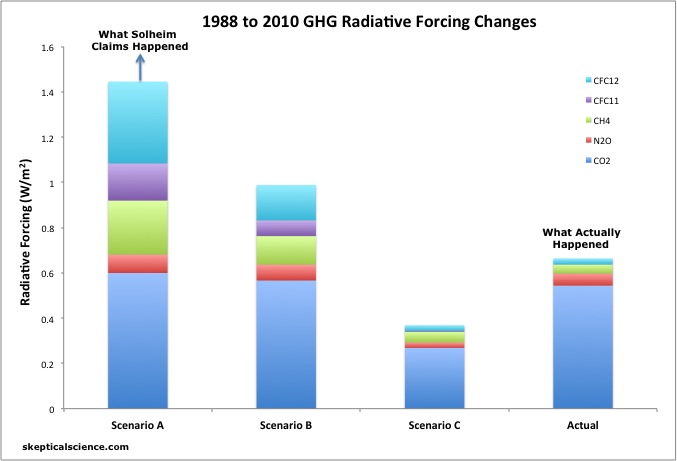
Quite similar to Patrick Michaels' misrepresentation of Hansen's study back in 1998, Solheim claims that Hansen's Scenario A has been closest to reality by focusing exclusively on CO2 emissions. However, the main difference between the various Hansen emissions scenarios is not due to CO2, it's due to other greenhouse gases (GHGs) like chlorofluorocarbons (CFCs) and methane (CH4), whose emissions have actually been below Scenario C (Figure 1). In fact, more than half of the Scenario A radiative forcing comes from non-CO2 GHGs.
Figure 1: Radiative forcing contributions from 1988 to 2010 from CO2 (dark blue), N2O (red), CH4 (green), CFC-11 (purple), and CFC-12 (light blue) in each of the scenarios modeled in Hansen et al. 1988, vs. observations (NOAA). Solheim claims the actual changes were larger than Scenario A (indicated by the blue arrow). In reality they were smaller than Scenario B.
Solheim also produces a very strange plot of what he claims is "the ultimate real-measured temperature (rolling 5-year average)." His plot shows the purported 5-year running average temperature around 1998 as hotter than at any later date to present, which is not true of any surface or lower atmosphere temperature data set. It appears that Solheim has actually plotted annual temperature data, or perhaps a 5-month running average, most likely from HadCRUT3, which has a known cool bias and has of course been replaced by HadCRUT4. There is simply no reason for Solheim to be using the outdated data from HadCRUT3.
Figure 2 shows what the comparison should look like when using the average of HadCRUT4, NASA GISS, and NOAA temperature data sets.
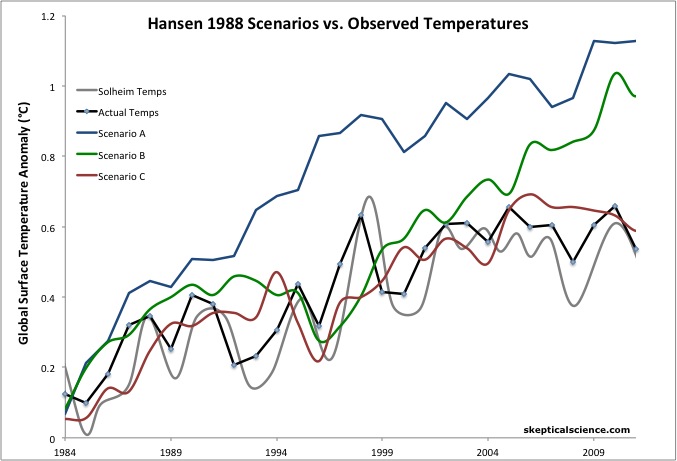
Figure 2: Hansen's 1988 Scenario A (blue), B (green), and C (red) temperature projections compared to actual observed temperatures (black - average of NASA GISS, NOAA, and HadCRUT4) and to Solheim's temperature plot (grey).
Ultimately Solheim's concluded "The sorry state of affairs is that these simulations are believed to be a true forecast by our politicians." However, even if global climate models from several decades ago didn't have the remarkable record of accuracy that they do, current day clmate modeling is far more sophisticated than that done by Hansen et al. nearly a quarter century ago. Climate models are now run on some of the world's fastest supercomputers, whereas Hansen's was run on a computer with substantially less computing power than a modern day laptop. While climate model forecasts are imperfect (as are all forecasts), they have thus far been quite accurate and are constantly improving.
The observed temperature change has been closest to Scenario C, but actual emissions have been closer to Scenario B. This tells us that Hansen's model was "wrong" in that it was too sensitive to greenhouse gas changes. However, it was not wrong by 150%, as Solheim claims. Compared to the actual radiative forcing change, Hansen's model over-projected the 1984-2011 surface warming by about 40%, meaning its sensitivity (4.2°C for doubled CO2) was about 40% too high.
What this tells us is that real-world climate sensitivity is right around 3°C, which is also what all the other scientific evidence tells us. Of course, this is not a conclusion that climate denialists are willing to accept, or even allow for discussion. This willingness to unquestioningly accept something which is obviously simply wrong is a good test of the difference between skepticism and denial. Indeed, in misrepresenting Hansen's results, Solheim has exhibited several of the 5 characteristics of scientific denialism.
Posted by dana1981 on Tuesday, 19 June, 2012
 |
The Skeptical Science website by Skeptical Science is licensed under a Creative Commons Attribution 3.0 Unported License. |