Over the past three decades, Arctic sea ice extent, area, and most importantly, volume have declined dramatically, to levels unseen in millennia. 2012 is absolutely shattering previous record lows, and we expect the continued long-term sea ice decline (which is predominantly human-caused) to have some serious adverse consequences. This is a difficult reality to face, and when faced with a difficult reality, denial is often a natural, inevitable reaction.
The easiest way to deny that a long-term change is happening is to focus on noisy short-term data, where it is easy to find any desired trend through cherrypicking - one of the 5 characteristics of scientific denialism. As we explored in Global Surface Temperature: Going Down the Up Escalator, one just needs to choose a few data points where the short-term trend goes in the opposite direction of the long-term trend and voilá! Nothing to worry about.
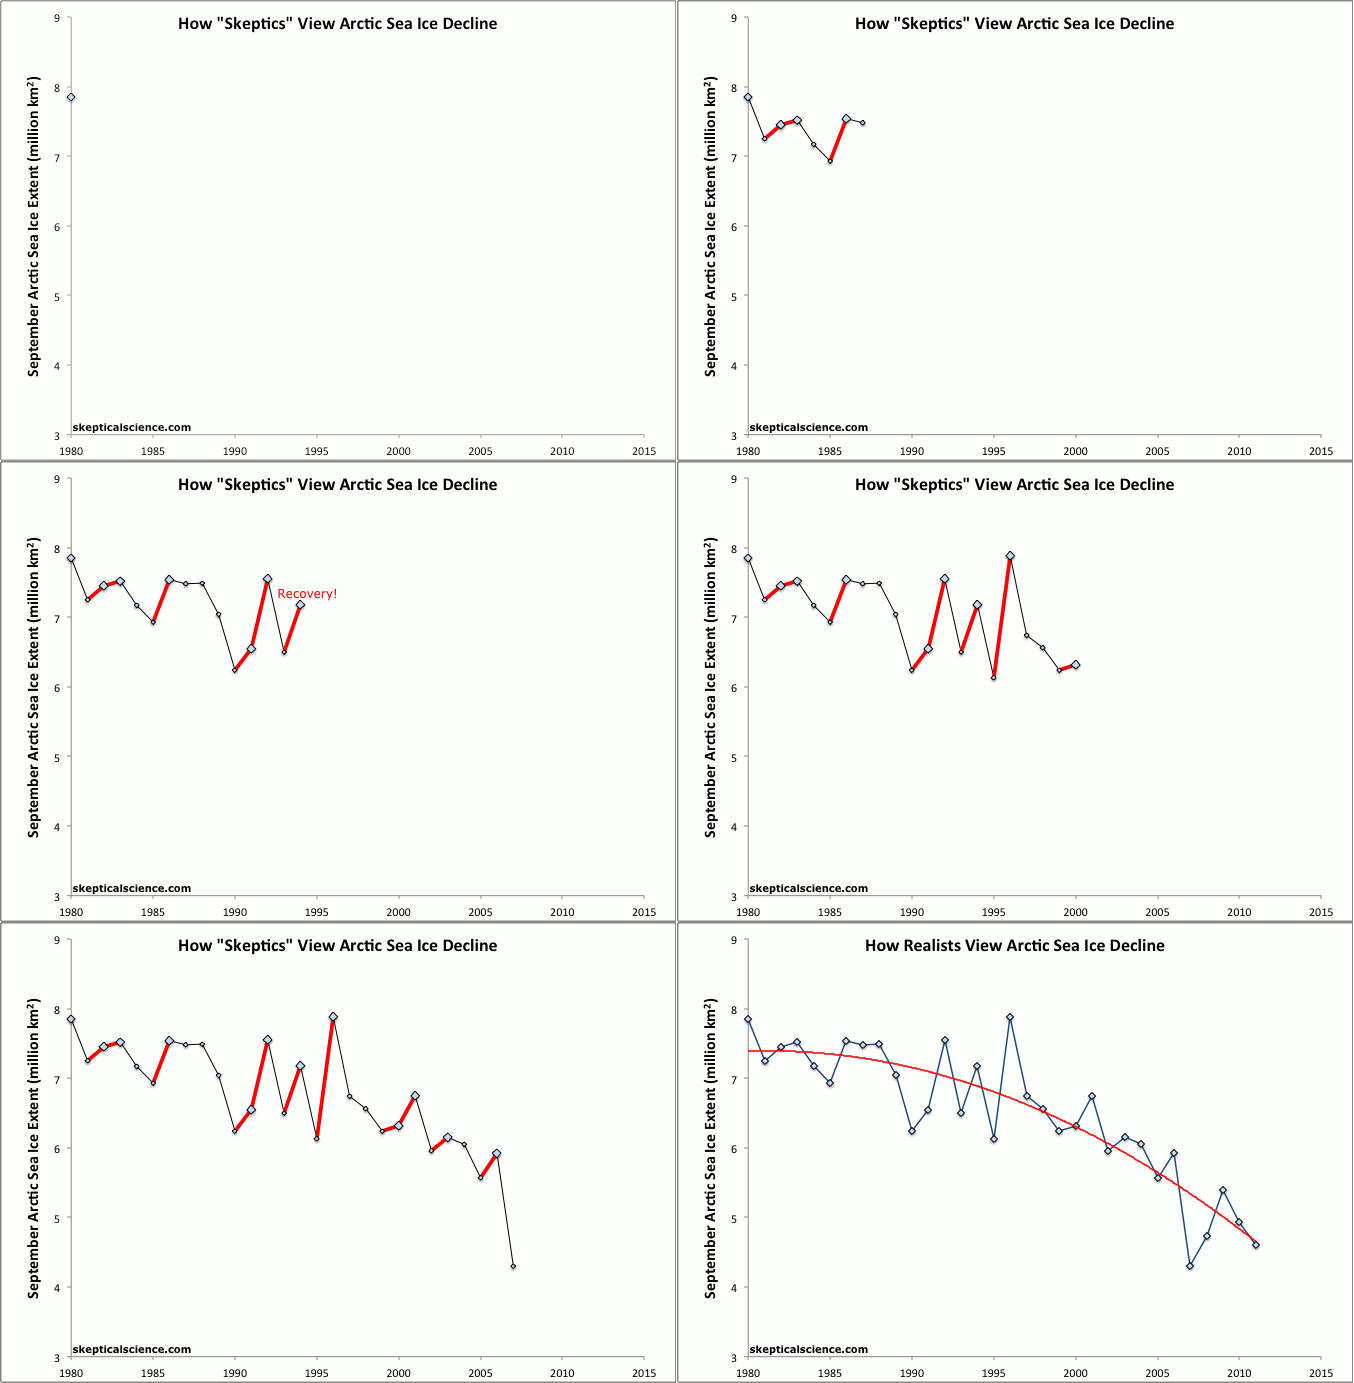
We have created a new animated GIF to depict in a simple and straightforward manner exactly why this focus on short-term data is misguided. The principle is very similar to 'going down the up escalator' for global temperatures. In this case, climate contrarians are trying to go up the down escalator, finding very brief periods during which Arctic sea ice extent increases, and proclaiming that it has "recovered," all the while ignoring the accelerating long-term decline (Figure 1).
Figure 1: NSIDC September Arctic sea ice extent (blue diamonds) with "recovery" years highlighted in red, vs. the long-term sea ice decline fit with a second order polynomial, also in red.
2007 was the previous year in which the Arctic sea ice decline shattered all records. There is a principle in statistics known as "regression toward the mean," which is the phenomenon that if an extreme value of a variable is observed, the next measurement will generally be less extreme, i.e. we should not expect to observe record lows in consecutive years. This is because when extremes are reached and records are broken, a number of different variables generally have to align in the same direction to make this happen.
For example, 1998 was the hottest year on record and remained the hottest until 2005 because it involved a combination of an exceptionally strong El Niño, fairly high solar activity, low volcanic activity, and the increased human-caused greenhouse effect. All of the most important variables happened to align in the warming direction in 1998, which is why 1998 is often used as the starting point to argue that global warming has magically stopped, as illustrated in the global surface temperature escalator (Figure 2).
Figure 2: BEST land-only surface temperature data (green) with linear trends applied to the timeframes 1973 to 1980, 1980 to 1988, 1988 to 1995, 1995 to 2001, 1998 to 2005, 2002 to 2010 (blue), and 1973 to 2010 (red). The baseline period is 1950-1980.
Likewise, the record low Arctic sea ice extent in 2007 was not broken for another five years because on top of the long-term human-caused decline, 2007 involved a perfect combination of weather events and natural cycles contributing to even further sea ice loss.
Thus even when there is a long-term trend, extreme events are often followed by a regression toward less extreme values. This presents an opportunity for those who want to deny the existence of the long-term trend to characterize these regression years as "recoveries," claiming there is nothing to worry about because temperatures seem to be cooling (as in Figure 2) or because Arctic sea ice seems to be bouncing back to normal levels (as in Figure 1).
For example, climate contrarians claimed that after the record low sea ice extent in 2007, the regression years of 2008 (e.g. here and here) and 2009 (here) showed that Arctic sea ice was recovering back to normal, and thus that there was nothing to worry about. This focus on this short-term two-year "recovery" while ignoring the long-term trend led the contrarians to make some very optimistic predictions about 2010 sea ice extent (here), which turned out to be very, very wrong as the brief "recovery" mirage ended and the long-term trend in Arctic sea ice decline continued to accelerate. Undeterred, the contrarians continued to make overly optimistic predictions in 2011 and 2012, which similarly turned out to be very, very wrong. We will have a blog post examining various Arctic sea ice predictions over the past several years once we have reached this year's minimum.
Figure 1 has been added to the Skeptical Science's Animated Climate Graphics Page, and is free for anyone to use and distribute. We suspect it may very well come in handy next year, as another regression toward less extreme values is likely, and if there is another regression, we can certainly expect the climate contrarians to once again proclaim that Arctic sea ice is on its way to a full recovery.
We wish their optimism were not misplaced, but sadly it is only a matter of time before the Arctic becomes ice free in the summer. Denying this reality will only allow the problem to continue doing more damage to ecosystems around the world.
Note: a little late, but my Arctic sea ice post from earlier this week, Record Arctic Sea Ice Melt to Levels Unseen in Millennia, has been incorporated into new rebuttals to the myths Arctic sea ice loss in the 1940s was similar to today's, Arctic sea ice extent was lower in the past, and used to update the Intermediate rebuttal to Arctic icemelt is a natural cycle. The two new rebuttals also have short URLs http://sks.to/arctic1940 and http://sks.to/pastarctic. Our list of short URLs https://skepticalscience.com/shorturls.php is also a useful resource for tweeting and posting in blog comment threads.
Posted by dana1981 on Friday, 7 September, 2012
 |
The Skeptical Science website by Skeptical Science is licensed under a Creative Commons Attribution 3.0 Unported License. |