Modelling the permafrost carbon feedback
A recent modelling experiment shows that climate change feedbacks from thawing permafrost are likely to increase global temperatures by one-quarter to a full degree Celsius by the end of this century. This extra warming will be in addition to the increase in temperature caused directly by emissions from fossil fuels. Even in the unlikely event that we were to stop all emissions in the near future, this permafrost climate feedback would likely continue as a self-sustaining process, cancelling out any future natural draw-down in atmospheric carbon dioxide levels by the oceans or vegetation. Avoiding dangerous climate change by reducing fossil-fuel emissions becomes more difficult once permafrost emissions are properly considered.
Many papers have looked at the expected contribution of thawing permafrost to climate change. For example, Schaeffer et al. (2011) and Schuur and Abbott (2011) have both published estimates of the effect that the thawing and decomposition of organic matter in Arctic soils will have on future climates. Aspects that these studies neglected were the feedback that the permafrost carbon release would have on causing further permafrost degradation and the varying response that the carbon release would have on the climate in different emission scenarios and for a range of climate sensitivities.
To explore this matter further, a recent paper in Nature Geoscience (paywalled) by Andrew MacDougall, Christopher Avis and Andrew Weaver couples together climate and carbon-cycle models. Using the University of Victoria Earth System Climate Model adapted to include a permafrost response module, the researchers calculated the contribution to climate warming of thawing permafrost over a range of varying parameters.
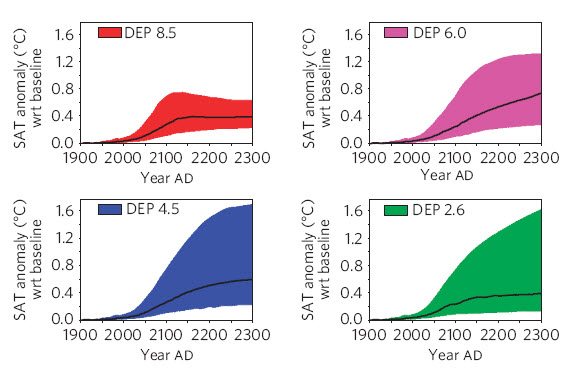
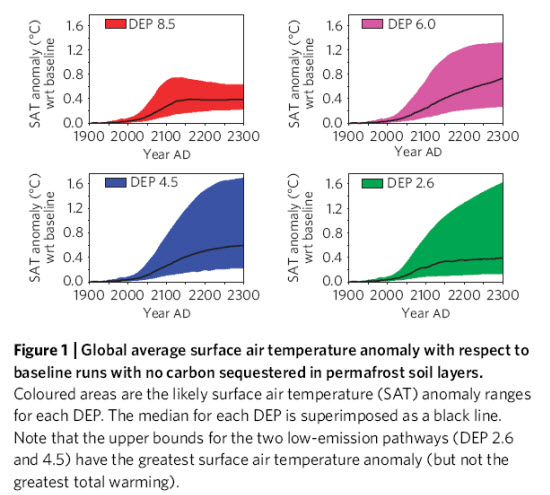
Figure 1. Taken from MacDougall et al. (2012) showing the additional warming induced by permafrost thawing for four diagnosed emissions pathways (DEP, see text below for explanation). The coloured areas are the ranges of likely additional temperature ranges and the black lines show the median responses. The uncertainty within each DEP run results from uncertainties in the density of carbon in the permafrost and the climate sensitivity (the temperature effect of a given rise in carbon dioxide concentration in the air). Figure with original caption here.
Emissions pathways
The four scenarios or diagnosed emissions pathways (DEP) were derived from the Representative Concentration Pathways (RCP) used for the upcoming Fifth Assessment Report of the IPCC. RCPs are not emissions scenarios but rather curves of atmospheric CO2 concentration with time. The numbers 2.6, 4.5, 6.0 and 8.5, correspond to the radiative forcing in W/m2 in 2100. For use in climate models the emissions scenarios have to be backed out of the RCPs to give the DEPs.
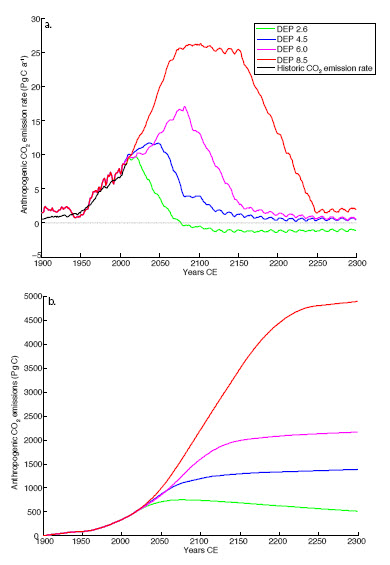
Figure 2. The DEP’s used in the MacDougall et al study. The figure corresponds to Figure S2 in their Supplementary Material. The top graph shows the annual human CO2 emissions pathways and the lower graph the cumulative emissions. The jitter in the top curves is due to variations in solar cycles. Note that the most optimistic curve DEP 2.6 has emissions that drop to zero from 2020 to 2070 and, following that, net human sequestration of atmospheric carbon. The most pessimistic pathway has emissions that continue on their recent trajectory until 2070, when they level off. Roughly speaking, the pathways can be categorized as Heroic (2.5); Prudent (4.5); Procrastinating (6.0); and Oblivious (8.5).
Other variables of the model
a) Size of the carbon pool. MacDougall et al vary the carbon concentration of the permafrost from 15.8 to 26.3 kg/cubic metre, which leads to a range of 837-1206 PgC (billion tonnes of carbon) for the upper 3.5 metres of permafrost. This figure is larger than that assumed in previous studies. Consequently, the upper-end range of carbon release by 2100 calculated in this paper, 508 PgC, is much larger than the previous studies that did not use coupled carbon-climate models. For example, Schaeffer et al calculated 138 PgC as their upper limit. The entire permafrost soil carbon pool is estimated to contain 1700 PgC, about twice the mass of the carbon in the current atmosphere.
b) Climate sensitivity. The other important variable used in the model is the climate sensitivity, which varies between 2.0 and 4.5°C for a doubling of atmospheric CO2, with a central value of 3.0°C.
Counter-intuitive results
The results shown in Figure 1 are very consistent for the 2100 median forecasts, ranging between 0.23 and 0.27°C of extra warming due to permafrost feedbacks. By 2300, the range of median has increased to 0.37 to 0.73°C. The results are a little counter-intuitive, with the biggest feedbacks in temperature terms not coming with the worst emissions pathways. On one hand, the amount of permafrost carbon released on the most pessimistic pathways is larger (39, 58, 67 and 101 ppm CO2 respectively for the four DEP’s), and occurs sooner. On the other, in the lower DEP cases, the permafrost carbon released to the atmosphere has a stronger effect due to less saturation of the infra-red absorption bands.
Also counter intuitively, the uncertainty of the permafrost feedback is reduced in the higher emission scenarios. In these scenarios, there is less uncertainty that we will unleash all of the permafrost, and quickly. Not only that, but following the pessimistic pathways means that we will have already have inflicted so much violence on the atmospheric chemistry that the extra damage caused by the permafrost feedback will be felt relatively less strongly.
The industrial shutdown experiment
The results in Figure 1 imply that we are in for at least some backlash from the permafrost whatever emissions pathway we choose to follow. Because the real world will resemble a coupled climate-carbon cycle model, the releases of permafrost carbon will result in more warming, which will cause still more carbon to be released. In other words, at some level the cycle will become self-sustaining, even without any further human encouragement. MacDougall et al investigated this by imagining a complete shutdown of human emissions in 2013 and in 2050.
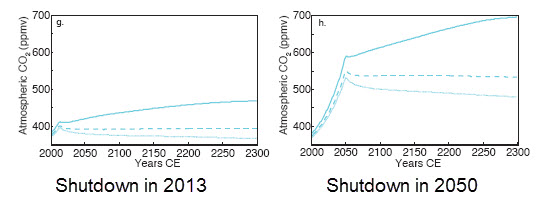
Figure 3. Showing the atmospheric concentration of CO2 following a shutdown of human emissions in 2013(left) and, after following DEP 8.5 for 39 years, a shutdown in 2050 (right). The dotted blue line shows the results at a climate sensitivity of 3.0°C and the upper and lower lines 4.5° and 2.0° respectively. Selected and modified from Figure S8 in the Supplementary Information.
What Figure 3 demonstrates is that even in the case where human emissions cease altogether, the atmospheric CO2 concentration will remain more-or-less constant in the most likely climate sensitivity case. Essentially, for a climate sensitivity of 3°C, the self-sustaining permafrost-related emissions match the uptake of CO2 from the oceans and the terrestrial biosphere. Note that a self-sustaining feedback is not the same thing as a runaway greenhouse effect.
Permafrost feedbacks and the trillionth tonne
Allen et al (2009) argued that what matters most in determining safe levels of emissions is not so much the rate but the cumulative amount. Framed in this way, total emissions of a trillion tonnes of carbon will lead to a most likely warming of 2°C, a somewhat arbitrary, but widely accepted limit on the amount of warming that the world can endure without a high risk of catastrophic consequences. According to the trillionthtonne.org website, humans have already emitted 561 billion tonnes of carbon from fossil fuels, cement production and land use changes. We therefore have about 440 billion tonnes left to emit before we cross the trillion tonne limit. On present emission trends, this will occur in 2043.
MacDougall et al predict median permafrost emissions of 174 billion tonnes of carbon by 2100, which are more-or-less independent of the future pathway of our other emissions. Such feedbacks were not factored in to the trillionth tonne analysis, or were assumed to kick in after the "safe" limit of 2°C had been breached. Accordingly, the 440 billion tonnes we can still emit over the next few years and stay under the trillion-tonne limit needs to be reduced from 440 to 270 billion tonnes of fossil fuel, cement and land use emissions, a reduction of some 40%. Avoiding dangerous climate change becomes a lot harder once we face up to the permafrost feedback.
Why even this bleak prospect may be optimistic
Alert readers may have already noticed that this article has not yet used the word “methane”. When organic matter in the permafrost is thawed and decomposes it produces mostly CO2 but also small amounts of methane, particularly so in the wetlands that are prevalent in areas of thawing permafrost. Schuur and Abbott (2011) polled 41 experts on permafrost decay who estimated that about 3% of the carbon released from the permafrost will be in the form of methane. Methane has a restricted lifetime in the atmosphere, measured in decades, but while present in the air it has a greenhouse effect some 25 times that of CO2 over a 100-year period and higher values over shorter periods. According to Schuur and Abbott, the small amount of methane is responsible for approximately half of the warming effect from the permafrost emissions.
The UVic model does not simulate methanogenesis. That is to say that it does not model the generation of methane—all of the permafrost carbon that goes into the atmosphere in the model is in the form of CO2. This is a significantly conservative simplification over the time period studied.
Also, their model assumes only purely thermal degradation of the permafrost. Physical erosion, for example at coastlines, is not considered. Their model accounts only for permafrost down to a depth of 3.5 metres and there is plenty of carbon stored below those depths that was excluded from their modelling.
Finally, this study does not consider any contribution of methane from methane hydrates, either from under permafrost or under ice sheets, nor from fossil methane currently trapped under an impermeable seal of continuous permafrost.
Summing-up
- Thawing permafrost will release carbon to the atmosphere that will have an appreciable additional effect on climate change, adding at least one quarter of a degree Celsius by the end of the century and perhaps as much as one degree. (In comparison, Swart and Weaver (2012) calculated that combustion of the in-place resources of the Alberta oil sands would increase temperatures by 0.24-0.50°C.)
- The temperature effect of the coming permafrost feedback is not sensitive to the emission pathway that we choose to follow.
- The permafrost feedback response to our historic emissions, even in the absence of future human emissions, is likely to be self-sustaining and will cancel out future natural carbon sinks in the oceans and biosphere over the next two centuries.
- Unfortunately, there are several good reasons to consider the outlook in MacDougall et al. as rosy; as the authors themselves make clear. However, as bad and inevitable as they are, feedbacks from the permafrost are just the (de-)icing on the fossil fuel cake that we are busy baking. It is still up to us to infuence how severe climate change is going to be.
Posted by Andy Skuce on Thursday, 4 October, 2012
