Nate Silver's Climate Chapter and What We Can Learn From It
In the interest of full disclosure, many Skeptical Science team members are big fans of Nate Silver's FiveThirtyEight blog at The New York Times. Silver runs a model which uses polling results and various other input factors (such as economic indicators) to predict election outcomes in the USA, with an impressive track record of accuracy.
Thus we were intrigued to hear that Silver had included a chapter on climate change in his newly-published book The Signal and the Noise: Why So Many Predictions Fail-but Some Don't, particularly since we at Skeptical Science are often forced to explain the difference between signal and noise. Having great respect for the work and climate-related opinions of Michael Mann (who Silver consulted in writing the book), we were also concerned to see his criticisms of Nate Silver's climate chapter.
Nevertheless, Mann recommended that people read the book for themselves, praising much of the content. So I did just that, and overall I believe that if we take Silver's analysis a step further, we can learn a lot about the accuracy of climate models. It's also important to remember that, as Silver himself notes in the chapter, our basic understanding of how the climate works and how much it will warm in response to our greenhouse gas emissions is not just dependent on models.
Correlation is not Causation without Physical Connection
Silver's climate chapter starts out very well, noting that correlation does not necessarily imply causation, and that determining climate change causation requires a physical understanding of the climate system.
"...predictions are potentially much stronger when backed up by a sound understanding of the root causes behind a phenomenon. We do have a good understanding of the cause of global warming: it is the greenhouse effect."
Failing to consider physics in trying to determine the cause of global warming has been the pitfall for many a climate contrarian, for example Roy Spencer, Craig Loehle, Nicola Scafetta, Syun-Ichi Akasofu, and many others, so Silver's point is an important and relevant one. It is easy to fall into the curve fitting trap.
Silver goes on to explain some of that fundamental physics as discussed in the IPCC report - that atmospheric CO2 has increased steadily and rapidly, that this CO2 increase will in turn increase the greenhouse effect and cause global surface warming (which we've known for well over a century), and that water vapor will amplify that global warming as a feedback effect, ultimately noting "The greenhouse effect isn't rocket science."
Healthy Skepticism or Noise?
After this good start, the chapter then proceeds to discuss what Silver considers the healthy form of scientific skepticism, noting that
"In climate science, this healthy skepticism is generally directed at the reliability of computer models used to forecast the climate's course."
Silver then discusses J. Scott Armstrong as an example of this type of healthy skeptic of science who is concerned about the accuracy of climate model predictions. Armstrong is basically used to establish the 'skeptic' criticisms of climate models, though his arguments are very weak, basically boiling down to 'climate models are too complex to be accurate.' Armstrong also tends to focus on short-term noise rather than long-term trends, which Silver does eventually point out toward the end of the chapter. After establishing Armstrong's criticisms, Silver moves on to the more interesting part of the chapter, evaluating the accuracy of past climate models.
Testing Hansen's 1988 Model Accuracy
Sliver attempts to evaluate the accuracy of climate models by examining the model projections made by James Hansen in 1988 and the IPCC in 1990 and 1995. We should note here that Skeptical Science has evaluated many other temperature projections going back as far as Wallace Broeker's 1975 paper in the Lessons from Past Predictions series, with the results summarized in Figure 1 (though not all of these are based on climate models). Note that most of the accurate predictions have come from mainsream climate scientists and models, while the least accurate predictions have come from various 'skeptics'.
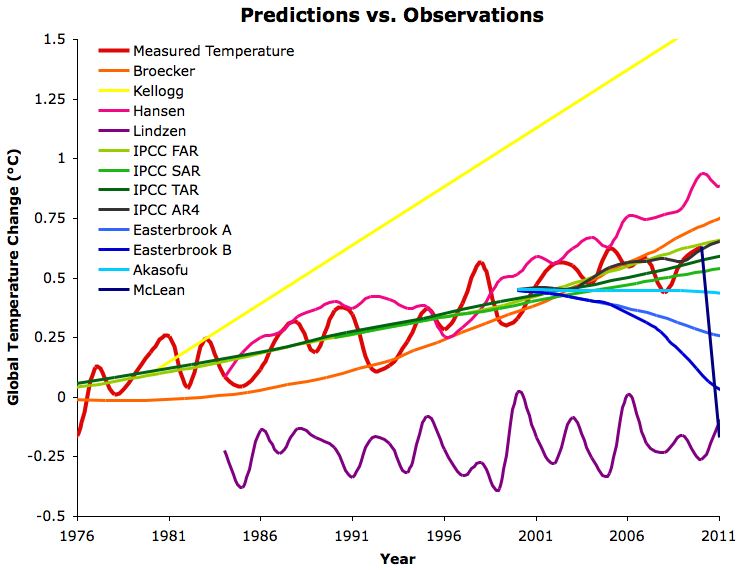
Figure 1: Various best estimate global temperature predictions evaluated in the 'Lessons from Past Climate Predictions' series vs. GISTEMP (red). The warmer colors are generally mainstream climate science predictions, while the cooler colors are generally "skeptic" predictions. The Hansen projection in pink is from Hansen et al. 1988.
Silver first examines James Hansen's 1988 projections, but not in great detail, simply noting that they are difficult to evaluate because they rely on various emissions and radiative forcing (global energy imbalance) assumptions, concluding
"Even the most conservative scenario somewhat overestimated the warming experienced through 2011."
Silver is right that Hansen's 1988 model projected more warming than has been observed. But what can we learn from this?
The overall climate sensitivity (the total amount of climate warming in response to a given greenhouse gas increase, including feedbacks) in Hansen's model was 4.2°C for a doubling of atmospheric CO2 levels. This is significantly higher than most of today's climate models, which put the value around 3°C for doubled CO2. In order to accurately project the ensuing warming, Hansen's model sensitivity would have had to be close to that in today's climate models (Figure 2).
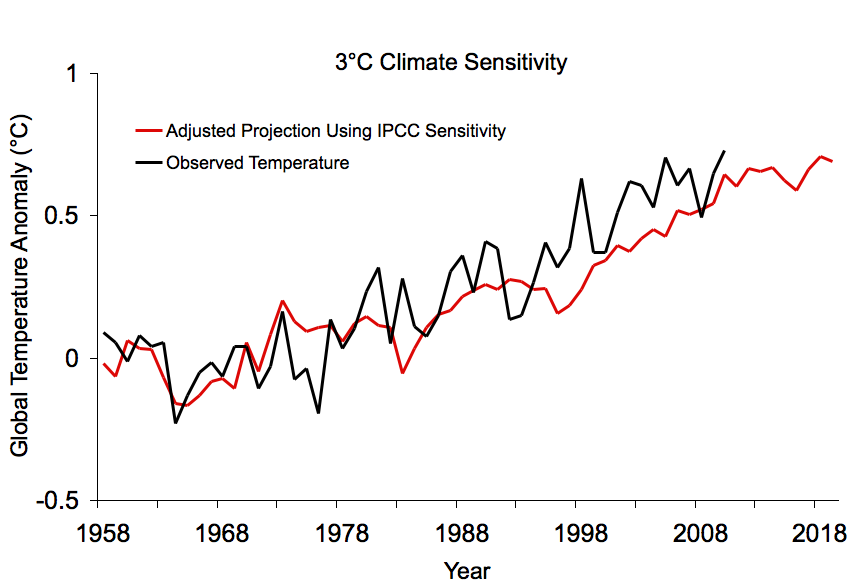
Figure 2: A rough adjustment of the Hansen 1988 Scenario B temperature projection to reflect a 3°C rather than 4.2°C climate sensitivity (red) vs. GISTEMP observations (black)
Thus we can be confident that today's climate models are, not surprisingly, more accurate than James Hansen's 1988 model.
Testing IPCC Model Accuracy
The chapter proceeds to evaluate the 1990 IPCC report's temperature projections. Silver notes that under the various scenarios, the models projected between approximately 2°C and 5°C global surface warming from 2000 to 2100 (Figure 3).
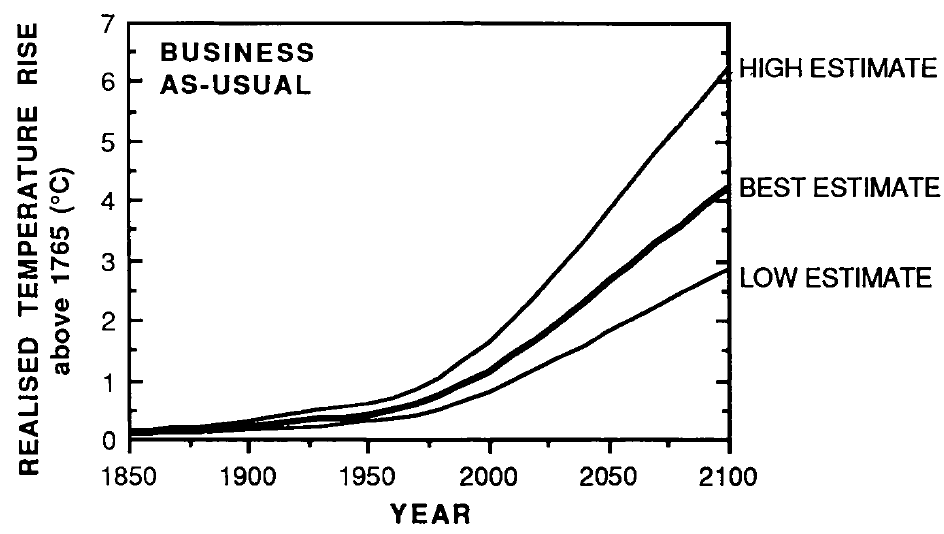
Figure 3: 1990 IPCC projected global warming in the BAU emissions scenario using climate models with equilibrium climate sensitivities of 1.5°C (low), 2.5°C (best), and 4.5°C (high) for double atmospheric CO2
Silver then compares this rate of warming to the rate of warming from 1990 through 2011 and concludes that the 1990 IPCC report somewhat over-predicted the ensuing warming. We can take this analysis further and address the question why their warming projections were a bit high.
While Silver's discussion compares observations to all 3 IPCC climate sensitivity scenarios (low = 1.5°C for doubled CO2, best = 2.5°C, high = 4.5°C), he has not yet considered the emissions scenario (BAU = business as usual). The 1990 BAU scenario considered a 3.5 Watts per square meter (W/m2) greenhouse gas forcing in 2011, whereas the actual greenhouse gas radiative forcing was approximately 2.8 W/m2 in 2011. The IPCC BAU forcing was too high for two reasons
1) In 1990, the radiative forcing caused by a doubling of CO2 was believed to be about 4.4 W/m2. We now know it's closer to 3.7 W/m2.
2) Greenhouse gas emissions have not risen quite as fast as the IPCC BAU scenario.
This resulting lower real-world radiative forcing (an input, not output of the model) accounts for most of the model-data discrepancy Silver observes (Figure 4).
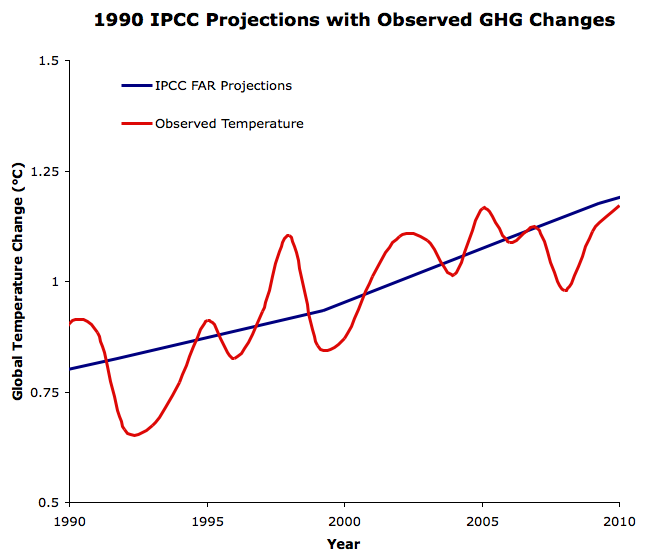
Figure 4: 1990 IPCC FAR BAU "best" global warming projection reflecting the observed GHG forcing changes (blue) vs. observed average global surface temperature change from GISTEMP (red) since 1990.
When adjusting the BAU scenario projections to reflect the actual greenhouse gas changes since 1990, the model would expect to see roughly 0.2°C per decade warming, which is slightly more than has been observed, but within the 95% uncertainty range in all temperature data sets. That the observed rate of warming has most likely been a bit lower than the IPCC projection is also not surprising considering all the short-term cooling influences over the past decade. In fact, later in the chapter Silver discusses one of these recent cooling effects - increased aerosol emissions from Chinese coal plants have likely dampened the observed warming over the past decade.
Silver does note that the 1990 IPCC BAU scenario "was somewhat too pessimistic," (point #2 above) but goes on to claim that
"Nevertheless, the IPCC later acknowledged their predictions had been too aggressive. When they issued their next forecast, in 1995, the range attached to their business-as-usual case had been revised considerably lower: warming at a rate of about 1.8°C per century. This version of the forecasts has done quite well relative to the actual temperature trend. Still, that represents a fairly dramatic shift."
We should point out that the 1995 IPCC report considered a number of different emissions scenarios, with a corresponding average global surface warming ranging from about 1.6 to 2.5°C between 1990 and 2100 (Figure 5). Describing it as simply projecting about 1.8°C per century warming does not capture the full spread of warming projections.
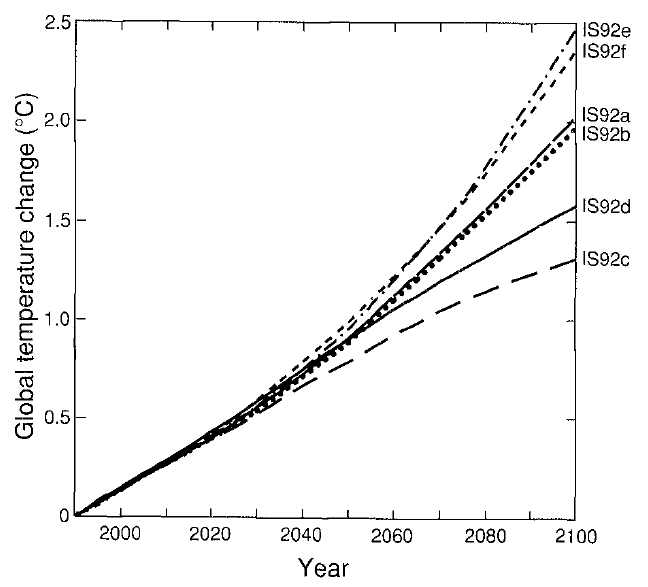
Figure 5: 1995 IPCC report projected global mean surface temperature changes from 1990 to 2100 for the full set of IS92 emission scenarios. A climate sensitivity of 2.5°C is assumed.
Again we can take this analysis a step further and get into the model nuts and bolts to understand the reason behind the lower rate of projected warming in the 1995 IPCC report as compared to the 1990 report. As it turns out, the difference was mainly due to the revised emissions scenarios - model inputs, not outputs. The 1995 IPCC report still used the too-high CO2 radiative forcing value (point #1 above), but used what has turned out to be a more accurate range of greenhouse gas emissions scenarios than the 1990 BAU (addressing point #2 above).
When we adjust for the actual greenhouse gas radiative forcing, the 1995 IPCC report projects a very similar amount of warming as the similarly corrected 1990 report 'best estimate', which we would expect, since both used climate sensitivities of 2.5°C.
Ultimately the difference between the projected warming in the two scenarios mostly boils down to using to different emissions and radiative forcing scenarios - model inputs, not outputs. As illustrated in Figure 1 above, the 1990 and 1995 IPCC temperature projections performed very similarly when adjusted for actual greenhouse gas and radiative forcing changes.
The 'dramatic shift' Silver refers to simply reflects a change in emissions scenarios - a model input. Both the 1990 and 1995 IPCC model projections have been quite accurate when we adjust for those inputs. If we are just evaluating model accuracy here, the IPCC did very well in both 1990 and 1995. If we are evaluating the IPCC's ability to predict CO2 emissions, well, that's the rub. We don't know how human CO2 emissions will change in the future, but if they continue on their current path, the models project a whole lot of warming.
The IPCC, Al Gore, and Polar Bears
There are a few relatively minor errors in the chapter worth noting. For example, Silver states:
"And however many models there are, the IPCC settles on just one forecast that is endorsed by the entire group."
This is not quite correct. While the IPCC report does publish a graphic illustrating the multi-model mean temperature projection for each emissions scenario, it also shows the envelope of individual model projections on the same figure (Figure 6).

Figure 6: Temperature Projections from the 2007 IPCC Report. Solid lines are multi-model global averages of surface warming (relative to 1980–1999) for the emissions scenarios A2, A1B, and B1, shown as continuations of the 20th century simulations. Shading denotes the ±1 standard deviation range of individual model annual averages. The orange line is for the experiment where concentrations were held constant at year 2000 values. The grey bars at right indicate the best estimate (solid line within each bar) and the likely range assessed for the six emissions marker scenarios.
Silver also criticizes Al Gore's film An Inconvenient Truth as
"...sometimes [being] less cautious, portraying a polar bear clinging to life in the Arctic, or South Florida and Lower Manhattan flooding over. Films like these are not necessarily a good representation of the scientific consensus."
However, Arctic sea ice is actually declining significantly faster than the climate models used in the IPCC report predicted, and it's certainly true that south Florida and Manhattan could eventually become flooded as a result of sea level rise. Additionally, while Gore's film did get a few details wrong, as Michael Mann noted, it got the basic science right.
Good Points in the Chapter
Silver's climate chapter also makes many good points for which he deserves credit.
- Silver points out that climate models simply cannot replicate the current climate without accounting for greenhouse gas increases.
- The chapter contains a graphic similar to The Escalator to show that there are often short-term changes in the opposite direction of the long-term trend, but that this just represents noise in the system.
- Silver references William Nordhaus in noting that uncertainty is actually a reason to reduce greenhouse gas emissions, because the worst climate scenarios cannot be ruled out.
So aside from the issues noted above, the chapter does contain a lot of good information.
Discouraging Conclusion
The chapter ends on a bit of a discouraging note, with Silver suggesting that climate scientists should not try to directly influence climate policy.
"It is precisely because the debate may continue for decades that climate scientists might do better to withdraw from the street fight and avoid crossing the Rubicon from science into politics."
Note that by "politics" Silver appears to refer to "policy" in this context. However, the problem with Silver's suggestion is that we simply don't have decades to waste. The evidence that humans are causing dangerous climate change has been building for many decades, with climate scientists advising the importance of emissions cuts, and yet policymakers have continually failed to achieve the necessary action to steer us away from this path. Climate scientists have essentially been forced into pressing harder and harder for serious climate policy - to put it simply, we are quickly running out of time to avoid potentially catastrophic climate change.
Silver's discouraging conclusion may result from not taking that extra step to evaluate why the past warming projections discussed here were too high, as we have done. Silver may have drawn the conclusion that the climate is not warming as fast as we expect, which would suggest that we have more time than climate scientists believe to solve the problem.
However, when correcting the model projections to account for the actual greenhouse gas emissions and forcing changes, we see that their temperature projections have been very accurate. Thus climate scientists are correct to worry that unless we quickly enact climate policies to reduce human greenhouse gas emissions, we will suffer some very painful consequences. In fact, as Silver himself notes in the chapter, we don't even need climate models to realize that we're in for a lot of global warming this century.
Silver is right that we are making too little progress in terms of climate policy, and he is is of course correct to note that climate scientists must be careful to ensure that their predictions and warnings are scientifically accurate and defensible. However, remaining silent in the face of a potential catastrophe is simply not an option. Effective policy depends on active engagement between policymakers and the scientific community. It's important for scientists to know the limits of science in shaping policy, but it's also vital to ensure that policy grapples with scientific realities. If climate scientists say nothing, this creates a vacuum to be filled by people like Armstrong and other climate contrarians Silver discusses, who frankly are way out of their depth when it comes to climate science and climate models, but don't know enough to realize it.
Note that I have not yet read the rest of Silver's book, which looks like it may be very interesting. Overall the climate chapter does give us a good start in evaluating the accuracy of climate models, as long as we take the analysis a few steps further.
Posted by dana1981 on Friday, 5 October, 2012

