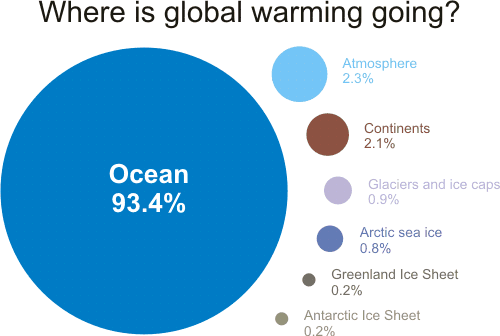
Figure 1: components of global warming for the period 1993 to 2003 calculated from IPCC AR4 5.2.2.3.
The recent discussion on heat content got me thinking about an alternative way to communicate where all the heat content from global warming is going. Inspired by the elegant methods of Information is Beautiful, here is a visual depiction of how much global warming is going into the various components of our climate system:

Figure 1: components of global warming for the period 1993 to 2003 calculated from IPCC AR4 5.2.2.3.
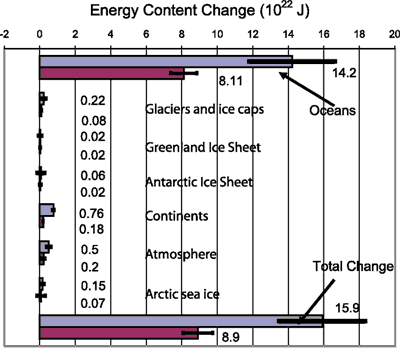
The percentages were calculated from Figure 5.4 from Section 5.2.2.3 of the IPCC 4th Assessment Report (h/t to Humanity Rules for the heads up). The IPCC graph shows changes in energy content for two different periods: 1961 to 2003 and 1993 to 2003.

Figure 2: Energy content changes in different components of the Earth system for two periods (1961–2003 and 1993–2003). Blue bars are for 1961 to 2003, burgundy bars for 1993 to 2003 (IPCC AR4 5.2.2.3).
I opted for the latter period 1993 to 2003 as the last decade should be more indicative of recent trends. Of course, what would be even more interesting is data up to 2008 but hopefully I'll get an opportunity to update the graphic at a later date. The ocean heat figure of 93.4% is almost certainly an underestimate as it only includes ocean heat down to 700 metres (Levitus 2005).
Lastly, let me head the nitpickers off at the pass. The percentage figures actually add up to 99.9%. I could've gone to several more unsightly decimal places to get it closer to exactly 100% but I figured the maths nerds will just have to deal
UPDATE 22 April 2010: AndyS correctly points out that my graphic incorrectly scales the circles by the diameter rather than the area. Apologies for the error, this is my first attempt at fancy shmancy Information is Beautiful style graphics and didn't quite think it through. Have updated the graph so the contribution to each component is represented by the area, not the diameter. Thanks to AndyS for spotting the error (I quite enjoyed this exercise and plan to do similar style graphics down the track).
Posted by John Cook on Tuesday, 20 April, 2010
 |
The Skeptical Science website by Skeptical Science is licensed under a Creative Commons Attribution 3.0 Unported License. |