Key Points:
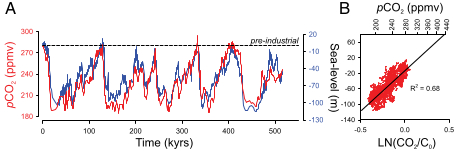
Figure 1(a) - Relationship between atmospheric CO2 (in parts per million) and global sea level (in metres) over the duration of the ice core record. The dashed horizontal line depicts the pre-industrial state for comparison (b) Shows the cross-plot of CO2 versus sea level rise over this period. CO2/Co on the horizontal axis is the CO2 ratio relative to the pre-industrial where 0.0 respresents the pre-industrial, with negative values (below) and postive values (above) relative to pre-industrial. From Foster & Rohling (2013)
Carbon dioxide is the most significant of the greenhouses gases, gases that trap heat in Earth's atmosphere and reduce the rate of heat loss to space in the upper layers of the atmosphere. As a result the temperature of the planet's surface and ocean is largely dependent upon the concentration of greenhouse gases in the atmosphere. Generally-speaking; increase the concentration of greenhouse gases and the planet traps more heat, reduce them and the planet cools. Because of this behaviour, renowned glaciologist, Richard Alley, has dubbed carbon dioxide Earth's biggest temperature control knob.
The oceans are the Earth's largest heat reservoir and, in comparison to the atmosphere, they respond very slowly to warming because of their immense mass, vast heat capacity, and the length of time it takes for heat to be transported down to the deep ocean. The long-lived nature of CO2 therefore means that the oceans (and the atmosphere) will continue to warm, albeit at a comparatively much slower rate, even long after humans have ceased pumping planet-warming greenhouse gases into the atmosphere (Meehl [2012]). In other words, we have yet to see the land-based ice fully respond to human intervention in the Earth's climate.
In examining ancient sea level it would, of course, be preferable to be able to match sea level at any given point in Earth's history with global temperature, especially as further warming is in the pipeline. However, a number of problematic assumptions have to be made in order to transform various paleo data into global temperature estimates over seperate geological periods. Foster & Rohling (2013), therefore, quantified the relationship between two entities that could be measured more directly - land ice volume/sea level and carbon dioxide levels. So, based on the carbon dioxide/sea level relationship, and the greenhouse gases humans have already emitted, how high is this sea level rise we are already committed to? The authors used high quality data from the Earth's geological past to answer this question.
Ice core records retrieved from drilling expeditions on the Antarctic ice sheet date back 800,000 years (Petit [1999], Luthi [2008]) and provide a high fidelity record of the Earth's atmospheric carbon dioxide concentration over this interval. This is due to the fact that the ice contains bubbles of air which became trapped in snowfall and were eventually sealed off from the atmosphere over time. Each air bubble, therefore, contains a tiny sample of carbon dioxide from the atmosphere at the time it was sealed off, and each successive layer of ice deposited enables a reconstruction of atmospheric carbon dioxide going back in time - as shown in Figure 1.
During the last few million years (the Pleistocene), the Earth has been in the grip of the ice ages - long cold intervals (glacials) interspersed with shorter warm periods such as today (interglacials)- which were driven by orbital forces, and reinforced by carbon dioxide acting as a feedback (although the details are sketchy). Even though the ice sheets only provide us with 800,000 years of this period, it is most probable that sea level rarely exceeded the pre-industrial level. This can be seen in Figure 1 for the last 550,000 years.
So, although useful in establishing the overall carbon dioxide/sea level relationship, the overwhelming majority of the ice core record is not greatly informative of the future because sea level and atmospheric carbon dioxide were generally much lower than present-day, and sea level change involved the growth or disentegration of the gigantic Laurentide and Fennoscandian ice sheets in the Northern Hemisphere - ice sheets which do not exist today. Furthermore, the relationship of steadily increasing CO2 with rising planetary temperature is not a linear one. So we can't simply extrapolate the past CO2/sea level relationship into the future with any confidence.
Throughout the last 40 million years the Earth has cooled in fits and starts from a very warm state with virtually no land-based ice, to the current glacial/interglacial period where monstrous ice sheets are capable of growing upon the land masses of the Northern Hemisphere. Given that Earth is headed toward a future where the polar ice sheets are greatly reduced, warmer and cooler periods of ancient Earth might yield some insight. To examine these intervals it was necessary for Foster & Rohling (2013) to turn to other paleo data, such as alkenone and boron isotopes. These methods rely on the knowledge that carbon dioxide dissolved into the ocean, and therefore ocean pH, are dependent on the partial pressure of carbon dioxide in the atmosphere.
Alkenones are organic (natural) compounds produced by certain types of ocean surface-dwelling phytoplankton and, like other paleoclimate proxies, provide information about the state of Earth's climate at the time they were formed. Carbon dioxide from seawater is incorporated into living tissue through the process of photosynthesis, and alkenones are one of the by-products. As a result, alkenones contain information about the amount of carbon dioxide dissolved in seawater and therefore atmospheric CO2 concentrations - since they are derived from the well-mixed sea surface layers. These organic compounds are extremely durable and are highly resistant (although not immune) to long-term degradation (diagenesis). Over the course of time the bodily remains of alkenone-bearing phytoplankton settle on the ocean floor and build up in sediments. By examining sediments taken from cores drilled into the seafloor it is possible to use our knowledge of chemistry and biology to work backwards and reconstruct atmospheric CO2 at the time the alkenones were formed. See Pagani (2002) for a review of alkenones as proxies.
Boron isotopes are another sediment-based method employed to determine ancient carbon dioxide concentrations. This technique differs somewhat from alkenones in that the chemical signatures are stored within the fossilized shells of foraminifera (forams), tiny marine life which live near the sea surface (planktic). Like alkenones, this surface-dwelling characteristic is important because the surface ocean layers are well-mixed with the atmosphere, and therefore ocean pH, once reconstructed, allows atmospheric CO2 to be calculated (albeit with some degree of uncertainty). Minerals such as boron dissolved in seawater are incorporated into the shells of forams and, because the boron isotope ratio is predominately a function of the ocean pH, they are recorders of ocean pH at the time when the shells were formed. See Foster (2008) for details.
Foster and Rohling (2013) examined 5 time slices over the last 40 million years -the ice core record dating back 550,000 years, 2.7-3.1 million years ago during the Pliocene, 11-17 million years ago during the Miocene, 33-35 million years ago during the Eocene-Oligicene boundary, and 20-40 million years ago during Eocene-Oligicene. Sea level for the ice core record was based upon the Red Sea reconstruction (discussed in this SkS post). For the other time slices estimates are based upon the oxygen isotope ratio (global ice volume signal) in fossilized forams (Waelbroeck [2002]), the magnesium/calcium content of foram fossils to isolate the oxygen isotope/global ice volume signal (Barker [2005]). And finally, analysis of the character of depositional features (lithofacies) and physical structure of ocean floor sediments (backstripping), which can be used to estimate global sea level volume.
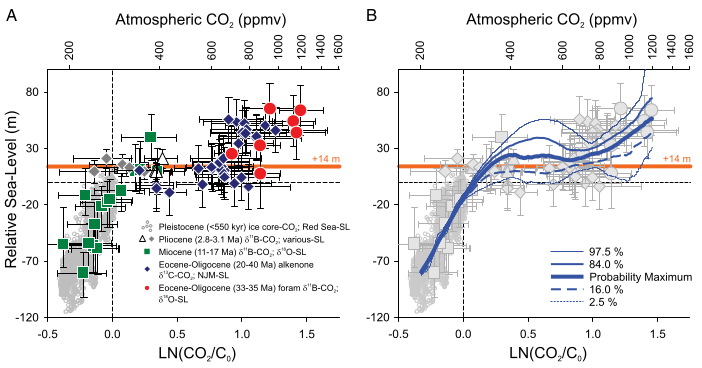
Figure 2(a) - cross-plot estimates of atmospheric CO2 and sea level. The data are labelled according to the time period and reconstruction technique employed. The dashed vertical and horizontal lines denote the pre-industrial CO2 and sea level respectively. The vertical and horizontal bars on each data point represents the uncertainty of the sea level and CO2 estimates respectively. 3(b) Probabilistic analysis that fully accounts for uncertainty in both sea level and CO2 data, with the bold line indicating the probability maximum . From Foster & Rohling (2013).
Interestingly, data and subsequent atmospheric CO2 and sea level reconstructions, show very good agreement in spite of the various methods used. This can be seen especially over the ice core record, where data from the Miocene and Pliocene are consistent with the Red Sea reconstruction. This is surprising given the different continental configurations, oceanic pathways, and mountain-building (orography) over this vast stretch of time might have been expected to yield varied estimates. This general agreement does, however, give some degree of confidence that the results are robust.
The most notable feature of the reconstruction, however, is its s-shaped (sigmoidal) nature. Despite global temperature decreasing between 650 to 400 parts per million (ppm) of atmospheric CO2, the sea level response appears to taper off. It is obvious that this interval is very light on data points, but given the characteristic shape of all the data, it seems unlikely that the overall complexion will change once the interval is populated with more data. It should be noted, however, that this data (above 400ppm) is generally from intervals when land-based ice was growing and sea level falling as a consequence. In contrast, data from 180-400 ppm comes from both cooling and warming periods, which suggests that ice sheet growth and disintegration, between these CO2 concentrations, exhibit similar behaviour.
That may not be the case with rising sea level at values above 400ppm, the system may exhibit hysteresis. In other words, above 400 ppm warming and sea level rise may not behave in the same manner as it did when the planet was cooling and sea level was falling. The ultimate fate of land-based ice above atmospheric CO2 concentrations of 400 ppm could be path-dependent.
Atmospheric CO2 concentration as of 2011 was around 392 ppm, and based upon that and the carbon dioxide/sea level relationship revealed in their research, Foster & Rohling (2013) calculated that long-term sea level rise will reach 24 metres (+7/-15 metres at 68% confidence) above present-day sea level once the planet has fully responded to the warming. This is likely to be achieved through extensive disintegration of the West Antarctic and Greenland ice sheets, and a substantial part of the coastal sector of the East Antarctic ice sheet.
The existing land-based ice is equivalent to 60-70 metres, so the loss of 24 metres of sea level worth of ice suggests that over a third of the ice sheet volume may already be committed to disintegration. As noted in the introduction, this dramatic response represents the long-term consequences of human industrial activity and reinforces the concept that atmospheric CO2 is Earth's main temperature control knob.
For more information about this type of research go to: descentintotheicehouse.org.uk
Posted by Rob Painting on Tuesday, 5 March, 2013
 |
The Skeptical Science website by Skeptical Science is licensed under a Creative Commons Attribution 3.0 Unported License. |