Early February I published a post on the Dutch climate-website of Bart Verheggen in which I described a re-analysis of the data as presented in a paper by Klotzbach, Pielke Jr. and Sr., Christy and McNider (abbreviated as K-2009). Without consulting me, this post was translated by the skeptical Dutch journalist Marcel Crok, sent over to the authors, followed by an extensive blog post by John Christy as a reply to my post. This post of Christy was published on 'Staat van het Klimaat' and WUWT. In this part 1 I present a shorter version of my Dutch post with the title "Klotzbach Revisited".
The 'Klotzbach'post is about the fact that the rate of warming at higher altitudes should be larger than at the surface. This is not corroborated by the comparison between temperatures as determined by measurements at the surface and by satellites. The Klotzbach paper suggests that this difference is caused by a bias in the surface temperatures and that this difference would increase when time progresses.
However with only four more years of data as used in the Klotzbach paper, it is clear that this expected increase has not occurred. To the contrary, this trend difference has decreased. Instead of a bias in the surface temperature record a 'bias' in the satellite record may be equally, or perhaps even more plausible.
There are two methods of measurement for the average atmospheric temperatures nowadays, one coming from 'surface-thermometers' and since 1979 a second method has come available, which is based upon satellite data and represents the lower troposphere. The most well-known surface temperature datasets are GISTEMP, HadCRUT and NCDC. The satellite datasets are released by the University of Alabama in Huntsville (UAH) and Remote Sensing Systems (RSS). The two methods show differences, for instance the NCDC data indicate a trend over land of 0.27 °C/decade for 1979-2012, while over the same period, the trend based upon the satellite data by UAH over land is significantly lower at 0.18 °C/decade. In contrast, the trends for global temperatures (land + ocean) indicate much smaller differences, for the surface temperatures of NCDC and the lower troposphere temperatures of UAH these are respectively 0.15 °C/decade and 0.14 °C/decade for the same period.
Big deal? Almost everything related to climate is a 'big deal', so it is of no surprise that the same applies to these trend differences. In a warming world it is expected that the temperatures of the upper troposphere increase at a higher rate than at the surface, regardless of the cause of the warming. The cause of this amplification is related to the lapse rate and the lapse rate feedback (more info here and on OurChangingClimate). So the temperature aloft should on average increase more than at the surface, this is however not corroborated by the comparison between surface and satellite temperatures.
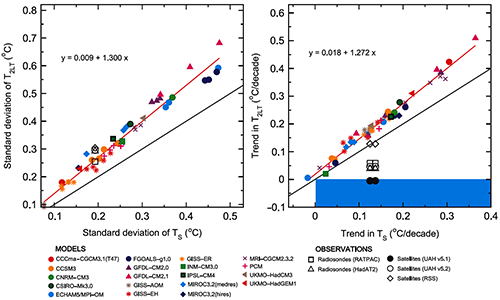
These differences have been a regular subject of research, see for instance Santer et al 2005, Karl et al 2006 and a review by Thorne et al 2011. Santer et al concluded that on monthly and annual time scales the temperature observations of the troposphere in the tropics were consistent with the theory and show a greater warming at a greater height than at the surface. However on a time scale of decades, they only encountered one dataset that met these expectations, as can be seen in figure 1 (adapted from Thorne 2011).
Figure 1: Tropical temperature behavior in observations and models. The black line in the graphs indicates an amplification factor of 1 for the surface temperature (Ts) to the temperature of the complete lower troposphere (2LT);the red line denotes an amplification factor of about 1.3 (slope of model expected tropospheric versus surface temperatures). The graph on the left is a representation of the month-to-month variability, were the models and the observations (radiosonde data, satellites and surface temperatures) are in agreement. The graph on the right is a representation of the trends on a multi-decadal scale. Here the models also show an amplification factor of about 1.3, whereas the observations show a smaller amplification factor, in some cases even smaller than 1.
The extensive report of the U.S. Climate Change Science Program (Karl et al) concluded:
These results could arise due to errors common to all models; to significant non-climatic influences remaining within some or all of the observational data sets, leading to biased long-term trend estimates; or a combination of these factors. The new evidence in this Report (model-to-model consistency of amplification results, the large uncertainties in observed tropospheric temperature trends, and independent physical evidence supporting substantial tropospheric warming) favors the second explanation.
So, a deviation in the long-term trend in the observations would be the most likely explanation for the trend differences. Looking specifically at the satellites, this is not illogical given the difficulties inherent to satellite measurements (see e.g. the various UAH versions), such as the drift in the satellites’ orbit, sensors which deteriorate over time, calibration problems when changing from one satellite to another, or temperature effects in the instruments themselves. Even last year Po-Chedley & Fu found another bias in these satellite temperatures, and one of their conclusions was:
"Creating climate-quality satellite temperature datasets is a challenging process that requires constant attention as new biases are discovered."
In 2009 the aforementioned Klotzbach et al paper was published and its title was: "An alternative explanation for differential temperature trends at the surface and in the lower troposphere". Their general conclusion was:
"The differences between trends observed in the surface and lower-tropospheric satellite data sets are statistically significant in most comparisons, with much greater differences over land areas than over ocean areas. These findings strongly suggest that there remain important inconsistencies between surface and satellite records."
The K-2009 paper implies that these ‘inconsistencies’ are caused by biases in the surface temperatures.
To assess the trend differences between NCDC/HadCRUT3 and the UAH/RSS data, they took the monthly values of the different datasets, subtracted these from each other and calculated a trend over these monthly differences. Figure 2 contains the results from the Klotzbach-2009 paper (their table 2).
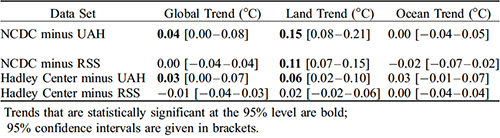
Figure 2: Differences in trends between NCDC/HadCRUT3 and UAH/RSS over 1979-2008.
The biggest difference was obtained for NCDC minus UAH with a trend of +0.15 °C/decade over land and +0.04 °C/decade for the globe as a whole, for which a negative ratio would be expected. This is consistent with the conclusions drawn by Santer et al that the multi-decadal trend is anomalous, whereas the same anomaly is not apparent on shorter time scales. This led them to state the following:
"The real conundrum is the complex behavior of the observations".
The same calculations were performed in K-2009 with an amplification factor of 1.2 for the warming at higher altitudes, which obviously lead to even greater differences. This factor of 1.2 was not based upon peer-reviewed science and but was obtained by Ross McKitrick from GISS-ER climate model data. This trick caused some turmoil, see e.g. this RealClimate blog post. In 2010 a correction paper was published (abbreviated as K-2010) with respect to the original paper, in which the calculations were repeated with an amplification factor of 1.1 above land and 1.4 above the oceans, taken from the blog ClimateAudit.
Sometimes K-2009 is used in climate skeptic texts to indicate that there are problems with the measurements of surface temperatures and that these measurements cannot be trusted. Dutch readers will be familiar with the book of Marcel Crok, who stated that the difference over land has risen to 0.5 degrees over the past thirty years and mentions a bias in the surface measurements as the cause. His 0.5 degrees is presumably based on three decades time 0.15, rounded up to 0.5 °C; note that only the highest number in Figure 2 has been used. Moreover, Crok omits the possibility that there could also be a 'bias' in the satellite measurements.
Anthony Watts also references to K-2009, he writes in his 2012 draft paper based on his Surface Stations Project:
By way of comparison, the University of Alabama Huntsville (UAH) Lower Troposphere CONUS trend over this period is 0.25°C/decade and Remote Sensing Systems (RSS) has 0.23°C/decade, the average being 0.24°C/decade. This provides an upper bound for the surface temperature since the upper air is supposed to have larger trends than the surface (e.g. see Klotzbach et al (2011). Therefore, the surface temperatures should display some fraction of that 0.24°C/decade trend. Depending on the amplification factor used, which for some models ranges from 1.1 to 1.4, the surface trend would calculate to be in the range of 0.17 to 0.22, which is close to the 0.155°C/decade trend seen in the compliant Class 1&2 stations.
It is quite strange to mention the amplification factor of 1.4 which is calculated on ClimateAudit for the oceans. After all, the USA should be categorized under ‘land’ and not under ‘ocean’.
Now we have 4 more years of data than back in 2009. Not much has changed regarding the surface temperatures, except some small improvements in the homogenization and the integration of more measurement stations (e.g. HadCRUT4 instead of HadCRUT3). These changes have not resulted in significantly different trends for the global temperatures. If the climate skeptic fans of the K-2009 article are correct regarding there being strong biases in the surface temperatures, these temperature differences should therefore have increased even further.
In January I redid the calculations of K-2009 by using the data from 1979-2012 to verify whether the expected temperature difference has increased. My results are shown in figure 3. The uncertainty is calculated according to the method as described in Foster & Rahmstorf 2011.
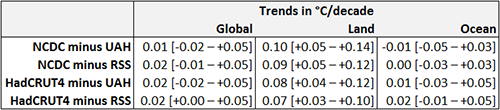
Figure 3: Differences in trends between NCDC/HadCRUT4 and UAH/RSS over 1979-2012.
With only 13% more data the trend difference over land between NCDC and UAH has decreased with approximately 33% from 0.15 to 0.10 °C/decade. This would translate in a divergence between surface and tropospheric trends of 0.34 °C over 34 years.
Still, over land the trend in surface temperatures is significantly larger than in satellite temperatures. Over the oceans the surface should warm significantly more than the troposphere; this is not seen in the observations, so also for those areas an interesting puzzle remains.
The HadCRUT4 data indicate greater differences than the old HadCRUT3 data and are, as expected, much more in line with the NCDC data. The math in the book of Marcel Crok now generates an average difference in surface minus tropospheric trends of 0.3 °C over 34 years, significantly lower than the 0.5 °C he mentioned in his book.
The expected increase in the differences between the surface temperatures and the satellite temperatures over land has not occurred. To the contrary, the trend difference has decreased rather than increased. Whereas K-2009 and its fans champion the argument that this difference is due to a ‘bias’ in the surface temperature record (some 1700 words were spent on this argument in K-2009), a ‘bias’ in the satellite record may be equally, or perhaps even more plausible.
In Part 2 of this series, I will give my response to John Christy's blog post regarding this 'Klotzbach Revisited' post.
- The Idso's on CO2Science<
- Blog Roger Pielke Jr.: here, here and here
- ClimateAudit
- SkepticalScience: here and here
- RealClimate: here and here
- Press release Po-Chedly en Fu
- MET Office HadAT2 vs MSU
- Critiques and discussions: here, here, here and here
- Original posts: here, here and here
Many thanks to Bart for helping me out with the translation and for constructive comments.
Posted by JosHagelaars on Wednesday, 3 April, 2013
 |
The Skeptical Science website by Skeptical Science is licensed under a Creative Commons Attribution 3.0 Unported License. |