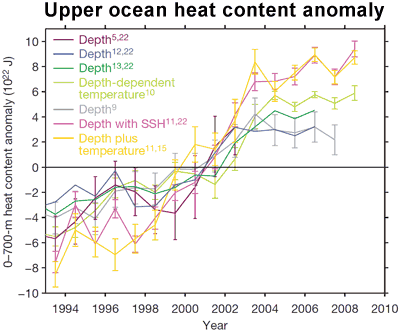
Figure 1: Ocean Heat Content anomaly from various teams. Ocean heat is calculated from 0 to 700 metres (Lyman 2010).
Most of global warming goes into the ocean. Consequently, the amount of heat accumulating in the world's oceans is a vital cog in our understanding of climate. A number of teams across the world have performed analyses of ocean heat observations. While there's year-to-year differences between the various estimates, they all show essentially the same long-term trend. Now members from the various teams have combined their efforts into a single 'best estimate' of ocean heat (Lyman 2010). What they find is robust warming in the upper ocean over the 16 years from 1993 to 2008.
When reconstructing ocean heat content, the greatest source of uncertainty is biases in expendable bathythermograph (XBT) data. XBTs are dropped from ships and measure water temperature as they sink. One example of uncertainty is estimating how the rate at which the XBTs fall has changed over time as the instruments have subtly changed. This fall rate is used to work out the depth at which temperature is measured. The various teams working on the problem make their own choices on how to adjust for the various XBT biases. We can see the differences arising from these choices by overlaying the curves produced by each team.

Figure 1: Ocean Heat Content anomaly from various teams. Ocean heat is calculated from 0 to 700 metres (Lyman 2010).
All the curves show significant warming of the global upper ocean from 1993 to 2008. While there are differences in year-to-year variability, the long-term warming rates are broadly consistent. The various datasets were then combined into a 'best estimate' of ocean heat content including a comprehensive estimate of the total uncertainty. This is shown in Figure 2: the black line is the composite estimate of upper ocean heat content anomaly and the uncertainty marked in vertical black lines.

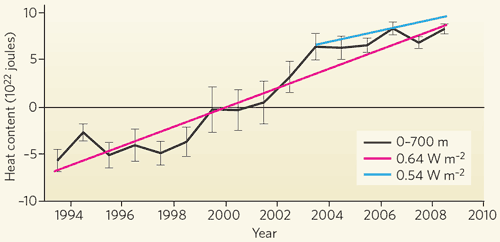
Figure 2: Ocean heat content anomaly curves from various teams (colour) and composite ocean heat content anomaly (black) (Lyman 2010).
In the same issue of Nature is a follow-up article, Global change: The ocean is warming, isn't it? (Trenberth 2010). Kevin Trenberth summarises the results of Lyman 2010 and gives a broader perspective. The general gist of his article is, loosely paraphrasing, "yes, the upper ocean is warming, fine, now where's my damn missing heat?!"
The most interesting feature in Trenberth's article is a comparison of upper ocean heat (the top 700 metres) versus ocean heat down to 2000 metres deep. In the following graph, the black line shows the 'best estimate' upper ocean heat curve from Lyman 2010 (the black line in Figure 2 above). The pink line is the long-term warming trend which averages 0.64 watts per square metre over the whole Earth. This is the global average, an indication of the planet's energy imbalance. The blue line is the observed rate of heat accumulating in the global ocean down to 2000 metres, calculated from von Schuckmann 2009.

Figure 3: Changing heat content of the global ocean. Black curve is changes in upper ocean heat content (0 to 700 metres). Pink line is trend in upper ocean heat content. Blue line is trend in ocean heat content down to 2000 metres (Trenberth 2010).
When we look at ocean heat down to 2000 metres since 2003, the global ocean has been warming at a rate of 0.77 watts per square metre. When averaged over the entire Earth, the warming is 0.54 watts per square metre. This is a rough estimate of how much heat is building up from 2003 to 2008. Note that the blue trend is greater than the black line over the same period. This means that more heat is accumulating at greater depths than 700 metres.
In summary, the oceans show a robust warming trend from 1993 to 2008. The observed rate of warming has slowed somewhat compared to the 16 year trend but the ocean is still accumulating heat.
Posted by John Cook on Sunday, 23 May, 2010
 |
The Skeptical Science website by Skeptical Science is licensed under a Creative Commons Attribution 3.0 Unported License. |