Figure 1 - The animation shows the CMIP5 model simulations compared to the HADCRUT4 surface temperature dataset. As allowances are made for better global coverage of temperature observations, El Niño/La Niña, solar radiation, and volcanic aerosols, the simulated surface temperature moves back toward the actual measured temperature over this period. Animation by Kevin C.
When you consider all of Earth's reservoirs of heat; the oceans, land, ice and atmosphere together, global warming hasn't slowed down at all. In fact quite the opposite has happened, the Earth has warmed at a faster rate in the last 16 years than it did in the previous 16. Taken in isolation though, the atmosphere has bucked this trend - warming at a slower rate in the last 16 years than it did in the previous 16 years.
There was no prior scientific expectation that surface warming would progress in a linear manner, despite the ongoing build-up of heat within the Earth system, but this slower rate of surface warming comes at a time when industrial greenhouse gas emissions are larger than ever. Preying upon the seemingly common, but mistaken, public assumption of year-after-year surface warming, contrarians and some mainstream media outlets have used this opportunity to further misinform the public about global warming. One of the more popular climate myths that has emerged as a result of this counterintuitive build up of heat is that climate models have overestimated recent surface warming and therefore will overestimate future surface warming.
Climate models are computer-based mathematical calculations representing the physics of the real world, and so obviously are only rough approximations of the real Earth. It is certainly possible that they may have overestimated recent surface warming, but a closer examination of the evidence suggests any possible recent discrepancy between the models and observed surface temperatures may simply be a result of incorrect input into the models over the recent period in question. Garbage in equals garbage out (GIGO) as some might put it. Before venturing down that road, however, it's time to consider the relevant background context.
Climate model projections typically involve a large number of individual model simulations which are spun-up well into the past and then run forward into the future to estimate climatic features of the Earth - such as global surface temperature trends. The timing of weather-related phenomena like El Niño and La Niña, which greatly affect surface temperatures in the short-term, cannot be accurately predicted and, because small changes in weather patterns allow the simulated weather to evolve along different pathways, there is a great deal of variation between the individual model runs. For example; a model run which simulates a predominance of La Niña over a given decade is going to exhibit cooler surface temperatures than another model run which displays El Niño dominance over the same decade. Over longer intervals, however, there may not be much difference in projected surface temperatures between the two model runs.
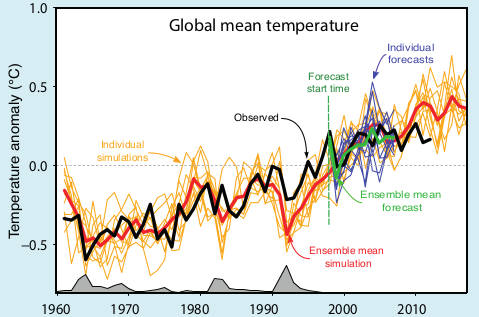
Figure 2 - A typical graphic displaying climate model simulations of global surface temperature. The spaghetti-like individual model runs are shown in orange lines. Image from the IPCC AR5 Box 11.1 Figure 1.
Often when researchers plot the output of a batch of climate model simulations they do so by averaging all the individual runs together, known as the multi-model mean, and illustrate the uncertainty range of all the projections. The average of the model runs is shown as the thin blue line in Figure 1, and the uncertainty range of 5-95% is the blue band in the figure. The uncertainty range means that, based on all the model runs, model projections remain within the blue band 90% of the time, and 10% of the time they are either above (5%) or below (5%).
This is equivalent to some god-like experiment where we are able to run the Earth's weather forward in time over and over again, observe how global surface temperatures evolve, and then plot the output. Of course the Earth only gets one roll of the dice, so the real world is actually equivalent to only one realization of the many climate model simulations, and 90% of the time could be anywhere within the 5-95% uncertainty envelope. The multi-model mean is therefore somewhat misleading in that it obscures the inherent variability in surface temperatures in each individual model simulation. We simply do not expect temperatures at the surface in the real world to progress as smoothly as the multi-model mean would seem to imply.
Due to the inability to predict the timing of natural changes within the climate system itself, such El Niño and La Niña, and factors external to the system, such as light-scattering aerosols from volcanic eruptions and industrial pollution, it becomes difficult to ascertain whether the climate model projections are diverging from reality or not. Not until the projected temperatures actually occur in the real world and persistently move outside the uncertainty range would we be aware that there was a problem.
One way to test usefulness of the climate models is to look at hindcasts - model simulations of the past where we have a reasonably good idea of what net forcing the Earth's climate was responding to. This isn't as simple as it might seem. For example; although we have a good idea of the forcing from industrial greenhouse gas emissions (which trap heat in the oceans and atmosphere), because of observational difficulties, we only have a very rough idea of the cooling effect of those tiny particles in the air called aerosols.
Not only do aerosols scatter incoming sunlight by wafting about in the atmosphere, but they also seed clouds with smaller-than-normal condensation nuclei - extending cloud lifetime. These smaller nuclei also make clouds whiter and thus more reflective to incoming sunlight. The changes in cloud characteristics imparted by aerosols (called the indirect effect) is their dominant influence and just so happens to be extraordinarily difficult to quantify. Add in the patchy and constantly changing global distribution of aerosols and it makes for a large amount of uncertainty on the forcing of surface temperatures.
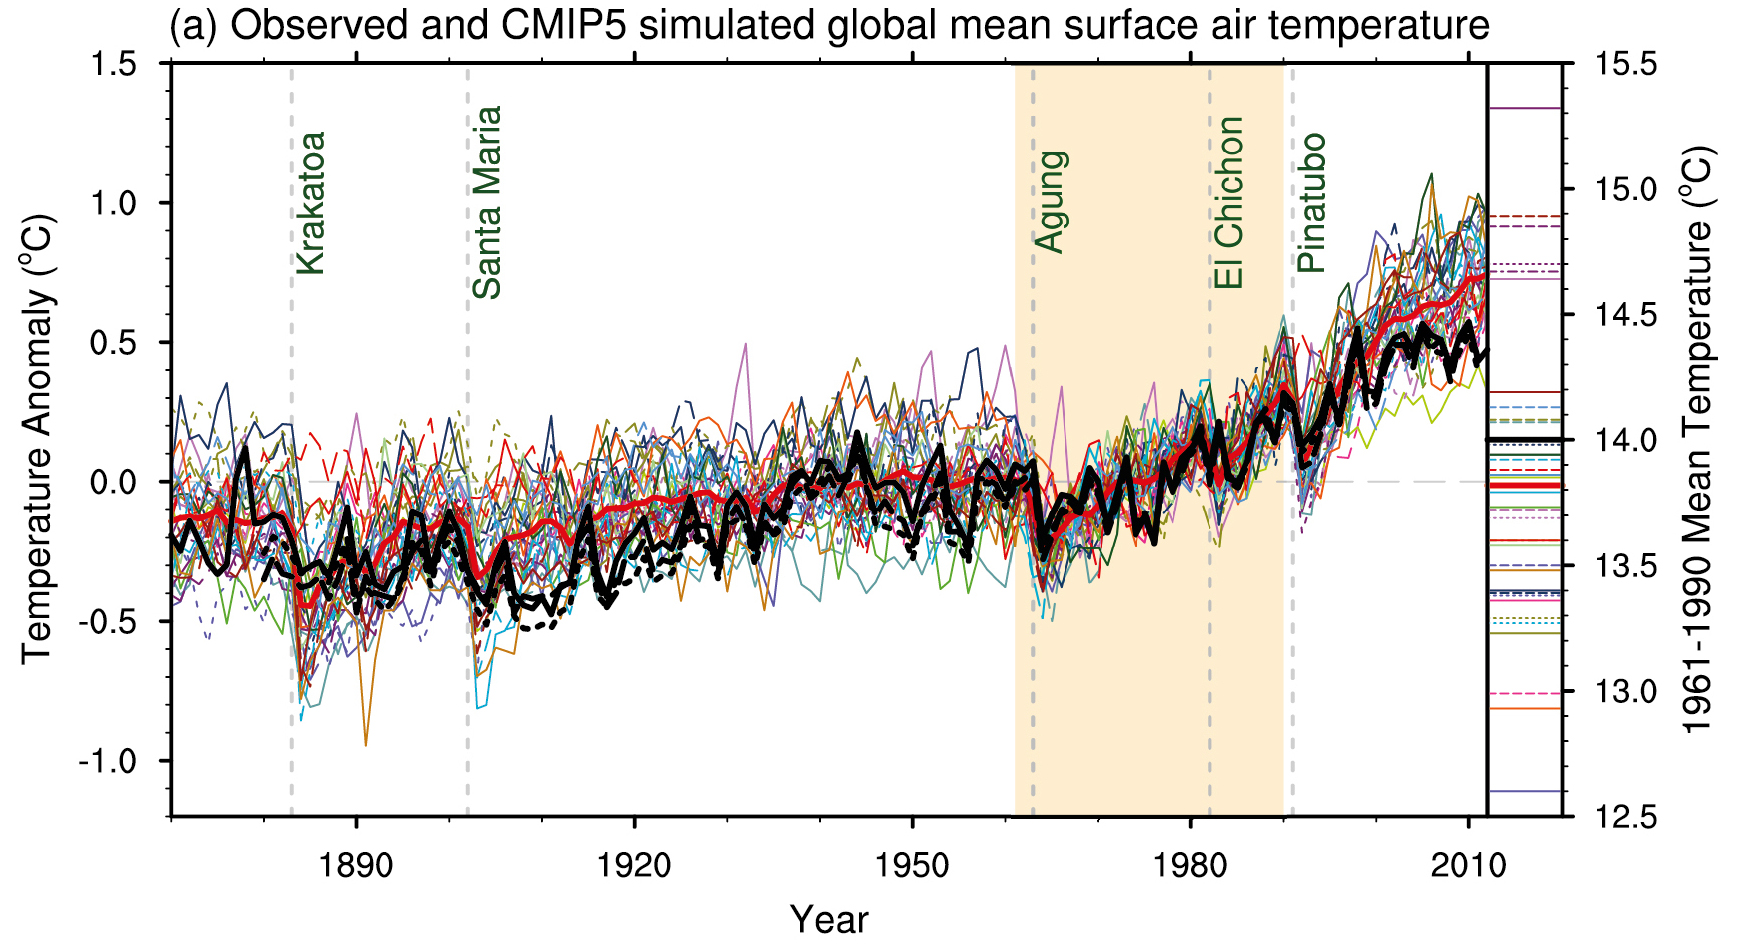
Figure 3 - CMIP5 simulations from the IPCC AR5 WG1 Figure 9.8. Black line indicates the observed global surface temperatures and the coloured lines are the climate model runs.
As shown in Figure 3, the collection of climate models used in the latest IPCC report (CMIP5) do a reasonable job of simulating the observed surface temperatures in the 20th century, but seem to be running too warm for the 21st century. An immediate reaction might be that the models are overestimating recent surface warming, however, given that they simulate the 20th century temperature trend with reasonable fidelity, this doesn't pass muster as a reasonable explanation. What about the long periods in the 20th century where the models do very well? And what about periods, such as the 1960's where the models run too cool? A more likely explanation is that the presumed forcings input into the model simulations, especially over the latter period could be the problem. A recently published research paper, Schmidt (2014), shows that this may indeed be the case.
When utilizing the climate models to project future surface temperature trends certain presumptions have to be made because of external influences on the climate system. Not only do industrial greenhouse gas emissions have to be estimated, but estimates are also made on the behaviour of solar radiation from the sun, and the amount and distribution of light-scattering aerosols in the atmosphere from both natural and human-made sources. In the CMIP5 simulations (shown in Figure 3) the estimated trends for the 21st century were based upon 20th century trends continuing on into 21st century (Taylor [2012], IPCC AR5), but the updated estimates and observations provided by Schmidt (2014) reveal that this did not happen. See figure 4 below.
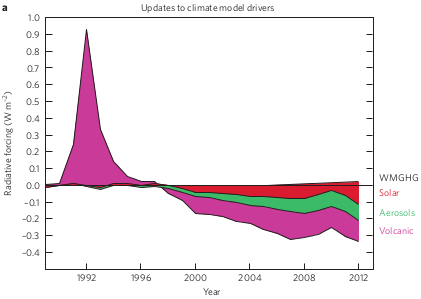
Figure 4 - updated forcing estimates of solar, volcanic, and industrial pollution for the CMIP5 climate model simulations. Image from Schmidt et al (2014).
Based on new observations, improved satellite retrievals, and reanalysis of older data, Schmidt (2014) discovered that the models overestimated the short-term cooling effect of the Mt Pinatubo eruption in 1991, and underestimated the cooling effect of increased volcanic eruptions, industrial pollution, and weaker-than-expected solar radiation in the 21st century. In comparison with the NASA surface temperature dataset, about 33% of the discrepancy in the last 16 years between the CMIP5 multi-model mean and Schmidt (2014) arises due underestimated volcanic emissions, around 15% due to weaker solar activity and El Niño/La Niña timing, and 25% due to industrial pollution.
Rather than the models diverging from reality in recent times, as the CMIP5 models seemed to suggest, it turns out that the data fed into the simulations covering the last two decades was most likely wrong. Of course, this is not going to be the last word on the matter as the uncertainty of the size of the cooling effect of aerosols remains very large. Future observations and improved analysis could either enlarge or reduce the discrepancy further - only time will tell. As it currently stands, when corrected for the cooling and warming influences on Earth's climate, the climate models demonstrate a remarkable agreement with recent surface temperature warming trends.
Posted by Rob Painting on Friday, 28 March, 2014
 |
The Skeptical Science website by Skeptical Science is licensed under a Creative Commons Attribution 3.0 Unported License. |