
Take a look at the history of CO2 emissions from fossil fuels burning. Note - this is not just the story of emissions. This is also the story of the growth of the industrial civilization based on fossil fuels. This is the story of prosperity - people were getting well-off where emissions were growing. This is also the story of political might – countries with high emissions were more powerful economically, politically and militarily - they ruled the world.
This is a world of Great Britain in 18th and early 19th century. This is a world of colonial powers of Europe and USA in the second half of the 19th century and the first half of the 20th century. Those, who didn’t participate in emissions, didn’t also have a real say, even regarding their own issues. Even the most populous countries of Asia were just pawns on the global chessboard – with a notable exception of Japan, who joined the club of powers through fast industrialization. Today is still no different.
Have you been paying attention to the bottom right panel of total annual emissions? Have you noticed their growth in time?
Every person interested in climate change has seen the graph of carbon dioxide emissions from fossil fuels burning.
Figure 1. Growth of carbon dioxide emissions from burning fossil fuels during the period 1751-2012 (black line); source: CDIAC. Blue line represents exponential function growing at a rate of 2.8% per year (i.e. doubling every 25 years).
It’s worth noting that for generations we have witnessed an exponential rise of emissions (growing by constant percentage every year). Sometimes emissions grow more slowly (periods of the Great Depression/WW2 and Oil Crises), sometimes faster (turn of 19th/20th centuries, post WW2 boom), but they go up faster and faster.
A blue line on figure above marks an exponential function growing by 2.8% every year. Such a rate of growth means doubling after 25 years. After 50 years emissions are quadrupled, after 75 years they increase 8-fold, and after 100 years 16-fold. During one doubling (25 years) we emit as much carbon dioxide, as during the whole earlier period since the beginning of the Industrial Revolution. During 27 years, between 1986 and 2012, we have emitted more CO2 from fossil fuels burning than in the whole earlier history of humanity. This is past. What will the future bring? A continuation of the more than 250 years old trend would mean that in period 2010-2050 emissions would triple to 100 bn tons of CO2.
The exponential nature of growth of CO2 emissions is not something unusual. Our world is changing really fast and it is completely different from what it was just a few decades ago. Populations and the global economy are growing: global GDP is increasing, as well as the amount of money in circulation, production and trade exchange. The faster those indexes increase, the more jobs there are and wealth is growing and economists and politicians are pleased as they perceive economic growth as the most important indicator of prosperity and progress.

Figure 2. Key economic trends. Sources: Population: World Population Prospects, UN; Global GDP [USD]: USDA Economic Research Service; Money in circulation [USD]: Estimated Global Monetary Aggregates, M3, Dollar Daze, Global export [USD]: Values and shares of merchandise exports and imports, UNCTADstat; Cars manufactured: Motor vehicles production statistics, OICA; Paper production [tonnes]: Paper+paperboard, FAO; Cement production [tonnes]: Bureau of Mines Minerals Yearbook, USGS Minerals Information.
There is also another side of this coin. With the increasing scale of our economy, we need more and more energy, metals, water, wood, food and a number of other resources. Many of them constitute non-renewable reserves, while others (fish, forests, ...) regenerate only with a certain pace, which should not be exceeded as this may lead to their degradation and depletion. Our economy’s growth is also accompanied by the increase in the amount of produced waste, loss of natural habitats and accelerating species extinction.

Figure 3. Key trends in resources and environmental exploitation. Coal consumption: BP Statistical Review of World Energy [tonnes], Oil consumption [barrels]: BP Statistical Review of World Energy; Iron ore extraction [tonnes]: Bureau of Mines Minerals Yearbook, USGS Minerals Information; Water consumption [m3]: Water withdrawal and consumption, UNEP/GRID-Arendal; CO2 emission from FF burning [tonnes]: Global Fossil-Fuel CO2 Emissions, CDIAC, BP Statistical Review of World Energy; Species extinction rate: Rachel Carson Endangered Species, USGS; Number of low-oxygen dead zones: Global Biodiversity Outlook 3, UNEP Convention on Biological Diversity.
These are not only abstract charts on a piece of paper but a picture of a real world you live in. If it seems to you that pace of changes is accelerating, this is exactly what is happening. You came to live in times where people will have to face the fact that our reserves consumption and impact on environment meet unalterable physical limits. Particular charts, examined separately could raise an alarm every responsible person concerned about our planet, but we have to understand that they are all interconnected. Rising red line of CO2 emissions on the graph above is just one aspect of this world of growth.
Economy as well as the number of manufactured products is growing and at the same time our natural resources consumption and environmental impact is also increasing.
Is it possible that curves presented on the second chart will grow indefinitely, or will their growth begin to slowdown and stop at some point, and then head downwards? With regards to non-renewable natural resources, such as crude oil, gas as well as metal ores, it is the only possible scenario – the only question is, when it is going to happen. With regards to renewable natural resources like forests, fishing grounds and our planet’s ability to absorb our waste, there also exist certain limits breaching of which would be perilous.
When the growth of the resource consumption curves in the second chart slows down and then turns into decline, what will happen to economic curves from the first chart?
What is going to happen when the economy and the financial system requiring constant growth start hitting their limits?
It is not possible to sustain the economic growth when the economy is interlinked with consumption of "hard" natural resources. For example, energy consumption increases at the same pace as global GDP, while CO2 emissions grow even faster.

Figure 4. Changes in the actual global GDP, energy consumption and CO2 emissions from fossil fuels burning.
Let’s take a look at a simple dependency, beginning with identity:

OK, that’s obvious. Now let’s multiply the right side of the equation by two 1’s:
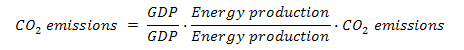
Now let’s slightly transform this identity relation:
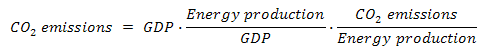
Let’s consider this at a world scale. Politicians and economists do everything they can to maximize the GDP growth – and for a reason: current financial system is stable only in conditions of perpetual exponential growth. The second factor – quantity of energy used for a unit of GDP since 2000 didn’t noticeably change. In 2012 the world economy was 34% larger than in 2000. So was energy consumption. Whereas individual countries may quite easily decrease their emissions just be moving the energy-intensive production abroad (e.g. from EU/US to China), on the global level energy use follows the economy size. What about the third factor – CO2 emissions related to the unit of produced energy? In spite of huge investments in renewable energy sources this relation goes in the wrong direction – the main reason is growing coal share in the energy mix.
How can we visualize the magnitude of the challenge of CO2 emissions reduction? In order to avoid rise of the average Earth’s surface temperature by more than +2°C we will have to reduce our yearly emissions of CO2 from current level of 10 GtC to no more than 1.5 GtC in 2050. This would require emissions reductions by 5% a year.
Meanwhile world’s governments and economists are doing their best to ramp up the GDP growth, saying that 3% is a minimum. In order to reduce the emissions to 1.5GtC a year, quantity of fossil fuels burned per unit of GDP would have to decrease by 8% every year. Currently, insted of falling, it goes in the opposite direction.
What if everyone in the world would enjoy the current way of living of a typical European (assuming the Europe will stop growing and American and Australian will reduce their consumption to the European level)? World GDP would rise 6-fold. We would have to reduce CO2 emissions/GDP to less than 3% of the current level. It means complete decarbonisation of the world’s economy.
If our natural resources consumption and waste production was low in comparison to biosphere’s size, that would not present a problem. However this is not the case, not even now. Furthermore, pressure on increasing natural resources consumption and environment, fuelled by increasing wealth of billions of citizens of China, India and other developing countries desiring to emulate Western lifestyle, is getting more and more intense. Looming growth limits manifest themselves as tension between growing demand and supply that is lagging behind, which is already visible in increasing oil and food prices, as well as wasted ecosystem services and climate change.
Strong economic growth was easy to achieve when with the aid of cheap energy sources we had been developing new areas (mines, agriculture, fishing grounds, etc.) Now easily accessible resources have all been used which makes us reach for those of inferior quality and which are less conveniently located, and the energy is becoming less and less accessible. Moreover, increasing costs of externalities (especially adverse costs of climate change), will take its toll, increasing burden on the economy, and forcing us to allocate more and more resources to disaster relief, infrastructure overhaul and adaptation.
In the extreme case of unyielding adherence to outdated 20th century solutions and lack of proactive steps undertaken – economies may cease to function entirely. Investments level is going to drop, increasing debt is going to result in financial collapse, accompanied by loss of value and trust in currency and slump of the supply system. As a result of this we are going to see economic breakdown, mass unemployment, demise of governments and infrastructure disintegration, which eventually is going to lead to famine and total breakdown of the system.
Formulas for growth stimulation, financial system stabilization as well as energy supply tested by many generations are no longer working – simply because the world without growth is governed by completely different set of rules and those who do not understand this and do not change their way of planning and operating, will land themselves in serious trouble. Short-term actions, oriented at specific problems are going to result in escalation of other problems and exacerbation of long-term situation. We cannot allow this – urgent precautionary actions need to be taken.
Even if we cannot be fully confident of such turn of events or believe it is still distant in time (which probably isn’t), we cannot rule it out completely – it is therefore prudent to „buy insurance” while we still have resources allowing us to effectively take actions. Lack of action may only mean that crisis is going to intensify and we, together with our economy, are going to go steadily downhill, focusing our attention, energy and resources even more on immediate „patching up of the holes” rather than on investments in our future.
What we need is vision presented and decisions made with a long term perspective. We also need systemic changes that are going to ensure that society enters sustainable development path with particular emphasis on Green Tax Reform (tax imposed on resources consumption rather than on work, especially Carbon Tax).
We cannot let ourselves a luxury of failing this “experiment”. We have only one planet.
Posted by Marcin Popkiewicz on Wednesday, 21 May, 2014
 |
The Skeptical Science website by Skeptical Science is licensed under a Creative Commons Attribution 3.0 Unported License. |