Guest post by John Chapman
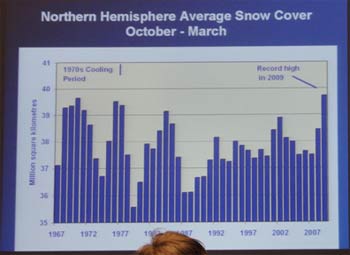
At a recent WUWT tour, David Archibald presents a series of plots to demonstrate that the world isn’t warming. The evidence represents a classic case of cherry picking and it is worth examining some of his submissions to illustrate the technique. One of his slides shows the snow extent of the Northern hemisphere.

That fellow whose head is in the foreground probably thought all this talk of melting ice caps is nonsense. Well the key is the period – October to March. Why was this chosen? If you look at a table of the monthly snow cover area it is clear that these were particularly snowy months, above average for 44 years. Any month before or after the period is below the 44-year average.
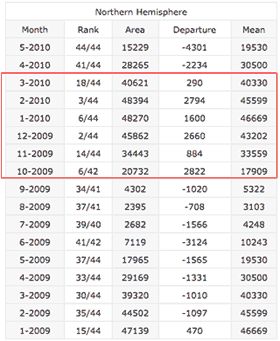
Now if the whole of 2009 had been considered one would obtain the result as reported in the Rutgers University Snow Cover Annual Report 2009.
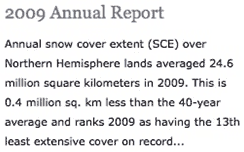
A completely different picture!
To give more non-warming evidence Archibald presents the following slide:
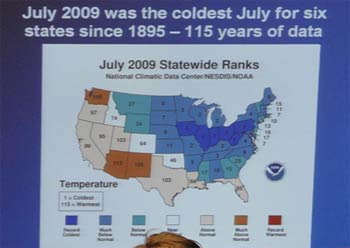
But note the explanation by a meteorologist in some paper of the region;

The June (and probably August) record was quite a different story when the jetstream didn’t dip and when a more global view is considered. From NOAA, the same source as the data in the above slide, “The combined global land and ocean surface temperature for June 2009 was the second warmest on record, behind 2005.” (www.noaanews.noaa.gov/stories2009)
Mention of the jetstream is significant as it is probably responsible for Archibald’s main message later on when dealing with sunspots. All sorts of correlations are made with temperatures in Ireland or Canada, little ice ages, Maunder Minimum, and he extends those correlations to the whole planet. But recent (peer reviewed) research by Mike Lockwood at the University of Reading has found that low solar activity promotes giant kinks in the jetstream, which is responsible for Europe’s recent freezing winter. Furthermore Lockwood’s findings throw light on one of the biggest puzzles of the Little Ice Age – namely that it appeared to be a particularly European phenomenon, with the rest of the world largely spared. A personal communication with Archibald on this salient point was rebuffed with the remark that “people can make statements and those can be printed in black and white but that does not necessarily make them true.” Indeed that particularly applies to authors who write books with content which would otherwise not be accepted by peer reviewed journals.
Back to Archibald’s support for a non-warming world, he brings data closer to the home of the audience, with this slide:
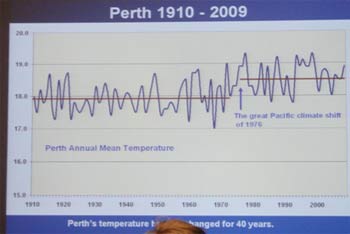
The plot has the partially obscured caption “Perth’s temperature has not changed for 40 years”. If one examines the temperature at the Perth airport site the plot would look like this:
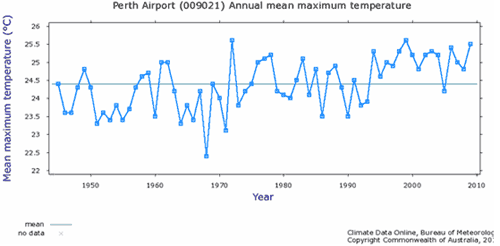
An obvious great Pacific climate shift is not so evident, but a general upward slope is, especially over the past 40 years. One distinction between the plots is that one is the mean while the other is the maximum temperature. The selection that one presents is the one that suits the argument. Now one might think having listened to
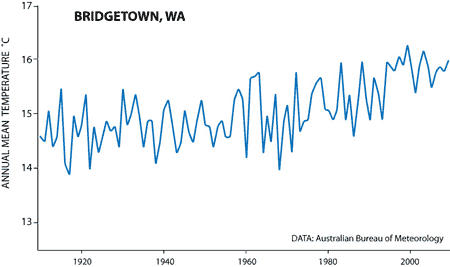
So it is quite clear that there is no persuasive evidence that the world is not warming.
Posted by John Chapman on Monday, 5 July, 2010
 |
The Skeptical Science website by Skeptical Science is licensed under a Creative Commons Attribution 3.0 Unported License. |