Sea level rises as ice on land melts and as warming ocean waters expand. Sea level rise mutually corroborates other evidence of global warming as well as being a threat to coastal habitation and environments.
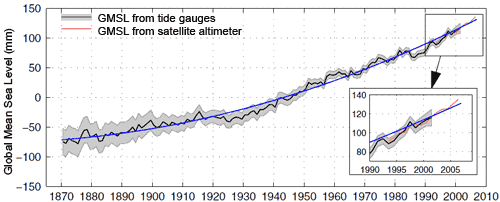
The blue line in the graph below clearly shows sea level as rising, while the upward curve suggests sea level is rising faster as time goes on. The upward curve agrees with global temperature trends and with the accelerating melting of ice in Greenland and other places.
Because the behavior of sea level is such an important diagnostic aid for tracking climate change, skeptics seize on the sea level record in an effort to cast doubt on this evidence. Sea level bounces up and down slightly from year to year so it's possible to cherry-pick data falsely suggesting the overall trend is flat, falling or linear. You can try this yourself. Starting with two closely spaced data points on the graph below, lay a straight-edge between them and notice how for a short period of time you may create almost any slope you prefer, simply by being selective about what data points you use. Now choose data points farther apart. Notice that as your selected data points cover more time, the more your mini-graph reflects the big picture. The lesson? Always look at all the data, don't be fooled by selective presentations.

( graph from Church 2008 )
Other skeptic arguments about sea level concern the validity of observations, obtained via tide gauges and more recently satellite altimeter observations.
Tide gauges must take into account changes in the height of land itself caused by local geologic processes, a favorite distraction for skeptics to highlight. Not surprisingly, scientists measuring sea level with tide gauges are aware of and compensate for these factors. Confounding influences are accounted for in measurements and while they leave some noise in the record they cannot account for the observed upward trend.
Various technical criticisms are mounted against satellite altimeter measurements by skeptics. Indeed, deriving millimeter-level accuracy from orbit is a stunning technical feat so it's not hard to understand why some people find such an accomplishment unbelievable. In point of fact, researchers demonstrate this height measurement technique's accuracy to be within 1mm/year. Most importantly there is no form of residual error that could falsely produce the upward trend in observations.
As can be seen in an inset of the graph above, tide gauge and satellite altimeter measurements track each other with remarkable similarity. These two independent systems mutually support the observed trend in sea level. If an argument depends on skipping certain observations or emphasizes uncertainty while ignoring an obvious trend, that's a clue you're being steered as opposed to informed. Don't be mislead by only a carefully-selected portion of the available evidence being disclosed.
Current sea level rise is after all not exaggerated, in fact the opposite case is more plausible. Observational data and changing conditions in such places as Greenland suggest if there's a real problem here it's underestimation of future sea level rise. The IPCC synthesis reports offer conservative projections of sea level increase based on assumptions about future behavior of ice sheets and glaciers, leading to estimates of sea level roughly following a linear upward trend mimicking that of recent decades. In point of fact, observed sea level rise is already above IPCC projections and strongly hints at acceleration while at the same time it appears the mass balance of continental ice envisioned by the IPCC is overly optimistic ( Rahmstorf 2010 ).
This post is the Basic version (written by Doug Bostrom) of the skeptic argument "Sea level rise is exaggerated". We're currently writing plain English versions of all the skeptic rebuttals. If you're interested in helping with this effort, please contact me.
Posted by Doug Bostrom on Monday, 30 August, 2010
 |
The Skeptical Science website by Skeptical Science is licensed under a Creative Commons Attribution 3.0 Unported License. |