Computer modeler David Evans has written an opinion article published in the Financial Post which has apparently been spread throughout the "skeptic" blogosphere. Numerous readers have asked that Skeptical Science respond to this article, and we aim to please.
The article contains a lot of empty rhetoric about "the carbon gravy train," "alarmists," and governments' "tame climate scientists." There are a whole lot of words in the article devoted to not saying very much. We'll stick to our usual policy and ignore the fluff, focusing on what little scientific content the article contains.
About seven paragraphs in, Evans finally gets to his main point:
"This is the core idea of every official climate model: For each bit of warming due to carbon dioxide, they claim it ends up causing three bits of warming due to the extra moist air. The climate models amplify the carbon dioxide warming by a factor of three — so two-thirds of their projected warming is due to extra moist air (and other factors); only one-third is due to extra carbon dioxide."
There is some truth in this paragraph. We know from fundamental physics that the average global surface temperature will warm approximately 1.2°C from the increased greenhouse effect if the amount of carbon dioxide (CO2) in the atmosphere doubles. But there are feedbacks which respond to this warming and either dampen or amplify it, resulting overall in a best estimate of a total of 3°C surface warming if CO2 doubles. So approximately one-third of the warming is from CO2 alone, and two-thirds from feedbacks, as Evans states.
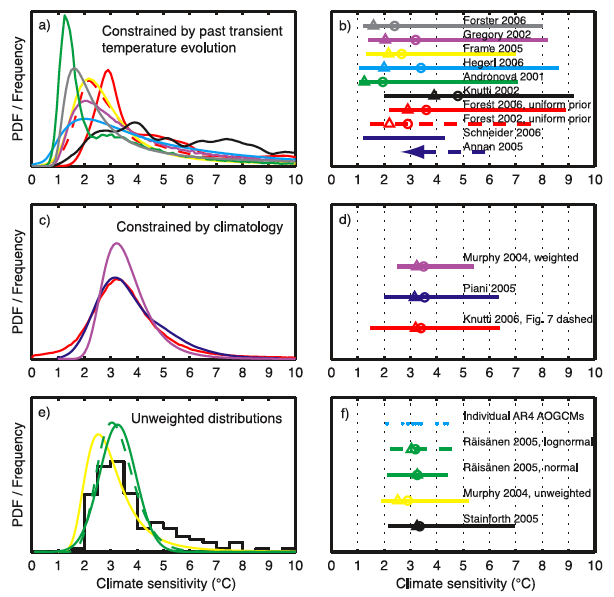
However, the main error Evans makes here is to claim that climate sensitivity is simply a number churned out by climate models. In reality, climate scientists have used many different lines of evidence to create numerous independent estimates of the planet's climate sensitivity. These include not just climate models, but also empirical observational data (Figure 1 and Figure 2).
Figure 1: IPCC climate sensitivity estimates from observational evidence and climate models

Figure 2: Various estimates of climate sensitivity (Knutti and Hegerl 2008)
As these figures show, estimates from both models and observational data consistently find that the most likely climate sensitivity value is approximately 3°C for a doubling of CO2.
Evans follows up his misunderstanding of climate sensitivity estimates by demonstrating an extreme degree of confusion about the tropical troposphere "hot spot":
"The climate models all predict that as the planet warms, a hot spot of moist air will develop over the tropics about 10 kilometres up, as the layer of moist air expands upwards into the cool dry air above. During the warming of the late 1970s, ’80s and ’90s, the weather balloons found no hot spot. None at all. Not even a small one. This evidence proves that the climate models are fundamentally flawed, that they greatly overestimate the temperature increases due to carbon dioxide."
Where to begin? First of all, the 'hot spot' is a predicted consequence of any surface warming, regardless of the cause, based on fundamental atmospheric physics (as we have previously explained). It's true that climate models predict the 'hot spot' will form, because models are based on that fundamental atmospheric physics. So ultimately Evans' beef is not with climate models, but with the physics of the moist adiabatic lapse rate (i.e. see Bengtsson and Hodges [2006]).
Secondly, fundamental physics also tells us that water vapor will be a positive feedback, increasing in response to warming according to the Clausius-Clapeyron relation. Indeed, numerous recent studies using empirical observational data have confirmed the positive water vapor feedback. For example, Dessler et al. (2008):
"Height-resolved measurements of specific humidity (q) and relative humidity (RH) are obtained from NASA's satellite-borne Atmospheric Infrared Sounder (AIRS)...The water-vapor feedback implied by these observations is strongly positive, with an average magnitude of λ q = 2.04 W/m2/K, similar to that simulated by climate models."
There is also a significant amount of evidence that the 'hot spot' exists. This remains an unresolved question, because the radiosonde data from the weather balloons Evans focuses on exclusively is not ideal. Weather balloons were not designed to measure long-term climate changes, especially in moisture. However, other measurements do indicate the presence of a 'hot spot' in the tropical troposphere. More research on the issue is needed, but it is incorrect to say there is no evidence for a 'hot spot'. "Skeptics" normally overstate uncertainty, but ironically in this case, Evans dramatically overstates certainty.
The adiabatic lapse rate also acts as a negative feedback by moving heat higher up into the atmosphere where it can more easily escape, which also serves to cool the surface. By arguing the 'hot spot' doesn't exist, Evans is contradicting his previous claims about negative feedbacks and low climate sensitivity.
Back in 2008, Chris Colose documented and explained Evans' confusion about the 'hot spot,' and suggested, "How Evans continues to go about this “hotspot” issue should be very revealing." I think we have our answer. Evans has not learned from his mistakes, instead choosing to misinform others by propagating his errors to a much wider, and sadly all too receptive audience.
Evans continues demonstrating his misunderstanding of basic climate science with a reference to runaway global warming:
"There are now several independent pieces of evidence showing that the earth responds to the warming due to extra carbon dioxide by dampening the warming. Every long-lived natural system behaves this way, counteracting any disturbance. Otherwise the system would be unstable."
Evans of course provides no evidence for his proclaimed warming dampening (a.k.a. negative feedback and low climate sensitivity). However, his claim that the climate system would be "unstable" otherwise is simply untrue. Each feedback accounts for a limited amount of energy and additional warming, and thus positive feedbacks will not necessarily lead to an unstable system with runaway warming.
Evans proceeds to throw in an false statement about the accuracy of climate models:
"It is no surprise that their predictions of planetary temperature made in 1988 to the U.S. Congress, and again in 1990, 1995, and 2001, have all proved much higher than reality."
Evans apparently refers to the projections made by James Hansen in 1988, and the IPCC reports. In both cases, the projections have proven remarkably accurate.
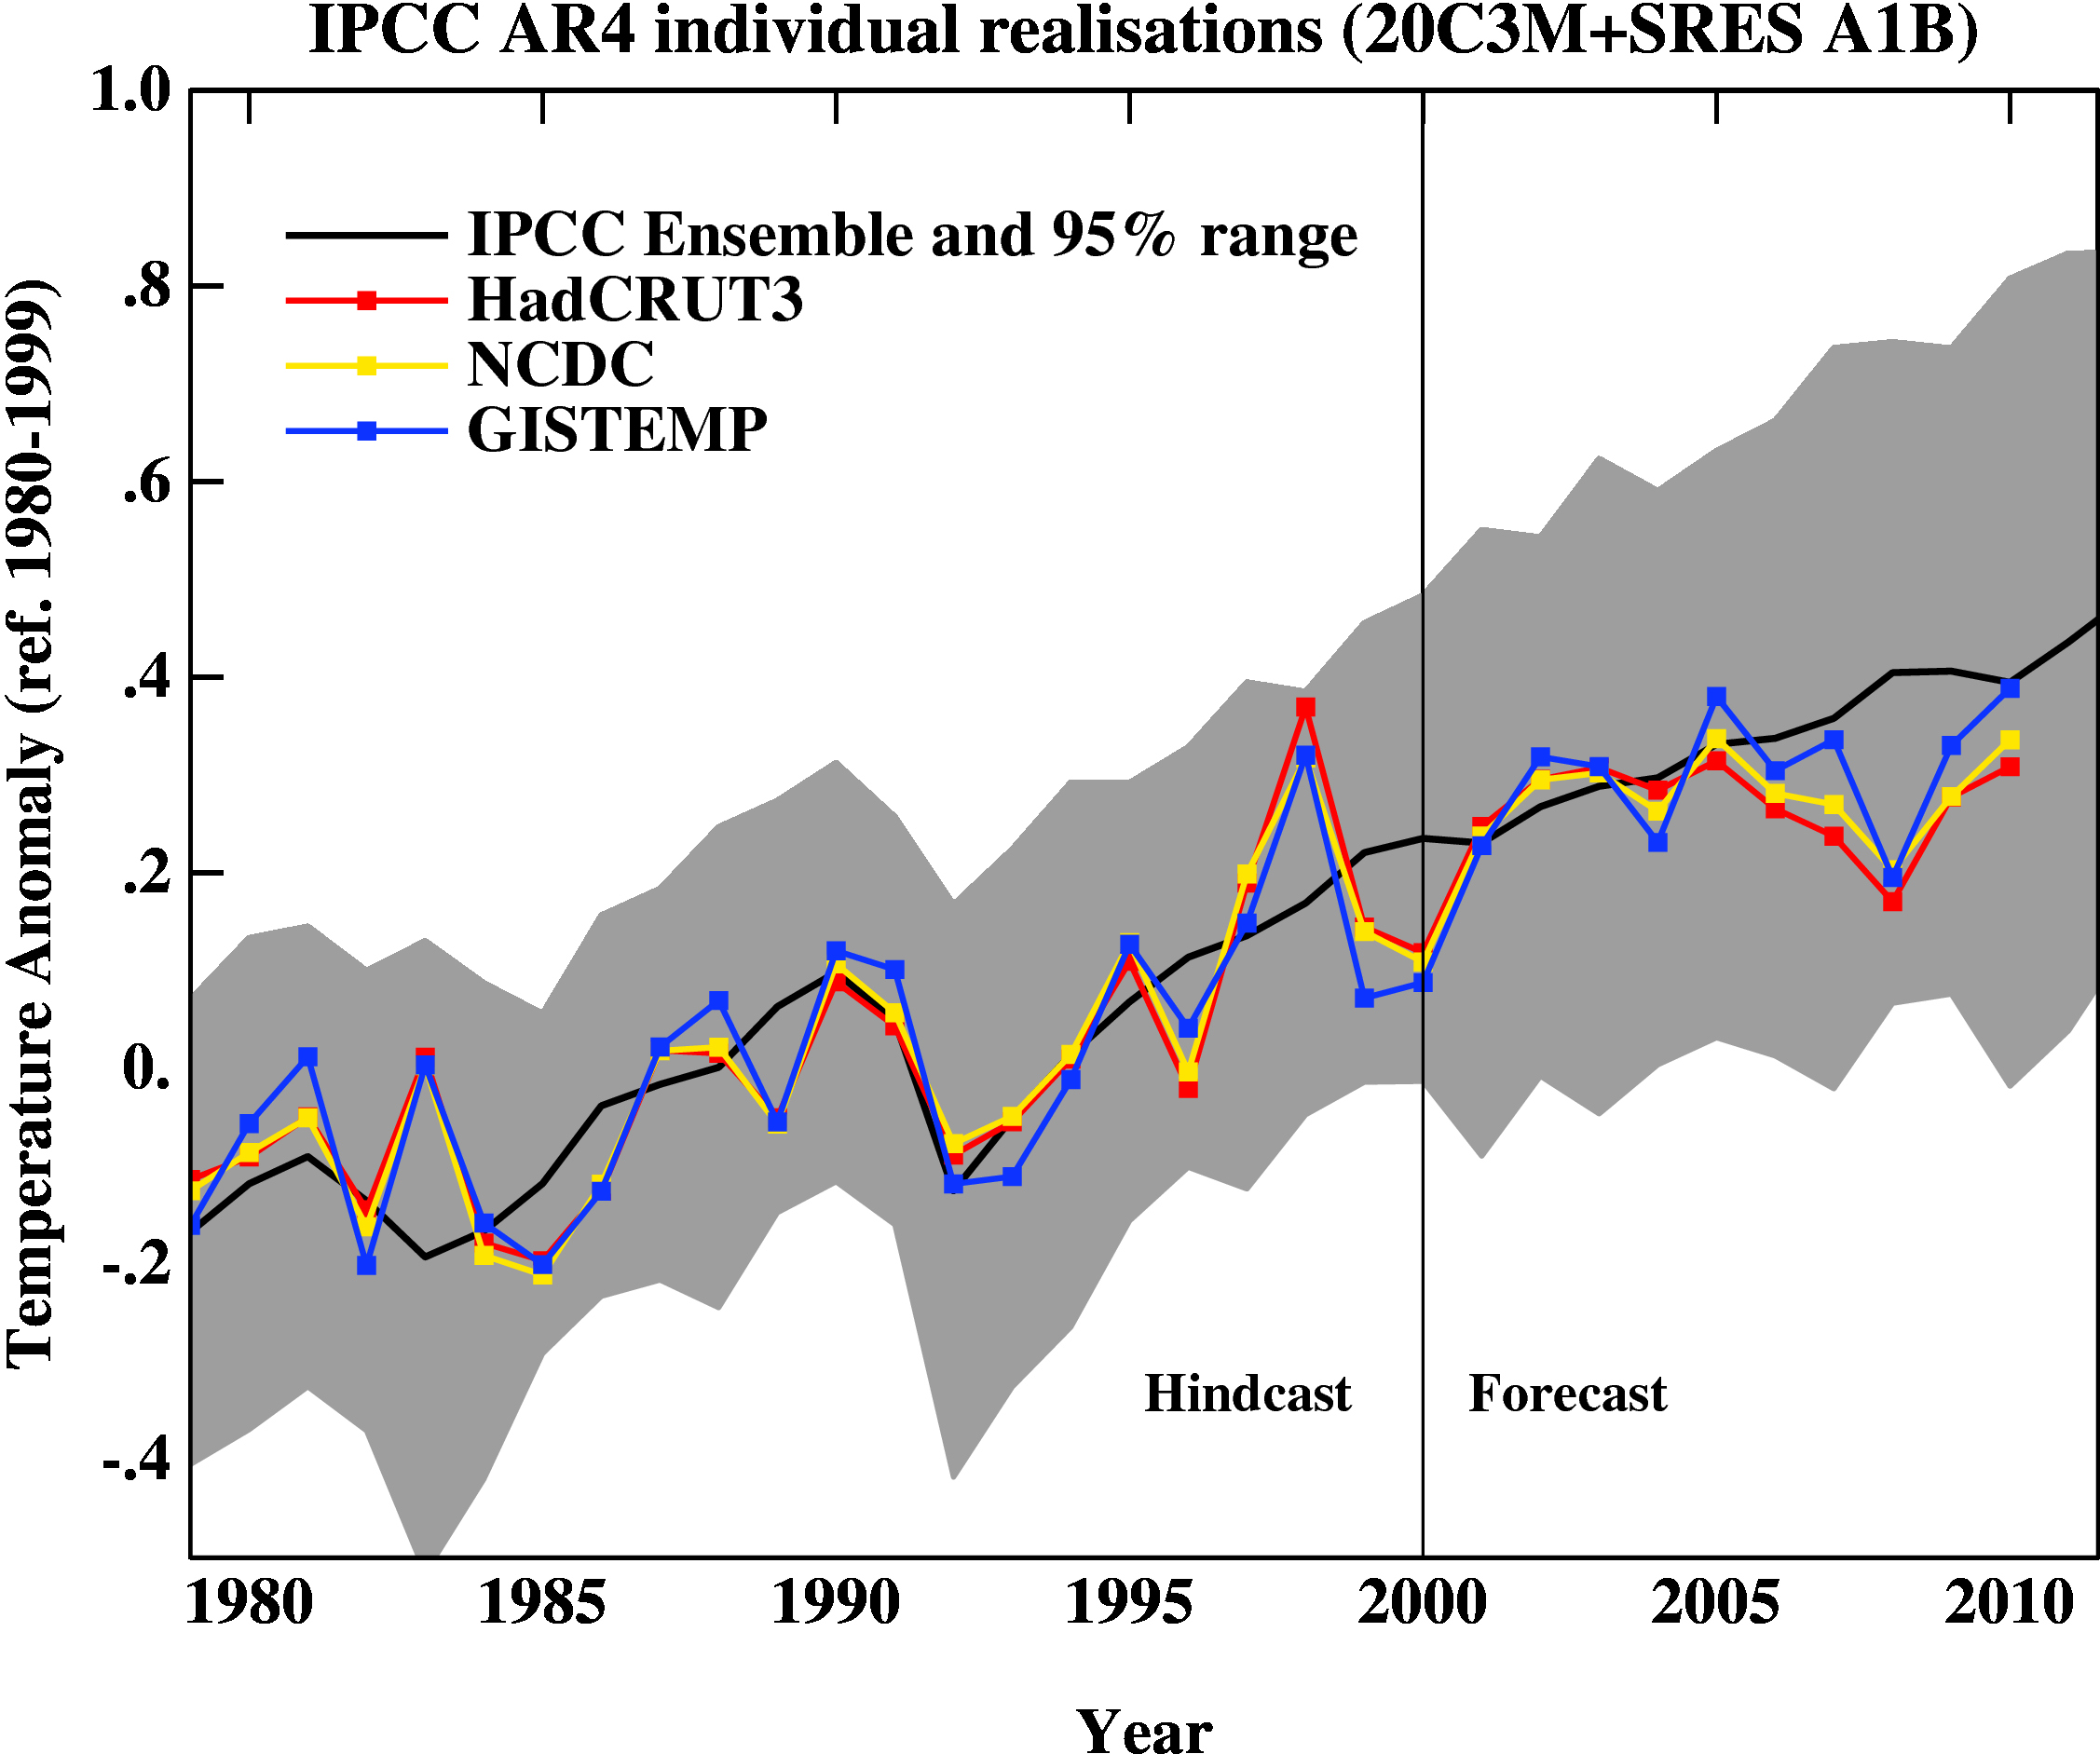
Figure 3: Observed global temperatures since 1980 compared to IPCC AR4 model projections for the business-as-usual A1B scenario. (Source: RealClimate)
In fact as we have previously shown, James Hansen's 1988 projections are consistent with a climate sensitivity of approximately 3.4°C for a doubling of atmospheric CO2, which of course contradicts Evans' principle claim that climate sensitivity is low.
Although he doesn't actually come out and say it, Evans suggests that the global warming trend in the surface temperature record is an artifact caused by the urban heat island (UHI) effect:
"The official thermometers are often located in the warm exhaust of air conditioning outlets, over hot tarmac at airports where they get blasts of hot air from jet engines, at waste-water plants where they get warmth from decomposing sewage, or in hot cities choked with cars and buildings. Global warming is measured in 10ths of a degree, so any extra heating nudge is important."
The "temperature record is unreliable" myth is another one which has been debunked in our database. Rural stations show the same trend as urban stations, "good" stations the same trend as "bad" stations, and satellites the same trend as surface stations. Menne (2010) addressed this concern and found a slight cool bias in poorly-sited stations.
Evans proceeds to commit the common error of cherrypicking short-term temperature changes.
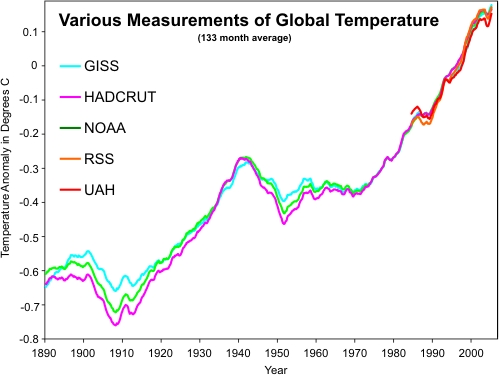
"The satellites say the hottest recent year was 1998, and that since 2001 the global temperature has levelled off."
Even in the satellites, which do not cover the poles (where warming is greatest), 2010 was statistically tied with 1998 as the hottest year on record. This despite the fact that 1998 had one of the strongest El Niño events in a century, and the effects of El Niño are amplified in the satellite temperature record. Further, although the timeframes are too short to be statistically meaningful, the satellite trends since 1998 and 2001 are both positive, and the planet continues to warm:
Evans then wonders:
"Why does official science track only the surface thermometer results and not mention the satellite results?"
This would be a good question, if it were remotely true. In reality, "official science" pays very close attention to satellite temperatures. For example, they're discussed in great detail in the IPCC report and highlighted every single month by NOAA.
Evans then attempts to claim we're just recovering from the Little Ice Age (LIA):
"The Earth has been in a warming trend since the depth of the Little Ice Age around 1680. Human emissions of carbon dioxide were negligible before 1850 and have nearly all come after the Second World War, so human carbon dioxide cannot possibly have caused the trend."
Firstly, almost all of the warming since 1680 has occurred over the past 100 years. Secondly, the planet doesn't just warm and cool magically. There has to be a physical mechanism causing every temperature change, and the factors which causd the LIA cooling are not causing the current warming. The physical evidence clearly shows that carbon dioxide is causing the current warming trend.
Evans continues his gish gallop by trying to blame the Pacific Decadal Oscillation for global warming:
"the Pacific Decadal Oscillation causes alternating global warming and cooling for 25 to 30 years at a go in each direction. We have just finished a warming phase, so expect mild global cooling for the next two decades."
PDO does not cause global warming, it simply shifts heat around from oceans to air and vice-versa. If PDO had caused the recent surface air warming, then the oceans would be cooling. Instead they are warming. Further, PDO is an oscillation. There has been one positive and one negative PDO cycle over the past 60 years, during which time the surface air temperatures warmed approximately 0.6°C. Sorry Evans, you can't blame PDO for that.
Evans finishes up his error-riddled article with the ever more popular "CO2 limits will make little difference" argument:
"Even if we stopped emitting all carbon dioxide tomorrow, completely shut up shop and went back to the Stone Age, according to the official government climate models it would be cooler in 2050 by about 0.015 degrees."
Technically these statements are true. Any country can argue that their nation's greenhouse gas emissions reductions alone can only make a negligible impact on global temperatures. This even includes the USA, despite the fact that the USA is the largest historical CO2 emitter, the second-largest current emitter, and has one of the highest current per capita emissions rates.
This argument can be described as the Tragedy of the Commons: for any individual country acting alone, reducing greenhouse gas emissions could potentially cause an economic disadvantage. And yet, if every country reduces its emissions, the net results will be positive. The key is to convince many countries to simultaneously act to reduce their emissions, which is the purpose of international treaties and conferences like at Kyoto and Copenhagen. But if every nation makes the Evans argument, nobody reduces emissions, and the net result is negative.
To sum up, once you weed through the considerable empty and inflammatory rhetoric in Evans' opinion article, the meat consists of a number of long-debunked myths and gross misunderstandings of basic climate science. Evans' article is the "skeptic" equivalent of eating red hot candies: not much substance, empty calories, but it gets the blood boiling!
NOTE: We sent an edited-down version of this article to the Financial Post and requested that they run it as a response to the Evans editorial; however, the Financial Post ignored our request
Posted by dana1981 on Friday, 15 April, 2011
 |
The Skeptical Science website by Skeptical Science is licensed under a Creative Commons Attribution 3.0 Unported License. |