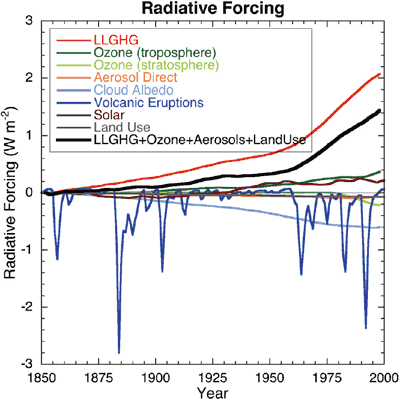
Figure 1: Globally and annually averaged radiative forcing (Chapter 2 of the IPCC AR4).
Change to the Earth's albedo is a powerful driver of climate. When the planet's albedo or reflectivity increases, more incoming sunlight is reflected back into space. This has a cooling effect on global temperatures. Conversely, a drop in albedo warms the planet. A change of just 1% to the Earth's albedo has a radiative effect of 3.4 Wm-2, comparable to the forcing from a doubling of CO2. So is it unreasonable to wonder if albedo might have something to do with this global warming caper?
There are various factors that affect the Earth's albedo. Snow and ice are highly reflective so when they melt, albedo drops. Forests have a lower albedo than open land so deforestation increases albedo (but for the record, no, chopping down all our forests is not the solution to global warming). Aerosols have a direct and indirect effect on albedo. The direct effect is by reflecting sunlight back into space, cooling the Earth. The indirect effect is when aerosol particles act as a cloud condensation nucleus, affecting the formation and lifetime of clouds. Clouds in turn influence global temperatures in various ways. They cool the climate by reflecting incoming sunlight but can also warm the climate by trapping outgoing infrared radiation from the surface.
All these factors are considered when adding up the various radiative forcings that drive climate. Changes in land use are calculated from historical reconstructions of cropland and pastureland changes. Combinations of satellite and surface-based observations allow us to determine trends in aerosol levels as well as cloud albedo effect.

Figure 1: Globally and annually averaged radiative forcing (Chapter 2 of the IPCC AR4).
What we observe is that of the various albedo forcings, cloud albedo is the most dominant effect. The long term trend is that of cooling with a radiative forcing from 1850 to 2000 of -0.7 Wm-2.
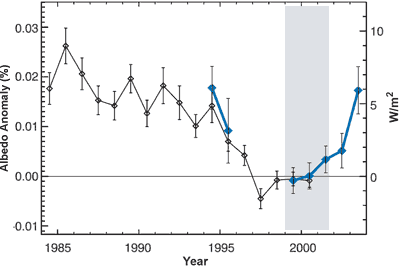
One method to determine the Earth's albedo is to measure earthshine. This is sunlight reflected from the Earth and then reflected from the Moon back to the nighttime Earth. Earthshine has been measured at the Big Bear Solar Observatory since November 1998 (with some measurements in 1994 and 1995). Figure 2 shows changes in albedo calculated in Palle 2004 from reconstructed satellite data (black line) and Earthshine measurements (blue line).

Figure 2: Albedo anomalies reconstructed from ISCCP satellite data (black) and Earthshine-observed albedo anomalies (blue). The right hand vertical scale shows negative radiative forcing (eg - cooling) (Palle 2004).
The data in Figure 2 is problematic. The black line, reconstructed from ISCCP satellite data, "is a purely statistical parameter that has little physical meaning as it does not account for the non-linear relations between cloud and surface properties and planetary albedo and does not include aerosol related albedo changes such as associated with Mt. Pinatubo, or human emissions of sulfates for instance" (Real Climate).
Even more problematic is the spike in albedo around 2003, shown by the blue earthshine line. This is in sharp contrast to satellite measurements which showed little to no trend over the same period. To put this in perspective, consider the Pinutabo volcanic eruption in 1991 which spewed aerosols into the atmosphere. These aerosols reflected incoming sunlight, causing a negative radiative forcing of 2.5 Wm-2. This led to a dramatic drop in global temperatures. The earthshine data indicated a radiative forcing of nearly -6 Wm-2 which should've caused a precipitous drop in global temperatures. No such drop occured (Wielicki 2007).
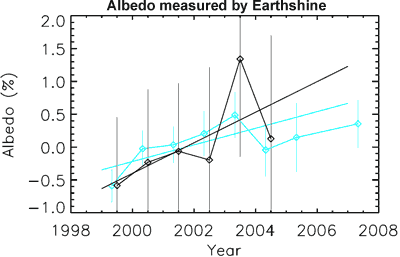
In 2008, the reason for the discrepancy was discovered. The Big Bear Solar Observatory installed a new telescope in 2004 to measure earthshine. With the new and improved data, they recalibrated their old data and updated their earthshine albedo results (Palle 2008). Figure 3 shows the old albedo data (black) and the updated albedo (blue). The anomalous 2003 spike disappears. Nevertheless, a trend of increasing albedo remains from 1999 to 2003.

Figure 3: Earth albedo anomalies as measured by earthshine. In black are the albedo anomalies published in 2004 (Palle 2004). In blue are the updated albedo anomalies after improved data analysis, which also include more years of data (Palle 2008).
How accurate is the earthshine method in determining global albedo? For starters, the method doesn't give a global albedo estimate. It covers about one third of the Earth at each observation occasion and certain areas can never be ‘‘seen’’ from the measurement site. Furthermore the measurements are sparsely sampled in time, and only made in a narrow wavelength band of 0.4 to 0.7 µm (Bender 2006).
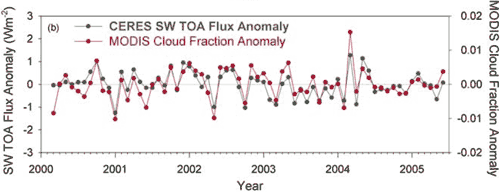
In contrast, satellite data such as CERES is a truly global measure of the Earth’s reflected shortwave radiation, including the effects of all atmospheric and surface properties. It covers a broader spectrum than earthshine (0.3–5.0 µm). Loeb 2007a compares 4 independent sets of satellite data: CERES, MODIS, MISR and SeaWiFS. Albedo as measured by CERES shows no long term trend from March 2000 to June 2005. They also find "remarkable consistency" between the 4 satellite results.

Figure 4: Monthly anomalies in global mean CERES SW TOA flux and MODIS cloud fraction (Loeb 2007b).
So albedo has had an effect on global temperatures - mostly a cooling effect on long term trends. As for recent albedo trends, earthshine data shows increasing albedo from 1999 to 2003 but little to no trend from 2003. Satellites show little to no trend since 2000. The radiative forcing from albedo changes in recent years appears to be minimal.
For more info, see Papers on the albedo of the Earth by AGW Observer.
Posted by John Cook on Thursday, 5 November, 2009
 |
The Skeptical Science website by Skeptical Science is licensed under a Creative Commons Attribution 3.0 Unported License. |