After a rapid rise in global surface air temperatures during the late 1970s to 1990s, the rate of global warming in the last decade or so has slowed. A recent scientific paper, Kaufmann (2011), suggests that once relevant factors are taken into consideration, the observed slow-down from 1998-2008 is in line with scientific understanding of the climate.
Rapid industrialization in East Asia, particularly China, led to a big jump in sunlight-reflecting sulfate aerosol pollution, mainly through coal burning. This additional reflective aerosol pollution sheilded the Earth from greater warming, but is only a temporary reprieve. Sulfates have a short lifetime in the atmsophere, and when East Asia stops burning so much coal, the Earth is going to get an extra nudge in warming.

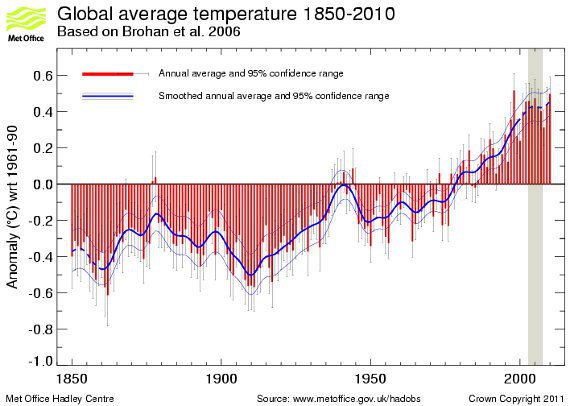
Figure 1 - Hadley Centre temperature record (HADCRUT3).The red bars show the global annual average near-surface temperature anomalies from 1850 to 2009. The error bars show the 95% uncertainty range on the annual averages. The thick blue line shows the annual values smoothed. Vertical banded column indicates the 'slow-down' period.
The Hadley Centre dataset shows less global warming, compared to other records, primarily because it excludes measuring the Polar regions where warming is happening much faster than the global average. However the Hadley data still shows the decade 2000-2009 as the warmest on record. Looking at the above graph, it's clear that, despite the long-term warming trend, there are a number of short-term periods where global temperature shows little or no warming. So another slow-down in warming is hardly a novel observation.
To identify what may have led to this slow-down, Kaufmann (2011) use a statistical model to compare natural and human-caused forcings. They find that the increase in greenhouse gases was exceeded by an even greater increase in sunlight-reflecting sulfate aerosols, which originate from the rapid industrialization of China. Chinese coal-burning in particular doubled in the 4 years from 2003-2007, and makes up some 77% of the 26% global increase over that time.
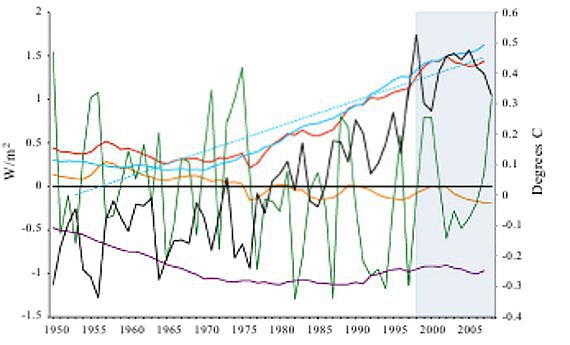
The result of the modeling is that the cooling effect of sulfates nearly cancels out the warming effect of greenhouse gases, allowing natural processes to control the climate. In this interval, the small drop in sunlight reaching the Earth as part of the natural solar cycle, coupled with more episodes of La Niña (natural globally cool episodes) leads to a much smaller push in the direction of warming.

Figure 2 - Radiative forcing of human-caused sulfur emissions (purple line), net human-caused forcing (blue line), linear estimate of net human-caused forcing (blue dash), total radiative forcing (red line), radiative forcing of solar insolation (orange line), and observed temperature (black). The Southern Oscillation Index (divided by 10) is given in green. SOI data are presented as annual mean sea level pressure anomalies at Tahiti and Darwin. Post-1998 period of interest (highlighted gray). From Kaufmann (2011).
Kaufmann (2011) looks at other factors, such as Black Carbon (soot), and possible cooling caused by a reduction in water vapor in the stratosphere, however these are found to have a negligible effect on global temperature.
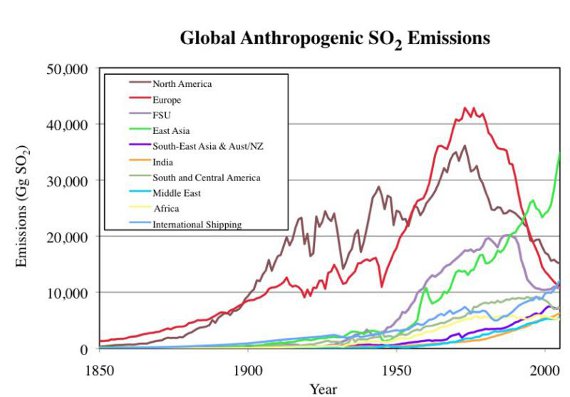
Smith (2011) look at human sulfate emissions from 1850-2005, based on estimates of production and consumption. They find a drop in the last part of the 20th century, but from 2000 to 2005 there is a big increase, largely from East Asia (China) and international shipping. So, this study is pretty much in agreement with the emissions data from Kaufman (2011).

Figure 3 - Global sulfur dioxide emissions by region (North America = USA+Canada; East Asia = Japan, China, and South Korea). From Smith (2011).
Being based on a statistical model, rather than a climate model, Kaufmann 2011 can't tell us how a dramatic increase in East Asian sulfate pollution can have such a global effect; however, there has been earlier work addressing this question.
Rasch (2000) use the NCAR climate model to quantify the effect of reflective sulfate aerosols based on their location, or source. Those emissions which come from the Asian region are quite different from those that stem from pollution in North America and Western Europe. Unlike those regions, emissions from Asia are able to reach the upper atmosphere and spread out over both hemispheres, and thereby have a greater global impact.
Manktelow (2009) looked not only at the sulfate aerosols themselves, but also the impact they have on cloud formation. Their model reveals that both North America and East Asia have an impact 3 to 4 times greater than Europe because local weather patterns are able to loft sulfates up into the upper atmosphere, affecting cloud-forming processes. Once again demonstrating that not all sulfate emissions are created equal; Asia in particular packs a greater wallop.
If the findings of Kaufmann (2011) are confirmed by other research, and it is accepted that East Asian sulfate pollution shielded the Earth from greater warming during 1998-2008, this is both good and bad news. It's good that the planet did not suffer greater warming, but bad because this effect is only temporary.
Sulfate aerosols have a short lifetime in the atmosphere, often measured in weeks and months, but up to 3 years if they reach the upper atmosphere. In contrast, greenhouse gases, especially CO2, will linger for centuries everywhere in the atmosphere. As East Asia begins to install smokestack scrubbers to reduce sulphate pollution, and they need to for reasons such as health and acid rain , then the cooling effect of those reflective aerosols will be lost. Once that happens we should observe a noticeable increase in global warming.
Posted by Rob Painting on Friday, 15 July, 2011
 |
The Skeptical Science website by Skeptical Science is licensed under a Creative Commons Attribution 3.0 Unported License. |