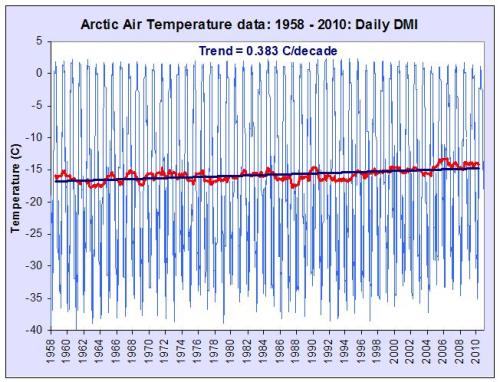
Figure 1: DMI daily temperature values, annual average and linear trend over the entire record period
What The Science Says:
While summer maximums have showed little trend, the annual average Arctic temperature has risen sharply in recent decades.
Climate Myth: DMI show cooling Arctic
From DMI we learn, that Arctic 80N-90N temperatures in the melt season this year is colder than average. This was the case last year too, while earlier years in the DMI analysis period (1958-2010) hardly ever shows Arctic melt season temperatures this cold (Frank Lansner)
A recent WUWT article by Frank Lansner, August 5th 2010 has the heading “DMI polar data shows cooler Arctic temperature since 1958”. Peter Berenyi also posted a similar chart here on SkS.
If we look at the Danish Meteorological Institute (DMI) Arctic temperature records, we see that every year the Arctic Surface temperatures rise to a maximum of just above 0 degrees C in summer, before falling again to extremely cold temperatures in the long dark winters. As each summer advances, the ice surface temperature rises, until the melting point of ice is reached. At this point any further thermal energy is used to melt the ice, and the surface temperature (and the air just above it) can not increase while any significant amount of ice remains. At present there are still significant amounts of sea ice above 80 degrees North through the Summer melt season.
It is well documented that annual average Arctic air temperatures have increased over the past few decades, at a rate around twice the global average. How are these temperature records reconciled with the DMI summer data?
If we look at the entire official daily DMI data set, we can quickly see that the Summer temperatures do not vary much over the entire record (much as in the Lansner chart), but the Winter temperatures have significantly increased, visible even on this zoomed out vertical scale which includes the large seasonal variations.
Figure 1: DMI daily temperature values, annual average and linear trend over the entire record period
Fitting a simple linear trend to the data, we see that the DMI trend over the recorded period is positive at 0.37 degrees C/decade, roughly twice the reported global average (from surface measurement data sets and satellite data), entirely in keeping with other reported Arctic temperature data from multiple sources (such as Bekryaev 2010, which gives 0.364 degrees C/decade over a similar 1958 to 2008 period).
If we look at the DMI 12 month anomaly trend (pink, offset for clarity) compared with the reported “fall” in “Melt season” temperatures (green), we see the Lansner chart in context. This chart is therefore highly misleading.
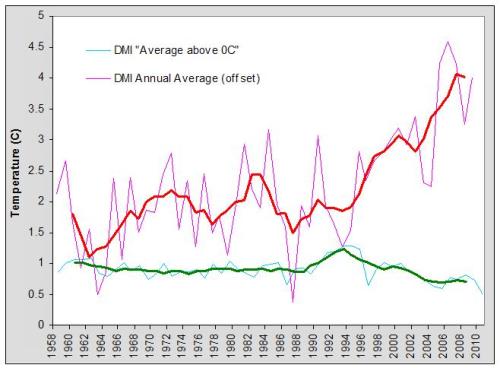
Figure 2: DMI summer melt season temperatures and annual DMI temperature anomaly as well as five year running averages
 |
The Skeptical Science website by Skeptical Science is licensed under a Creative Commons Attribution 3.0 Unported License. |