What The Science Says:
Every part of the Earth's climate system has continued warming since 1998, with 2015 shattering temperature records.
Climate Myth: It hasn't warmed since 1998
For the years 1998-2005, temperature did not increase. This period coincides with society's continued pumping of more CO2 into the atmosphere. (Bob Carter)
Even if we ignore long term trends and just look at the record-breakers, 2015, 2014, 2010, and 2005 were hotter than 1998.
The myth of no warming since 1998 was based on the satellite record estimates of the temperature of the atmosphere. However, as discussed in the video below by Peter Sinclair, even that argument is no longer accurate. The satellites show warming since 1998 too.
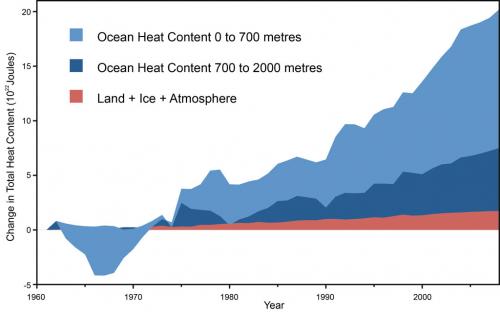
To claim global warming stopped in 1998 also overlooks a simple physical reality - the land and atmosphere are just a small fraction of the Earth's climate (albeit the part we inhabit). The entire planet is accumulating heat due to an energy imbalance. The atmosphere is warming. Oceans are accumulating energy. Land absorbs energy and ice absorbs heat to melt. To get the full picture on global warming, you need to view the Earth's entire heat content. More than 90% of global warming heat goes into warming the oceans, while less than 3% goes into increasing the atmospheric and surface air temperatures. Nuccitelli et al. (2012) showed that the Earth has continued to heat up since 1998.
Figure 1: Land, atmosphere, and ice heating (red), 0-700 meter OHC increase (light blue), 700-2,000 meter OHC increase (dark blue). From Nuccitelli et al. (2012).
In 1998, an abnormally strong El Niño caused heat transfer from the Pacific Ocean to the atmosphere. Consequently, we experienced above average surface temperatures. Conversely, the 2000s saw predominantly La Niña conditions, which had a cooling effect on global temperatures. As a result, the warming of atmosphere and surface temperatures temporarily slowed. They've now started to speed up again, and the planet as a whole has kept on heating up the whole time.
With so much internal variability, scientists employ statistical methods to discern long-term trends in surface temperature. The easiest way to remove short-term variations, revealing any underlying trend, is to plot a moving average, performed in Waiting for Cooling, Fawcett & Jones (2008). Figure 3 displays the 11-year moving average - an average calculated over the year itself and five years either side. They've used three different data-sets - NCDC, NASA GISS and the British HadCRUT3. In all three data-sets, the moving average shows no sign that the warming trend has reversed.
Figure 2: Globally-averaged annual mean temperature anomalies in degrees Celsius, together with 11-year unweighted moving averages (solid lines). Blue circles from the Hadley Centre (British). Red diamonds from NASA GISS. Green squares from NOAA NCDC. NASA GISS and NOAA NCDC are offset in vertical direction by increments of 0.5°C for visual clarity.
Next, Fawcett and Jones look for a cooling trend in the 10 years since 1998. They find the linear trend over 1998 to 2007 is a warming trend in all three data-sets. Note that HadCRUT3 displays less warming than NASA GISS and NCDC. This is most likely due to the fact that HadCRUT data doesn't cover parts of the Arctic where there has been strong warming in recent years.
Figure 3: Linear trends (solid lines) in the three global annual mean temperature anomaly time series over the decade 1998-2007.
Cowtan & Way (2013) also evaluates global surface warming across the globe by using a statistical method known as 'kriging' andby using satellite data to fill in the gaps where there are no temperature stations. Their study shows that the global surface warming trend for 1997–2015 is approximately 0.14°C per decade.
In addition to removing the ENSO signlal, Foster & Rahmstorf (2011) used multiple linear regression to remove the effects of solar and volcanic activity from the surface and lower troposphere temperature data. Their results are shown in the animation below.
Figure 4: Five data sets (GISS, NCDC, HadCRU, UAH, and RSS) with and without the effects of ENSO, solar irradiance, and volcanic emissions removed. Data from Foster and Rahmstorf 2011, animation created by Dana Nuccitelli.
When removing these short-term effects, the warming trend has barely even slowed since 1998 (0.163°C per decade from 1979 through 2010, vs. 0.155°C per decade from 1998 through 2010, and 0.187°C per decade for 2000 through 2010).
To sum up, every component of the Earth's climate has continued to warm since 1998. The myth of no warming during that time was based on the satellite record of atmospheric temperatures, which now shows warming. Surface and ocean temperatures have risen, as have sea levels, while ice has melted, spring is starting earlier, and so on. 2015 was hotter than 2010, which was hotter than 2005, which was hotter than 1998. A monster El Niño event made 1998 relatively hot at the surface and in the atmosphere, but Earth has continued warming rapidly over the past 18 years.
Update July 2015:
Here is a related lecture-video from Denial101x - Making Sense of Climate Science Denial
This rebuttal was updated by Kyle Pressler in September 2021 to replace broken links. The updates are a result of our call for help published in May 2021.
 |
The Skeptical Science website by Skeptical Science is licensed under a Creative Commons Attribution 3.0 Unported License. |