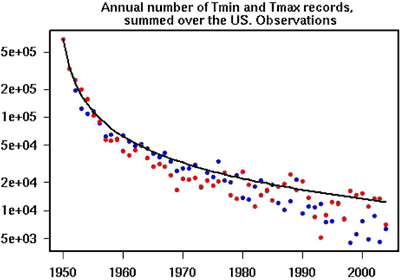
Figure 1: Annual numbers of record high maximum temperatures (red dots) and record low minimum temperatures (blue dots) averaged over the entire US region. Black line is the theoretical values assuming no global warming or cooling.
What The Science Says:
Since the mid 1970s, global temperatures have been warming at around 0.2 degrees Celsius per decade. However, weather imposes its own dramatic ups and downs over the long term trend. We expect to see record cold temperatures even during global warming. Nevertheless over the last decade, daily record high temperatures occurred twice as often as record lows. This tendency towards hotter days is expected to increase as global warming continues into the 21st Century.
Climate Myth: It's freaking cold!
"Austria is today seeing its earliest snowfall in history with 30 to 40 centimetres already predicted in the mountains. Such dramatic falls in temperatures provide superficial evidence for those who doubt that the world is threatened by climate change." (Mail Online)
Since the mid 1970s, global temperatures have been warming at around 0.2°C per decade. However, weather imposes it's own dramatic ups and downs over the long term trend. So we expect to see record cold temperatures even during global warming. Nevertheless, who hasn't heard someone on a cold day mutter "what happened to global warming?!" It's human nature to remember unusual events: record heat waves and freezing cold spells. Mentally calculating long term statistical trends doesn't come quite as easy as recalling that cold morning a few winters ago or that sweltering heat wave last summer. However, we can learn something about climate trends from those record hot and cold days.
Consider a record daily high to mean that temperatures were warmer on that day than on the same date throughout a weather station's history. As time passes, the number of record high and low temperatures will diminish. This is because as the years roll on and records accumulate, it becomes increasingly difficult to break a record. A new paper (Meehl et al. 2009) examines the record highs and lows since 1950. Figure 1 shows the number of record high temperatures (red dots) and record low temperatures (blue dots). If temperatures weren't warming, we would expect the number of record highs and lows to be roughly equal. Instead, the highs and lows diverge over time with gradually more record highs than lows.

Figure 1: Annual numbers of record high maximum temperatures (red dots) and record low minimum temperatures (blue dots) averaged over the entire US region. Black line is the theoretical values assuming no global warming or cooling.
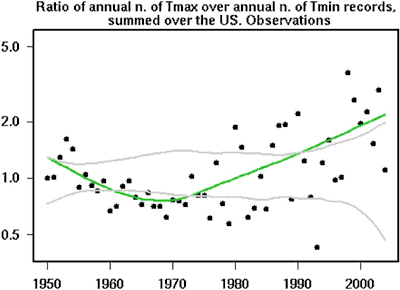
To examine this further, the ratio of record highs versus record lows were calculated for each year. Figure 2 shows the yearly ratio as black dots. The solid green line is the smoothed trend. During a period of global cooling in the 1960s, there were more record lows than highs. However, when the global warming period began in the 1970s, the ratio of highs to lows began to increase. Over the last decade, daily record high temperatures occurred twice as often as record lows.

Figure 2: observations of the ratio of record highs to record lows each year (dots), solid line is a smoothed curve fit.
So we see that even during global warming, cold days are expected. However, there's a much greater chance of daily record highs instead of lows. This tendency towards hotter days is expected to increase as global warming continues into the 21st Century.
Intermediate rebuttal written by John Cook
This rebuttal was updated by Judith Matz in September 2021 to replace broken links. The updates are a result of our call for help published in May 2021.
 |
The Skeptical Science website by Skeptical Science is licensed under a Creative Commons Attribution 3.0 Unported License. |