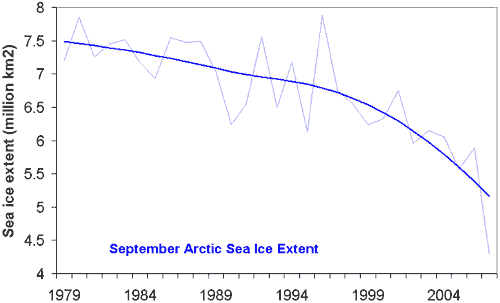
Figure 1: September Arctic Sea Ice Extent (thin, light blue) with long term trend (thick, dark blue). Sea ice extent is defined as the surface area enclosed by the sea ice edge (where sea ice concentration falls below 15%).
What The Science Says:
Arctic sea ice has been retreating over the past 30 years. The rate of retreat is accelerating and in fact is exceeding most models' forecasts.
Climate Myth: Arctic icemelt is a natural cycle
"In 2007, the Northern Hemisphere reached a record low in ice coverage and the Northwest Passage was opened. At that point, we were told melting was occurring faster than expected. What you were not told was that the data that triggered this record is only available back to the late 1970s. We know the Northwest Passage had been open before." (Matt Rogers)
Global warming affects Arctic sea ice in various ways. Warming air temperatures have been observed over the past 3 decades by drifting buoys and radiometer satellites (Rigor et al. 2000, Comiso 2003). Downward longwave radiation has increased, as expected when air temperature, water vapor and cloudiness increases (Francis & Hunter 2006). More ocean heat is being transported into Arctic waters (Shimada et al. 2006).
As sea ice melts, positive feedbacks enhance the rate of sea ice loss. Positive ice-albedo feedback has become a dominant factor since the mid-to-late 1990s (Perovich et al. 2007). Older perennial ice is thicker and more likely to survive the summer melt season. It reflects more sunlight and transmits less solar radiation to the ocean. Satellite measurements have found over the past 3 decades, the amount of perennial sea ice has been steadily declining (Nghiem et al. 2007). Consequently, the mean thickness of ice over the Arctic Ocean has thinned from 2.6 meters in March 1987 to 2.0 meters in 2007 (Stroeve et al. 2008).
Global warming has a clearly observed, long term effect on Arctic sea ice. In fact, although climate models predict that Arctic sea ice will decline in response to greenhouse gas increases, the current pace of retreat at the end of the melt season is exceeding the models’ forecasts by around a factor of 3 (Stroeve et al. 2007).
Figure 1: September Arctic Sea Ice Extent (thin, light blue) with long term trend (thick, dark blue). Sea ice extent is defined as the surface area enclosed by the sea ice edge (where sea ice concentration falls below 15%).
The sudden drop in sea ice extent in 2007 exceeded most expectations. The summer sea ice extent was 40% below 1980's levels and 20% below the previous record minimum set in 2005. The major factor in the 2007 melt was anomalous weather conditions.
An anticyclonic pattern formed in early June 2007 over the central Arctic Ocean, persisting for 3 months (Gascard et al. 2008). This was coupled with low pressures over central and western Siberia. Persistent southerly winds between the high and low pressure centers gave rise to warmer air temperatures north of Siberia that promoted melt. The wind also transported ice away from the Siberian coast.
In addition, skies under the anticyclone were predominantly clear. The reduced cloudiness meant more than usual sunlight reached the sea ice, fostering strong sea ice melt (Kay et al. 2008).
Both the wind patterns and reduced cloudliness were anomalies but not unprecedented. Similar patterns occurred in 1987 and 1977. However, past occurences didn't have the same dramatic effect as in 2007. The reason for the severe ice loss in 2007 was because the ice pack had suffered two decades of thinning and area reduction, making the sea ice more vulnerable to current weather conditions (Nghiem et al. 2007).
Vinnikov et al. (1999) estimated the probability that the Arctic sea ice decline could simply be natural. The authors used very long control runs of both the Geophysical Fluid Dynamics Laboratory (GFDL) and Hadley Centre climate models (5,000 years for the GFDL model) to assess the probability that the observed and model-predicted trends in Arctic sea ice extent occur by chance as the result of natural climate variability. They found that large trends in sea ice extent only appeared over short time intervals in the control run, due to natural variability alone. This suggests that natural variability will not cause large long-term Arctic sea ice trends.
Updating this analysis using observational data through 2011 (not even including the 2012 record low sea ice extent), the 32-year trend (1979-2011) is -530 thousand square km per decade, and the 20-year trend is -700 thousand square km per decade. Using the Vinnikov et al. results, these trends both correspond to probabilities of well under 0.1% of being due solely to natural variability.
Day et al. (2012) used five climate models to try and quantify the contribution of natural variations in Arctic sea ice changes. They found that between 5% and 30% of the Arctic sea ice decline from 1979 to 2010 could be attributed to the natural cycles of the Atlantic Multidecadal Oscillation (AMO) and Arctic Oscillation (AO), and even less can be attributed to natural cycles since 1953, since these natural cycles tend to average out over longer timeframes (as Vinnikov et al. also found).
"despite increased observational uncertainty in the pre-satellite era, the trend in [Arctic sea ice extent] over this longer period [1953–2010] is more likely to be representative of the anthropogenically forced component."
Stroeve et al. (2011) noted that in 2009-2010, the AO was in a state which should have resulted in a large sea ice extent; the fact that 2010 was a year of relatively low sea ice extent is indicative long-term human-caused sea ice decline.
"Based on relationships established in previous studies, the extreme negative phase of the Arctic Oscillation (AO) that characterized winter of 2009/2010 should have favored retention of Arctic sea ice through the 2010 summer melt season. The September 2010 sea ice extent nevertheless ended up as third lowest in the satellite record, behind 2007 and barely above 2008, reinforcing the long-term downward trend."
Notz and Marotzke (2012) also found very poor correlation between the AO and Pacific Decadal Oscillation (PDO) and Arctic sea ice extent (yellow and green in Figure 2), concluding:
"the available observations are sufficient to virtually exclude internal variability and self-acceleration as an explanation for the observed long-term trend, clustering, and magnitude of recent sea-ice minima. Instead, the recent retreat is well described by the superposition of an externally forced linear trend and internal variability. For the externally forced trend, we find a physically plausible strong correlation only with increasing atmospheric CO2 concentration. Our results hence show that the observed evolution of Arctic sea-ice extent is consistent with the claim that virtually certainly the impact of an anthropogenic climate change is observable in Arctic sea ice already today."
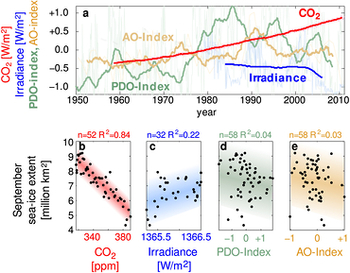
Figure 2: Correlation between September sea ice extent and CO2 forcing (red), solar forcing (blue), PDO index (green), and AO index (yellow). Figure 4 from Notz and Marotzke (2012).
Recent discussion about ocean cycles have focused on how internal variability can slow down global warming. The 2007 and 2012 Arctic melts are a sobering example of the impact when internal variability enhances the long term global warming trend. Overall, the scientific literature is quite clear that natural variability alone cannot account for the long-term Arctic sea ice decline, which is mainly due to human-caused global warming.
This rebuttal was updated by Judith Matz on September 13, 2021 to replace broken links. The updates are a result of our call for help published in May 2021.
 |
The Skeptical Science website by Skeptical Science is licensed under a Creative Commons Attribution 3.0 Unported License. |