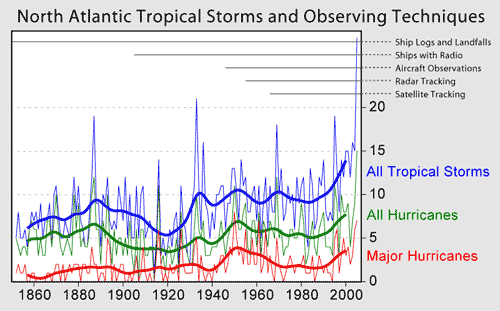
Figure 1: History of the tropical storms, hurricanes, and major hurricanes (Category 3+) in the North Atlantic derived from the analysis of the National Hurricane Center (Rohde/Global Warming Art).
What The Science Says:
It is unclear whether global warming is increasing hurricane frequency but there is increasing evidence that warming increases hurricane intensity.
Climate Myth: Hurricanes aren't linked to global warming
“According to the National Hurricane Center, storms are no more intense or frequent worldwide than they have been since 1850. […] Constant 24-7 media coverage of every significant storm worldwide just makes it seem that way.” (Paul Bedard)
There are two aspects to hurricane activity that are often confused so it helps to consider them separately. Specifically, does global warming cause more frequent hurricanes and does it cause more intense hurricanes?
In July 2007, a survey of hurricanes in the North Atlantic over the past century noted an increase in the number of observed hurricanes, concluding "increasing cyclone numbers has lead to a distinct trend in the number of major hurricanes and one that is clearly associated with greenhouse warming" (Holland & Webster 2007). However, this was refuted by an analysis of monitoring systems stating "improved monitoring in recent years is responsible for most, if not all, of the observed trend in increasing frequency of tropical cyclones" (Landsea 2007). In other words, the reason more hurricanes are being observed may be due to an improved ability to observe them, thanks to aircraft, radar and satellites.

Figure 1: History of the tropical storms, hurricanes, and major hurricanes (Category 3+) in the North Atlantic derived from the analysis of the National Hurricane Center (Rohde/Global Warming Art).
The question of hurricane frequency was also addressed in a study that used climate models to simulate hurricane response to warming in the North Atlantic. Increasing temperature leads to an increase in vertical wind shear which may inhibit the formation of hurricanes (Vecchi & Soden 2007). Thus, the impact of global warming on hurricane frequency is one area requiring further research and more data.
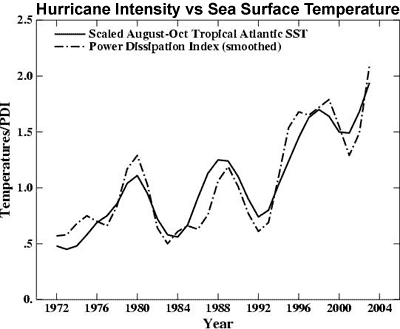
To determine whether warmer temperatures affect hurricane intensity, one study began by defining the potential destructiveness of a hurricane based on the dissipation of power, integrated over the lifetime of a hurricane (Emanuel 2005). The Power Dissipation Index is found to increase since the mid-1970s, due to both longer and more intense storms. Hurricane intensity is also highly correlated with sea surface temperature. This suggests that future warming will lead to an increase in the destructive potential of tropical hurricanes.

Figure 2: Smoothed Power Dissipation Index (dotted line, a measure of hurricane intensity) versus Tropical Atlantic Sea Surface Temperature (solid black line) (Emanuel 2005).
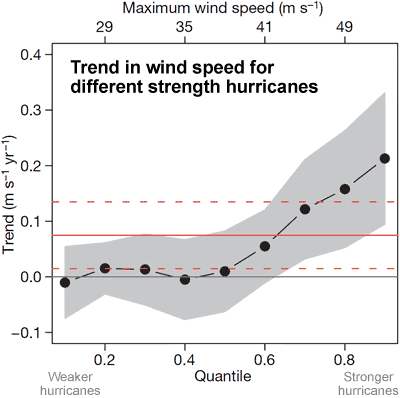
Global satellite data since 1981 can be used to extend analysis of hurricane intensity to each ocean, looking for any trend in wind speed (Elsner et al. 2008). Figure 3 plots the long term trend in maximum wind speed (eg - whether hurricanes are getting stronger or weaker) against different strength hurricanes. This tells us not only whether hurricanes are overall getting stronger but also how different strength hurricanes are being affected. Overall, there is a statistically significant upward trend (the horizontal red line). But more significantly, Elsner found weaker hurricanes showed little to no trend while stronger hurricanes showed a greater upward trend. In other words, stronger hurricanes are getting stronger. This means that as sea temperatures continue to rise, the number of Category 4 and 5 hurricanes hitting land will inevitably increase. More on Elsner's paper...

Figure 3: Trends in tropical cyclone maximum wind speeds for different strength hurricanes. Uncertainty range is shown in grey. Solid red line is the overall trend, dashed red lines show 90% confidence range (Elsner 2008).
Intermediate rebuttal written by John Cook
Update July 2015:
Here is a related lecture-video from Denial101x - Making Sense of Climate Science Denial
This rebuttal was updated by Judith Matz in September 2021 to replace broken links. The updates are a result of our call for help published in May 2021.
 |
The Skeptical Science website by Skeptical Science is licensed under a Creative Commons Attribution 3.0 Unported License. |