Figure 1: Heat content smoothed with 1-2-1 filter and overlaid with linear trend portion of best-fit model (slope = -0.35 x 10²² J/yr)
What The Science Says:
Early estimates of ocean heat from the Argo showed a cooling bias due to pressure sensor issues. Recent estimates of ocean heat that take this bias into account show continued warming of the upper ocean. This is confirmed by independent estimates of ocean heat as well as more comprehensive measurements of ocean heat down to 2000 metres deep.
Climate Myth: Oceans are cooling
“Ocean heat touches on the very core of the AGW hypothesis: When all is said and done, if the climate system is not accumulating heat, the hypothesis is invalid.
The paper Cooling of the global ocean since 2003 (Loehles 2009) looks at ocean heat content as measured by Argo. Argo is a network of over 3000 floats scattered across the globe that measure temperature and salinity of the upper ocean. Loehles finds a cooling trend from 2003 to 2008.

Figure 1: Heat content smoothed with 1-2-1 filter and overlaid with linear trend portion of best-fit model (slope = -0.35 x 10²² J/yr)
As oceans contain around 80% of the climate's total energy, ocean heat is a good measure of what's happening with our climate. So recent ocean cooling has led some to conclude that global warming has stopped. Probably the most articulate article is The Global Warming Hypothesis and Ocean Heat by William DiPuccio. His logic is as follows:
Let's examine points 1 and 2 in more detail.
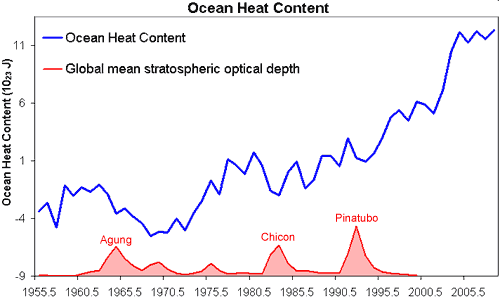
If the climate is steadily accumulating heat, does this mean the ocean heat content will also show a monotonic steady trend? To answer this, we need to view observations of ocean heat content over the past 40 years.

Figure 2: global ocean heat from 1955 to 2008. Blue line is yearly ocean heat content for the 0–700 m layer (Levitus 2009). Red line is the global mean stratospheric optical depth, indicating the timing of major volcanic eruptions (NASA GISS, data ends in 1999).
The longer record reveals short term variability amidst the long term warming trend. Volcanic eruptions (indicated in red by the stratospheric optical depth) impose a short term cooling influence of several years. But there is also variability due to cyclic effects such as El Nino. It's not unusual for the warming trend to slow or even show cooling over several years. More on what causes short term ocean cooling...
Ocean heat is directly measured by buoys that sink through the ocean, measuring water temperature at different depths. The most comprehensive system is the Argo network which was gradually deployed from 2003 through to 2007, with 3388 floats now spread throughout the globe.
There have been early difficulties in measuring ocean heat. Expendable bathythermographs, or XBT's, measured ocean temperatures before the Argo network was deployed. XBT's have been found to introduce a warming bias so when the warmer XBT data was combined with the later Argo data, the most recent trend showed exagerated cooling (more on that here). In addition, some Argo floats have had pressure sensor issues which impose a further cooling bias.
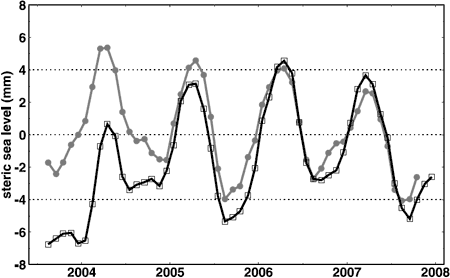
Loehles 2009 uses a reconstruction of Argo data by Josh Willis (Willis 2008). Another analysis of the same raw Argo data was performed by Leuliette 2009 - a comparison of Willis 2008 and Leuliette 2009 can be found in Figure 3:

Figure 3: Monthly variations in global mean steric sea level computed by Willis 2008 (gray line) and Leuliette 2009 (black line).
Willis 2008 shows a cooling trend since 2004, while Leuliette shows a warming trend. The primary difference between the two is found early in the Argo record, when there were fewer Argo buoys deployed. Leuliette 2009 suggests the discrepancy between the two seems to be due to poor sampling and differences in how the data was handled. But which dataset is more accurate?
When confronted with two papers offering different results, a useful referree is an independently determined dataset. As well as using Argo data, Cazenave 2009 creates two independent estimates of ocean heat. Sea level rise is comprised of two components: mass change due to melting ice and steric sea level rise due to changes in ocean density. Thermal expansion is the main driver of steric changes (salinity is also a minor factor) so steric sea level rise is another measure of total ocean heat.
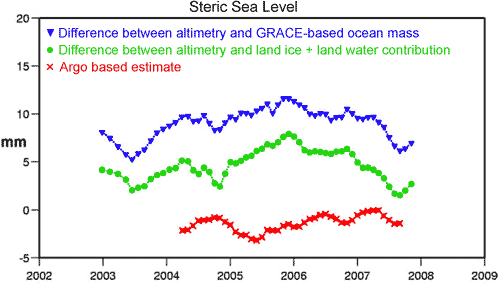
The first reconstruction uses satellite gravity measurements to calculate the change in ocean mass. They then subtract ocean mass sea level rise from total sea level rise to calculate the steric sea level rise. The second reconstruction uses satellite gravity measurements to calculate the change in mass of land ice and land water. The sea level rise from this contribution is subtracted from the total sea level rise to obtain another estimate of steric sea level rise. Both reconstructions show a statistically significant warming trend.
Argo offer two data streams - real time where the data is available almost instantaneously and delayed which undergoes more rigorous checks. Cazenave uses only measurements with the highest quality control settings (an approach the folk at Surfacestations would surely approve of). The Argo trend closely matches the other two reconstructions.

Figure 4: Three reconstructions of steric sea level, with seasonal element removed. Blue curve estimated from the difference between altimetry and GRACE-based ocean mass. Green curve estimated from the difference between satellite altimetry and total land ice plus land waters contribution. Red curve: ARGO-based estimate (Cazenave 2009).
In climate discussions, the most common error is focusing on a single piece of the puzzle while ignoring the big picture. The ocean cooling meme commits this error twofold. Firstly, it scrutinises 6 years worth of data while ignoring the last 40 years of ocean warming. Secondly, it hangs its hat on one particular reconstruction that shows cooling, while other results and independent analyses indicate slight warming.
The bottom line is there is still uncertainty over the reconstruction of ocean heat. Generally, the various reconstructions show the same long term trends but don't always agree over short periods. The uncertainty means one cannot conclude with confidence that the ocean is cooling. Independent analysis seem to indicate that over last half dozen years, the ocean has shown less warming than the long term trend but nevertheless, a statistically significant warming trend.
 |
The Skeptical Science website by Skeptical Science is licensed under a Creative Commons Attribution 3.0 Unported License. |