
Continued from: Sea Level Isn't Level: This Elastic Earth
When deglaciation ended around 4-5 thousand years ago there was less water in the oceans than today. Now this may at first seem hard to fathom but, for a broad swathe of ocean centered on the equator, sea level height back then was several meters higher than now. The evidence for this sea level highstand is obvious throughout the equatorial oceans in the form of "3 metre beaches" - chemically-dated wave marker notches, sediment, and coral remnants stranded well above current sea level (see Pirazzoli & Montaggioni [1986], Woodroffe & Horton [2004]). Indeed, coral atolls were formed by this sea level highstand - coral growing up to the then higher sea level and later becoming exposed as sea level fell.
Figure 1 - Example of a "3 metre beach" from the Hawaiian Islands. The former beach is marked in the centre of the photo. Image from Grossman & Fletcher 1998.
The 'bathtub model' of the global oceans is a setting in which the oceans basins are a fixed, and unchanging, shape - as a bathtub is. With this flawed conceptual model, which is so prevalent in the blogosphere, this sea level highstand earlier in the Holocene is inexplicable. To resolve this apparent conundrum we have to turn to the deglaciation models. What we find is that these sea level highstands are predicted by these models, and are a natural consequence of glacial isostatic adjustment - the Earth's surface wanting to return to equilibrium after the exchange of water mass between the continents and ocean. The fall in global sea level occured once glacial meltwater from the gigantic land-based ice sheets stopped and seawater was siphoned away to fill collapsing seafloor regions.
Slowly evolving changes in its orbit around the sun broke the Earth free from the last ice age. Small increases in the amount of sunlight reaching the Earth set in motion warming which began to decay the giant land-based ice sheets and caused global sea level to rise. By around 4-5000 years ago the vulnerable ice sheets had disappeared, and with the orbitally-forced warming having long-passed its peak, and now headed in the direction of slow long-term cooling (as it still is today), no further significant water mass, from the remaining ice sheets, was added to the oceans.
If not for the fact that Earth's surface is (visco)elastic and deformable, global sea level would have remained unchanged throughout these last 5000 years; at least up until the recent post-industrial (i.e human-caused global) warming. However, the Earth's surface is deformable under loading and, because of the collapse of the seafloor, the ocean basins began to slump deeper with time and global sea level began to fall - exposing the "three metre beaches."
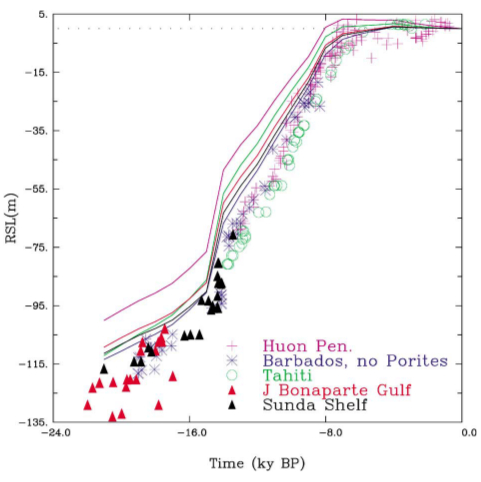
Figure 2 - Paleo sea level markers (coral and sediments) from various parts of the world matched to deglaciation modeled sea level trends at each location; Huon Peninsula (Papua New Guinea), Barbados (Caribbean), Tahiti (South Pacific), Joseph Bonaparte Gulf (Northern Australia) and Sunda Shelf (Indonesia/Malaysia). The Barbados relative sea level (RSL) trend is a good approximation of the globally-averaged sea level volume (see Peltier [2002]).
There are two aspects to ocean siphoning (Mitrovica & Peltier [1991]), the process which is responsible for the declining sea level shown at the locations in figure 2. The first of these is the collapse of glacial forebulges. This is where the accumulation of ice mass on the giant Laurentide, Fennoscandian, Greenland and Antarctic ice sheets, at the height of the last ice age, caused the Earth's surface beneath them to flex downward and consequently levered up the areas at the periphery of these ice sheets. So not only was the land surface above sea level uplifted, but so too was the seafloor in the proximity of one of these giant ice sheets.
Later, as the Earth warmed and the giant ice sheets decayed, these up-levered areas of seafloor began to collapse - moving back toward to their pre-ice age state. The long adjustment time of this collapse, as the viscous material deep down in the Earth's mantle slowly began to flow back toward the now unloaded former glaciated regions, meant it carried on even after meltwater was no longer being added to the oceans. In other words, the global ocean basins were, in effect, getting deeper and deeper as time moved on even though the global volume of seawater was static. It was this ocean basin deepening that lowered global sea level - as seawater was siphoned away to fill the collapsing seafloor areas.
This zone of collapse can be seen as the blue ocean-only regions in Figure 3. "Relative" sea level, i.e the sea level trend one would observe in this blue zone, would appear to be rising because the land is sinking along with the seafloor. The yellow-coloured areas of ocean observe a "relative" sea level fall as water migrates away to fill the collapsing blue zones toward the poles.
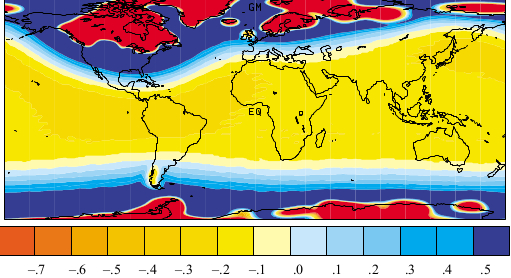
Figure 3 - The effect of glacial forebulge collapse on present-day global sea level trends. Trend (in mm per year) shows "relative" sea level. The blue oceanic regions near the poles are where the seafloor is collapsing and therefore deepening the ocean basins. Water therefore migrates into these areas and global sea level falls. This image is figure 1(b) from Mitrovica & Milne (2002).
The other aspect of ocean siphoning is due to the collapse of the seafloor close to the continents, by the addition of meltwater. As water mass was added to the global oceans, all the ocean basins were subjected to loading, but is is only near the continents that this extra loading caused the ocean floor to flex downward. The situation near the continents is somewhat different to the behaviour in the central ocean basins because the adjacent ocean floor is subjected to extra loading, whereas the continents are not (being above sea level).
This unequal loading forces the downward flexure of the Earth's surface under the ocean, and uplift of the continents. In response, the more fluid-like material down in the Earth's mantle is displaced sideways by the downward flexure of the ocean basin, and therefore is forced to flow under the continents - where there is no extra loading (Clark [1978]). This does not happen in the centre of the ocean basins, with extra glacial meltwater loading, because there is nowhere for the viscous mantle material to be laterally displaced to. Once again, the adjustment for this process is long and continued on well after the ice sheets had ceased supplying meltwater to the oceans.
In fact, so substantial are the combined effects glacial forebulge collapse and continental levering that even today satellite altimetry measurements have be be revised upward at a globally-averaged 0.3mm per year - to account for the subsidence (deepening) of the ocean basins (Douglas & Peltier [2002]), as this subsidence is obscured by current sea level rise.
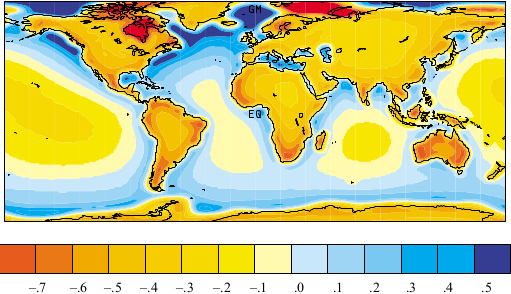
Figure 4 - the effects of continental levering on present-day global sea level rise. Trend (in mm per year) shows "relative" sea level. Image 1(c) from Mitrovica & Milne 2002.
This second ocean siphoning mechanism has been calculated to have been around the same scale as the collapsing glacial forebulges (Mitrovica & Milne [2002]). So each siphoning mechanism contributed to a sea level fall to such an extent that they formed the "three metre beaches", which are endemic to equatorial oceans. As you will note in Figure 5 both these ocean-siphoning mechanisms reinforce each other as one progresses toward the polar regions. Also apparent is that the bright red and dark blue oceanic areas in Figures 3-5 are off the colour chart scale. These trends are so extreme because of forebulge collapse and post glacial uplift in these zones.
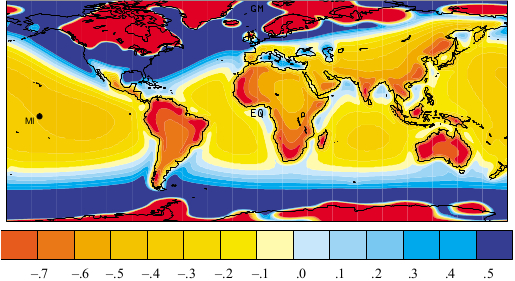
Figure 5 - the combined effects of both ocean siphoning mechanisms on present-day global sea level rise. Trend (in mm per year) shows "relative" sea level. This image depicts the current, and ongoing, deepening of the ocean basins occurring today. Image 1(a) from Mitrovica & Milne (2002).
Over the last several decades there has been a fair amount of scientific debate over various aspects of the sea level rise since the last ice age - such as the exact timing of the glacial maximum, how much ice was locked up in the gargantuan land-based ice sheets, and the exact timing of the sea level highstand, but the cessation of land ice melt in the late Holocene is a robust feature of the deglaciation models. An ongoing sea level rise throughout this period, as argued in Fleming (1998), would yield a serious mismatch with sea level proxy records, even if sea level were rising at only 0.25mm per year in the last 4000 years. And a trend as large as 0.5mm per year (six times smaller than current sea level rise) would eliminate the "three metre beaches" entirely.
This can been seen in Figure 6 where, in a) & b), green-coloured ocean areas show a very small drop in "relative" sea level, whereas, in c) & d), the yellow-and orange-coloured oceanic areas show a relative sea level rise - both scenarios which the paleo sea level markers suggest did not happen.
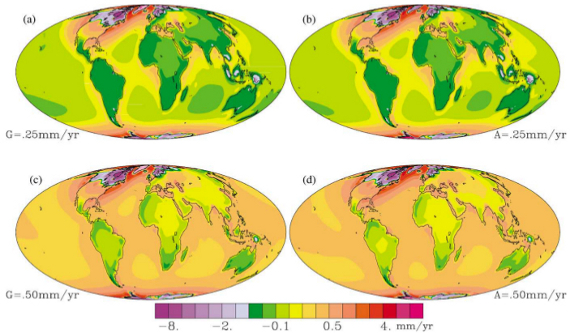
Fig 6 - Deglaciation modelling of "relative" sea level rise which includes a "theoretical" addition of meltwater to the oceans over the last 4000 years. (a) & (c) assume the glacial meltwater is from Greenland, and (b) & (d) from Antarctica. The rates of theoretical sea level rise are 0.25mm per year (a) & (b), and 0.50mm per year (c) & (d). 0.25mm seriously mismatches observations, but 0.5mm per year completely eliminates the sea level highstand (yellow and orange-coloured oceanic regions) and is therefore at odds with the physical evidence. Image from Peltier 2002.
As well as the deglaciation modeling, paleo sea level research also precludes any appreciable land ice melt over this 5000-year interval - as sea level markers indicate that relative sea level continued to fall during this time. See (Chen & Liu [1996], Angulo [2006] Kennedy [2008], Lewis [2008]). There are also other lines of scientific evidence that won't be delved into here, but we can be reasonably confident that the current sea level rise of 3.11 mm per year is anomalous within the context of the last (roughly) 7-8000 years and, by implication, the current globally-coherent (Bjorck [2011]) melting of land and sea ice is also something not seen on Earth for around 7-8000 years too. This conclusion is gradually being strengthened as more paleo sea level records are resolved, as they too indicate that the volume of the global oceans has remained static over the last 4-5000 years (Woodroffe [2012]).
Further research will no doubt refine the picture and resolve some outstanding conflicts, but the general sea level trend since the last ice age is unlikely to be altered much.
Next: Gravity & Sea Level Fingerprinting
Posted by Rob Painting on Saturday, 29 September, 2012
 |
The Skeptical Science website by Skeptical Science is licensed under a Creative Commons Attribution 3.0 Unported License. |