
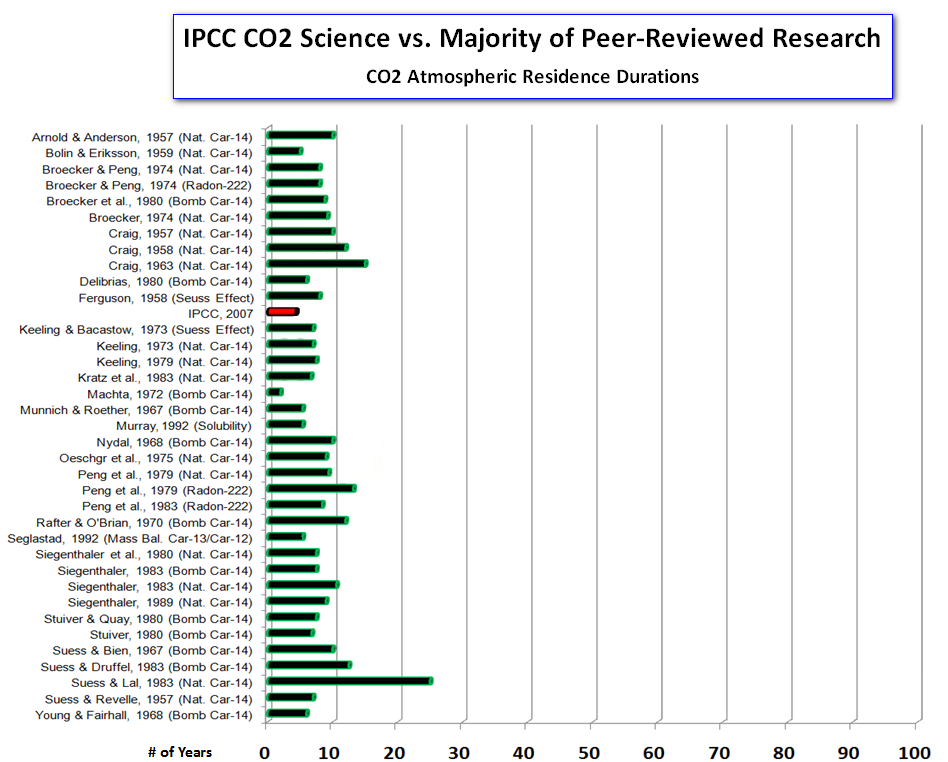
There are a number of diagrams that frequently crop up in discussions of climate change in the blogsphere that are easily demonstrated to be, at best misleading, if not actually fundamentally wrong. A classic example is shown below, which suggests that the IPCC's estimate of residence time is at odds with those from a wide range of scientific studies.
In this case, the diagram was taken from an article at Watts Up With That, entitled "Apparently, 4 degrees spells climate doom"; Google's "search by image" shows it has also appeared on a range of other blogs.
The IPCC actually gives a residence time of about 4 years in the 2007 AR4 WG1 report (see page 948), which is completely in accordance with the other papers referenced in the diagram. The confusion arises because there are two definitions of "lifetime" that describe different aspects of the carbon cycle. These definitions are clearly stated on page 8 of the first (1990) WG1 IPCC report (on page 8):
The turnover [residence] time of CO2 in the atmosphere, measured as the ratio of the content to the fluxes through it, is about 4 years. This means that on average it takes only a few years before a CO2 molecule in the atmosphere is taken up by plants or dissolved in the ocean. This short timescale must not be confused with the time it takes for the atmospheric CO2 level to adjust to a new equilibrium if sources or sinks change. This adjustment time, corresponding to the lifetime in table 1.1 is of the order 50-200 years, determined mainly by the low exchange of of carbon between surface waters and deep the ocean, The adjustment time is important for the discussion on global warming potential, c.f. Section 2.2.7". [emphasis mine]
So clearly what has happened is that the author of the diagram has done exactly what the IPCC have warned against, which is to confuse residence (turnover) and adjustment time. As the IPCC WG1 report makes a point of clarifying this issue, the confusion would have been avoided if time was taken to actually read what was written in the IPCC report.
The distinction between residence time and adjustment time is well illustrated by a simple analogy:
Consider a bathtub that is half full of water, where the plug has been taken out, but the hot tap set such that the rate of water entering the bath through the tap exactly matches the rate at which water leaves via the phug-hole. The residence time is the average length of time a molecule of water remains in the bath before leaving via the plug-hole, this is given by the ratio of the volume of the bath and the rate at which water is flowing out of the bath. For example, if the bath holds 280 litres and water dissapears down the plughole at a rate of 70 litres per mintue, then the mean residence time is four minutes. If we now pour a litre of red dye into the bath, the level of water in the bath will rise slightly, and the dye will soon disperse throughout the bath. The red colour of the bath water will rapidly fade, at a rate governed by the residence time.
The adjustment time, on the other hand, describes the rate at which the water level re-establishes itself in response to a change in the sources or sinks, or equivalently to the addition of a pulse of liquid (e,g. the red dye). As we have added a litre of dye to the bath, there will be a slight increase in pressure that will cause water to flow out of the plughole a little faster. As a result, the water level in the bath will start falling until it reaches the previous equilibrium level, where the rate at which water exits through the drain is exactly matched by the rate at which water is flowing in through the tap. The rate at which the water level drops will get slower and slower as it reaches the equilibrium level as the excess pressue also drops. The timescale over which the water level drops to its equilibrium value is governed by the adjustment time, which is largely independent of the residence time.
The diagram shown below (Figure 7.3 from the IPCC AR4 WG1 report) shows global carbon cycle for the 1990s, showing the main annual fluxes in GtC yr–1: pre-industrial ‘natural’ fluxes in black and ‘anthropogenic’ fluxes in red. The residence time of CO2 is very short because there are vast exchange fluxes that move large quantities of CO2 from one reservour to another. However, the pre-industrial exchange fluxes were approximately balanced and so had little effect on atmospheric CO2 levels. While the residence time depends on the total magnitude of the fluxes of CO2 out of the atmosphere, the rate at which atmospheric levels rise or falls depends on the difference betwen total emissions into the atmosphere and total uptake of CO2 from the atmosphere, hence the adjustment time is essentially independent of the residence time.
 The
The
If we plot the estimates again, this time using the correct IPCC estimate for the residence time of CO2 in the atmosphere of ``about four years'', we get this:
The correct version of the diagram shows that the IPCCs estimate of residence time is completely in accordance with those given in a range of peer-reviewed studies on this topic.
IPCC reports found to be consistent with mainstream scientific opinion- news at 11!
Now it could be argued that the use of different terminolgy, i.e. turnover rather than residence time, excuses the confusion, however the terms are clearly defined both in the IPCC report and in the papers mentioned in the diagram. For instance, on page 5, Craig (1957) gives tau (the residence time) as the ratio of two quantities, N and phi, where N is the number of molecules in a reservoir and phi is the flux into and out of the reservoir in molecules per year. Here Craig is clearly referring to the turnover time of the IPCC, rather than the adjustment time, which the IPCC report states to be about 4 years.
Interestingly, two of the primary authors of chapter 1 of the FAR WG1 report are Prof. Hans Oeschger and Prof Ulrich Siegenthaler, two names that crop up repeatedly as authors of the peer reviewed research mentioned in the diagram. Could it be that the IPCC report is wrong and gives an estimate of residence time that is clearly at odds with the peer reviewed research (including the work of some of the the authors of the IPCC report itself), or is it more likely that the author of the diagram simply didn't understand the distinction between residence time and adjustment time, and didn't bother to read the IPCC report to resolve the apparent disparity? I would venture to suggest the latter!
The short residence time of carbon dioxide in the atmosphere has frequently been used to suggest that the rise in atmospheric CO2 cannot be of anthropogenic origin. This argument has appeared repeatedly on climate blogs, and even occasionally in the peer-reviewed litterature. One such paper, written by Prof. Robert Essenhigh, led me to write a rebuttal that explained the distinction between residence time and adjustment time, and demonstrated that the observations of the carbon cycle are completely consistent with the observed rise in atmospheric CO2 being anthropogenic:
This topic has also been covered in a number of articles at SkepticalScience:
The fact that the rise in atmospheric CO2 is anthropogenic has also been covered eslewhere, including at skeptic blogs, for example:
Unfortunately, the discussion continues, even though the basic facts have been set out in considerable detail.
The bottom line is that whoever created this diagram either did not understand the distinction between residence time and adjustment time and/or didn't bother to adequately check what was actually written in the IPCC WG1 AR4 report. The same is essentially true for the blogs that have since used this diagram to suggest that the IPCC estimate of residence time is incorrect. So if this diagram is used in a discussion of climate change, considerable skepticism is warranted.
Posted by Dikran Marsupial on Wednesday, 19 February, 2014
 |
The Skeptical Science website by Skeptical Science is licensed under a Creative Commons Attribution 3.0 Unported License. |