
This is the first post on the exceptionally wet and stormy UK winter of 2013-14. So many severe weather events occurred that they almost seemed continuous a lot of the time. So, to begin with, a timeline is necessary in order for readers elsewhere around the world to appreciate its sheer relentlessness. In a follow-up post, we will take a look at the outbreak of politics that accompanied it, and the scientific debate regarding causes and the possible influence of climate change. But first, a little light entertainment in the form of the run-up to the season in the popular press.
Why is it that when the tabloid media outlets make a prediction, what pans out in reality tends to be the exact opposite? In October 2013, the Daily Express (a UK Conservative-leaning tabloid newspaper) had a front page headline, "Record Snow forecast for November". On November 17th, following a series of pleasantly autumnal days, it followed with, "100 DAYS OF HEAVY SNOW: Britain now facing worst winter in SIXTY YEARS warn forecasters".
It's perhaps useful at this point to explain that the Express has a kind of rota of front page themes that include massively rising house prices, miracle cures for various things, wacky theories about Princess Diana and, well, apocalyptic weather forecasts. Unfortunately, non-meteorologists sometimes take the latter at face value. Having been asked whether the headline was true by a number of elderly people who were anxious about skyrocketing fuel-bills, I got our local paper, the Cambrian News, to publish my advice which was basically, "take no notice", in so many words.
In the piece, I explained that long-range forecasting of weather (as opposed to climate), especially in a part of the world where changeability is the outstanding feature, is simply not possible to any degree of accuracy. The Express has a clever trick up its sleeve: it says that "forecasters warn", bases the gist of its stories on the ramblings of various private weather-forecasters (as opposed to mainstream professional meteorologists) and throws in a few carefully-juxtaposed quotes from the UK Met Office. No wonder readers end up wondering who said what, and many times since I have heard the Met Office blamed for these "forecasts" when in fact it had nothing to do with them. This despite their regularly-issued rebuttals, such as this one: it's an unfortunate fact of life, as Winston Churchill once observed, that a lie will go halfway round the world before the truth has got its pants on.
So with an icy armageddon confidently predicted, chances were, as already said, that the exact opposite would be on the cards: what nobody realised at the time was to what extent. Now that we're past the 100-day point beyond that dramatic Express headline, and past the end of the meteorological winter (December, January and February), let's take a look at the timeline of the exceptional events as they unfolded.
The action began in dramatic style on December 5th-6th, as low pressure and storm-force winds brought the highest storm-surge down the North Sea since the deadly one of late January 1953, when over 300 people were killed and over ten thousand houses inundated. The surge reached the Norfolk coast on the evening of the 5th and worked its way further southwards overnight. Mass-evacuations had already taken place at communities regarded as prone and thankfully nobody was killed this time: however there was severe flooding locally, involving some 1400 homes, and damage in the form of coastal erosion was spectacular in places with a number of houses damaged or lost as cliffs collapsed. Major improvements to sea-defences, made following the 1953 disaster, together with greatly improved communications and warnings infrastructure, served however to strongly mitigate its effects.

above: the storm surge at Lowestoft, on the Suffolk coast of East Anglia, December 5-6, 2013. Red is astronomical tidal predictions: blue is observed height. High water was some two metres higher than the astronomical value. From a Met Office summary of the December-January storms.
That set the scene for the remainder of the winter: storm after storm after storm ran across the Atlantic to maul the UK to varying degrees of severity. The simple meteorology of the situation involved a recurrent feature of the jet stream: a northward 'buckle' or, more technically, a quasi-stationary upper ridge, situated over the eastern Pacific/western seaboard of North America. This enabled deep-layer cold air to flood southwards out of the Arctic, down the eastern flank of the ridge into the central USA, bringing the prolonged and severe wintry conditions that have been widely reported from the North American continent. At the same time, warm subtropical air was able to move NE around the semipermanent large anticyclone that sits over the Tropical mid-Atlantic, the Azores-Bermuda High, putting warm air on a collision course with cold.
The meeting of these two starkly contrasting airmasses set the scene for explosive cyclogenesis, which occurred repeatedly in the Western Atlantic just off the North American coast, sending one storm after another off eastwards. Overhead, there raced a very strong Polar Jetstream, which at times was situated unusually south of its normal position: in winter, it tends to take a track somewhere between northwest Scotland and Iceland. In this case, it drove vigorous, often sub-950 millibar low pressure systems across Ireland, Scotland and Northern England, time and again.

Above: characterisation of the jet stream (red) in winter 2013-14, showing how deep-layer cold air moving south across North America met warm subtropical air moving north off the eastern seaboard. Storms repeatedly developed where the two airmasses met. Graphic: John Mason
On December 14th, a severe windstorm affected parts of Scotland, with reports of flooding, damage, power outages and gusts in excess of 100mph over higher ground. More widespread severe weather occurred on December 18th with gusts of more than 85mph reported from the south coast of England: fallen trees and other debris blocked many roads.
On the 21st and the 23rd, gusts of 80mph and more were recorded in parts of Wales, but that was just the run-up to the events of the 24th. The area of low pressure that had arrived overnight continued to deepen and as its centre tracked close to Scotland, Stornoway Airport in the Outer Hebrides recorded a mean sea-level (MSL) pressure of 936.4 mb - the lowest value for a UK land station since 1886. As well as widespread severe gales gusting to over 80mph, rain was a major problem, with widespread 50mm-plus day totals across southern and south-western England and localised falls of over 70mm. Flooding affected many homes across southern England and one of the terminals of Gatwick Airport had to close when floodwaters shorted out its power supply. Widespread rail disruption added to the chaos with thousands of people stranded in their attempted pre-Christmas travel: thousands more spent the festive period without electricity.
December 27th brought another significant, sub-950 mb storm to our shores with a gust of 109 mph recorded at Aberdaron in NW Wales, while the 30th-31st saw new travel disruption due to flooding (Eskdalemuir in southern Scotland had over 70mm of rain on the 30th) and more high winds with gusts exceeding 80mph and widespread problems with power outages and roads blocked by fallen trees.

above: the first of three summary graphics by JG - the events of December 2013.
Heavy rain brought the new year in for Southern England and South Wales in particular, with several people having to be rescued from floodwaters on the 1st. During the period January 3rd-6th, a pair of enormous storm-systems, each eventually spanning the entire North Atlantic, brought severe gales to the UK but more importantly the transatlantic windfield drove massive swells towards its coasts. I witnessed the swell at high tide at Aberystwyth on the 6th: it was the biggest I have ever seen in over thirty years living near to the Welsh coast. Great combers were breaking as they came into view over the horizon, rolling towards the shore, building in height and slamming into the Promenade. The damage at Aberystwyth from the storms of this period was the worst since 1938. Large areas of the Promenade were ripped up and the road buried under feet of debris and shingle in places. Capping-stones from the edge of the Prom, some weighing over a hundred kilos, were tossed like hay-bales. Seafront hotels and homes alike had their ground-floor windows and doors stoved-in by the waves. Elsewhere, there was major structural damage to the railway that runs along the Cardigan Bay coast: repairs are still ongoing at the time of writing.

Above: high tide at Aberystwyth - January 6th 2013. Below: just one view of the aftermath. Photos: John Mason.

In the south-west of England, some well-known natural landmarks were lost to the high seas. On the Isle of Portland, in Dorset, where the Environment Agency's flood-sirens had to be sounded for the first time in the 30 years they have been in existence (apart from test-soundings), a ten-metre high rock stack, known as Pom Pom rock and weighing hundreds of tons, was completely destroyed. Further to the west, at Porthcothan Bay in Cornwall, a stone arch known as The Anchor was reduced to rubble. It had stood for centuries but could not withstand the immense force of the nine-metre high waves that slammed into the Cornish coast one after another.
Much of the rest of January was unsettled with depressions crossing or passing near to the UK with their attendant frontal rainbands and post-frontal showery airmasses. Even though the lows were less intense, the cumulative rainfall was starting to make itself be felt in earnest. Groundwater levels, worryingly low a couple of years previously, were now reaching or surpassing record values, so that the run-off from any rain was total. As the month went on the number of areas flooded steadily grew: on the 24th, the flooding on the Somerset Levels was declared a 'major incident'.

above: the second of three summary graphics by JG - the events of January 2014.
February arrived with a renewal of the stormy weather, with Aberdaron recording a gust of 84mph on the 1st. The afternoon and evening of the 4th and overnight into the 5th saw widespread 80mph-plus gusts in SW England with St Mary's in the Isles of Scilly recording one gust of 92mph. Severe damage to the West Coast Mainline on the 4th left SW England cut off by rail after a section of the sea-wall at Dawlish, on the South Devon coast, was destroyed by the huge, swell-driven waves, leaving the railway-tracks hanging in mid-air. Coastal flooding was widespread in SW England. A repeat performance occurred on the 7th and 8th, when the MSL pressure at Tiree in the Inner Hebrides falling to 948mb and more 80mph-plus gusts in SW and S England and SW Wales.
By the 10th of February, many residential areas along the Thames catchment to the west of London were being badly affected by flooding: on the day in question the Environment Agency had 14 Severe Flood Warnings in effect for the Thames and related rivers, plus the usual ones covering the Somerset Levels. For non-UK readers, this is the highest level of flood warning over here, and means that there is a danger to life (as opposed to property). For just a taste of conditions in the catchment, this BBC report includes both footage and images.
Only the days with wind-gusts close to or exceeding 80mph have been noted in this post, otherwise it would be too long! However, examination of forecast model output at the start of the second week in February had the UK weather community very worried indeed with respect to the developing windstorm that was expected to arrive on the 12th. The morning of that day dawned bright and with just a bit of a breeze, but out there in the eastern Atlantic a monster of a system was bearing down on us. By mid-morning, the Met Office had issued a rare Red Warning for the coming winds, covering Wales and NW England. Here's the Shipping Forecast for my adjacent sea area, the Irish Sea. I saved a screengrab of it because such a forecast is very rare indeed so far south:

And here's what happened:

This was the most savage windstorm to strike Wales for many years and when the winds struck in the afternoon, conditions soon became too unsafe to venture outside for several hours. That evening, once the winds abated, I walked up Maengwyn Street in my hometown of Machynlleth, In places, the pavement was littered with fallen slates, and this is at a sheltered market-town in a broad lowland valley. Many of the roads connecting Machynlleth with neighbouring towns were blocked by multiple fallen trees and this plus severe structural damage to properties and prolonged power-outages affected towns across Wales and parts of England. In several remote locations across Mid-Wales, I found areas of near-total devastation of forestry plantations: these stand out because the general damage-pattern is of scattered fallen trees and the data collected during the mapping of these devastated areas is being used in post-storm analysis.
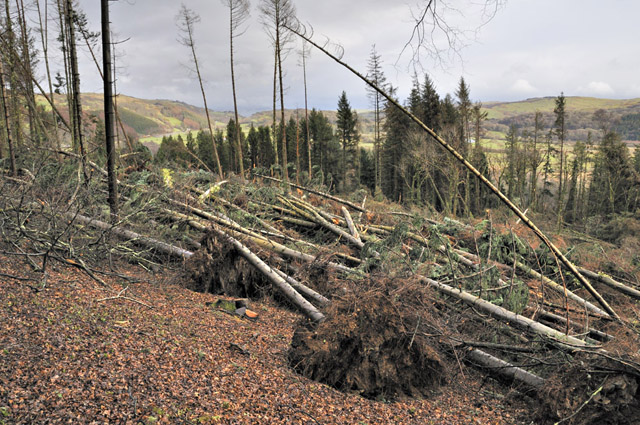
above: a swathe, 100m wide and 500m long, of almost complete destruction involving hundreds of trees, near Pennal in the Dyfi Valley, Mid-Wales. Eyewitness accounts indicate that this happened over an hour or two on the afternoon of February 12th 2014: the damage-swathe is visually similar to that of an F2 tornado, but that would have completed the job in minutes! Below: another smaller zone of February 12th severe wind-damage in the same valley: interestingly this location is low down on a lee-slope. Photos: John Mason.

Ireland also took a mauling during the February 12th storm and an interesting new record was set: Kinsale Energy Gas Platform, situated just off the southern coast in the Celtic Sea, recorded a maximum wave height of 25 metres. Apart from being a record at that location, it was also the highest maximum wave height recorded in Irish inshore waters (the previous record being 23.4 metres at the M4 buoy off the Northwest coast, and set just back in January).
Two days later, on the 14th, another storm with a more southerly track wrought havoc across the southern half of England and Wales. Known now as the 'Valentine's Day Storm', it brought with it more fallen trees and coastal flooding: one particular incident made the news widely, in which 32 diners attempting to enjoy a romantic meal at a sea-front restaurant at Milford-on-Sea in Hampshire had to be rescued by the Army and Emergency Services. Shingle, flung up by huge waves and high winds, started taking out the windows on both floors of the building, and left the rescue vehicles similarly damaged. The exposed weather-station at The Needles, on the Isle of Wight, recorded a gust of 109mph; other high gusts included 94mph at Polruan, in Cornwall, and 91mph, at Hurst Castle, in Hampshire.
The stormy conditions eased up again following the events of the 14th, but with so much water everywhere, flooding continued to cause major problems. Additional major river-catchments became increasingly overloaded with water. Interestingly, the Dyfi, my local river, has not flooded at all this winter, although it has been high at times. But there is an explanation for that. These storm-systems have raced through quickly and the Dyfi has a short catchment - it is only some 37km from its mountain source to its mouth, with a catchment area of less than 500km2, so its hydrological response to rainfalls is relatively rapid. Fast-moving systems do not generally drop enough of a volume of rainwater to cause problems.
In stark contrast to the Dyfi, vastly more extensive catchments such as the Severn (ca. 11,000km2), have had to handle water running off a much greater surface area. Once the ground was saturated so widely as it was this winter, the cumulative effect of so many weeks of wet weather began to make itself felt in no uncertain terms.
On the 16th, I travelled to the Midlands, and with a choice of several routes that were still open, I opted to go via Worcester, where the town's bypass crosses the Severn, here about 20m wide in normal flow, via a high bridge. This was the scene, looking back across the bridge: water, water everywhere!

It should be noted that this flooding had been present for many days prior to my visit. Further south again, I arrived at the old hamlet of Severn Stoke, where I stopped at the same point as I had on 28th December 2012 to photograph the same scene of floodwaters, stretching into the distance, that I had shot just over a year previously.

above: December 28th 2012; below: February 16th 2014, shot at the same vantage-point near Severn Stoke, downstream from Worcester. The river Severn's channel is some six hundred metres away in the distance. Photos: John Mason

A few miles further down-river, I stopped and chatted with troops, manning a barricade across the road that normally leads into Upton-on-Severn. Army all-terrain vehicles with high clearance were busy ferrying in supplies to the eastern side of the flood-stricken town.
Another hydrological problem that saturated ground eventually leads to is illustrated by this BBC video, showing the problems in the village of Hambledon, Hampshire, where the saturated Chalk aquifer has essentially led to the water-table reaching the surface. This is known as 'groundwater-flooding'. The roads in Hambledon had by this point been under water for 47 days.
On February 20th, the Met Office announced that, in the national dataset going back to 1910, winter 2013-14 was the wettest on record. In a breakdown of the data, the following key points emerged:
* The UK has now received 486.8mm of rain, narrowly above the previous record of 485.1mm set in 1995.
* Wales has seen 691.8mm of rain, beating the previous record of 684.1mm in 1995.
* East Scotland has seen 514.5mm of rain, beating the previous record of 482.2mm in 1915.
* Southwest England and south Wales has seen 632.5mm of rain beating the previous record of 610.7mm in 1990.
* Southeast and central southern England has seen 492mm beating the previous record of 437.1mm set in 1915.
The following Met Office dataplot shows the percentage of rainfall received from December 1st to February 19th, as a percentage of the 1981-2010 UK DJF average:

The plot shows the unusually high rainfall over southern England and Wales - coincident with many of the areas worst-affected by the flooding. By contrast, and unusually for the time of year, northern Scotland mostly had average rainfall.
The 23rd saw the high winds return to affect western areas: Capel Curig recorded a gust of 93mph during the morning, although this was an isolated report, perhaps due to funnelling of the wind between the hills - the station in question is in the heart of Snowdonia. Rather welcome, generally quieter conditions then settled in through to the 27th, when a small low pressure centre tracked through the English Channel, prompting shipping gale warnings for storm force 10 winds in southern sea-areas: on the morning of the 28th, gusts to 74mph were recorded at St Marys and just over the Channel, 83mph gusts were recorded on the Brittany coast.
On the 27th, the Met Office announced that 2013-14 had been been the wettest winter in the much longer-running England and Wales Precipitation (EWP) series going back to 1766, with 435 mm of rain having been recorded up to 24th February: by the end of the month, a few more day's worth of data (and rain) showed that with 450.8mm, winter 2013-14 was now the third wettest season on record in the EWP (1st = autumn 2000, 502.7mm; 2nd = autumn 1852, 455.8mm). The Met Office also announced in the same article that the UK average mean temperature for the winter so far was 5.2°C, making it the 5th warmest winter since the national series records began in 1910. The record was set in 1989, which averaged 5.8°C.
| Mean Temperature (°C) | Sunshine (hours) | Rainfall (millimetres) | ||||
| Actual | Difference from 1981-2010 average | Actual | % of 1981-2010 average | Actual | % of 1981-2010 average | |
| UK | 5.2 | +1.5 | 153 | 97 | 517.6 | 157 |
| England | 5.8 | +1.6 | 189 | 107 | 382.7 | 167 |
| Wales | 5.7 | +1.5 | 138 | 86 | 720.7 | 166 |
| Scotland | 4.1 | +1.4 | 100 | 78 | 697 | 148 |
| N Ireland | 5.0 | +0.7 | 129 | 87 | 460.8 | 146 |
above: provisional statistics for winter 2013-14 (up to 25th February). Data from UK Met Office.

above: the third of three summary graphics by JG - the events of February 2014.
And so, some 108 days after the Daily Express' 100 Days of Heavy Snow apocalypse forecast, the extraordinary UK winter of 2013-14 finally came to an end. But, to rejoin the theme at the beginning of this post, just look at this: the Express headline of 21st February 2014:

They even include two of those totally incorrect icy apocalypse headlines in the accompanying illustration! As examples of twisted reality go, this one is up with the best of them. It is difficult to resist the temptation to conclude that they must believe that their own readers are incredibly stupid, something which would take their cynicism down to a level we frequently run into in the murkier depths and the darker corners of the climate change denial sector of the blogosphere.
What did the Met Office actually say in their contingency-planning long-range forecast? The following:
“Confidence in the forecast for precipitation across the UK over the next three months is relatively low. For the December-January-February period as a whole there is a slight signal for below-average precipitation. The probability that UK precipitation for December-January-February will fall into the driest of our five categories is around 25 per cent and the probability that it will fall into the wettest category is around 15 per cent.”
Relatively low confidence. A slight signal. They weren't exactly shouting about it from the rooftops, then, were they? A low probability of it being very wet or very dry: a betting man might have gone for one (odds = 6.66666-1) or the other (odds = 3-1), and cashed in or lost his shirt appropriately. In other words, taking the probability of a dry winter as an example, the forecast would verify if one out of four imaginary winters was dry, with the other three being wet to various degrees. That is the nature of such uncertainty spelled out in plain English. But what if he had he put his money on, let's just remind ourselves, this?
"100 DAYS OF HEAVY SNOW: Britain now facing worst winter in SIXTY YEARS warn forecasters".
What odds were offered in this case? None. No expression of that dreaded 'uncertainty monster' in there, is there? But that is the essence of tabloid thinking: any expressed uncertainty in mainstream science is construed as meaning it is all rubbish, whereas any bold yet unqualified statement (without the slightest reference to uncertainty levels) on the fringes is proclaimed as absolute certainty in the headlines. And, surprise surprise, reality proved to be an almost exact opposite.
Never mind. The nonsense will all start again next October, and before that, we may hopefully have a summer worthy of the name. Looking ahead, UK-based readers do not need reminding that March and even April can bring wintry conditions: last year, late March saw one of the worst blizzards in many years. However, as to whether we see a repeat performance of that this year, or an even-more unseasonable March heatwave as we had in 2012, only time will tell.
Acknowledgement: thanks to Anne-Marie Blackburn for valuable assistance in collating the events, especially across SW England.
Posted by John Mason on Friday, 7 March, 2014
 |
The Skeptical Science website by Skeptical Science is licensed under a Creative Commons Attribution 3.0 Unported License. |