This is a guest post by Gavin Foster, Dana Royer and Dan Lunt.
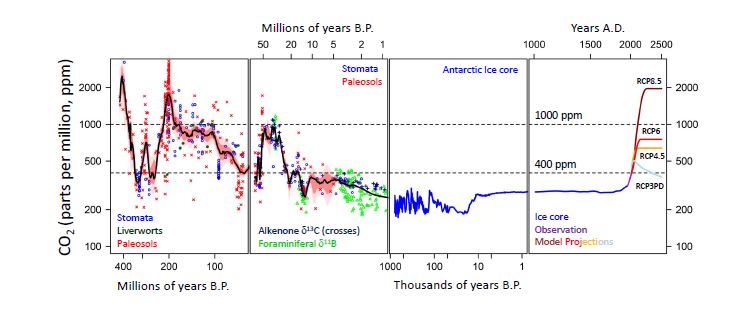
Figure 1: Compilation of available CO2 data for the last 450 million years. For data sources see text. Proxy records are colour coded and labelled in the relevant panel. Greenhouse gas emission scenarios (RCP – Representative Concentration Pathways) used in IPCC AR5 are shown in the right hand panel. Note the variable log scale for time. For the geological data a smoothed line has been fit to the data with an uncertainty accounting for uncertainty in age and CO2. The black line describes the most probable long-term CO2 with 68% confidence limits in red, and 95% confidence in pink.
Carbon dioxide (CO2) in the Earth’s atmosphere is a potent greenhouse gas, responsible for trapping longwave radiation and ensuring the habitability of our planet. Variations in its concentration are thought to be important for controlling the evolution of the Earth’s climate on geological timescales (hundreds of thousands to millions of years) and recent anthropogenic increases in atmospheric CO2 have played a major role in more recent global warming. Read more here.
Reconstructing atmospheric CO2 in the past is a tricky business. For the last 800 thousand years we have bubbles of ancient atmosphere trapped in ice that can be recovered from Antarctica. Prior to this time we have to rely on more indirect methods also known as proxies. Those available to us are discussed in detail in the latest IPCC report, and in particular in Table 5.A.2 in Chapter 5 “Information from Paleoclimate Archives” and more briefly here.
In Figure 1, we have plotted all the available pre-ice core CO2 reconstructions for the last 423 million years (a total of nearly 800 data points) and compared them to more recent records and projections for the future. The palaeo-CO2 data can be found here, the ice core data here & here, historical data here and the projections of CO2 for the future here.
For the ancient CO2 data there is an increased variability due to the existence of both real short term variability (e.g. orbitally driven change like the well-known glacial-interglacial cycles) and increased noise due to the uncertainty in CO2 reconstructed by these more indirect methods. To account for this and to better reveal the long-term trends in the CO2 data we have fitted a smoothed curve, which has an uncertainty due to the uncertainty on the age and CO2 of each data point. This smoothed curve can be found here (Phanerozoic-CO2). This treatment reveals a number of interesting features:
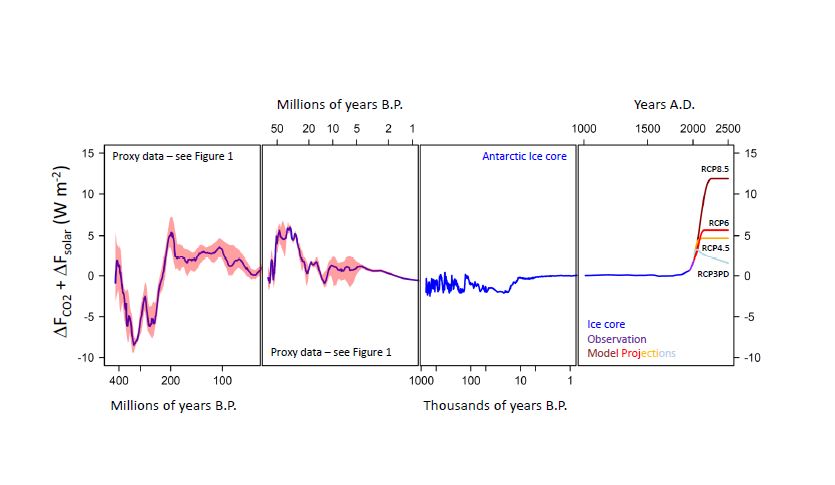
Figure 2: Climate forcing by changing CO2 and solar output for the last 450 million years. CO2 data and projections are as outlined in Figure 1. Changing solar output calculated as described in Gough et al. (1981; Solar Physics, 74, 21-34) with CO2 forcing from Byrne and Goldblatt (2014; doi: 10.1002/2013GL058456). The red band is the 95% confidence interval around the smoothed line through the published CO2 data.
However, the evolution of climate over this time period is not only being forced by changing CO2. As well as tectonics changing the position of the continents, and changes in vegetation and ice changing Earth’s albedo (its reflectiveness) through time (http://www.scotese.com/), models of stellar evolution predict that the output of our Sun has increased over its life time. On relatively short geological timescales (e.g. the last 5 million years or so) this effect is not significant. But over 400 million years the output of the sun has increased by around 4% (equivalent to ~12 W m-2 of climate forcing). We calculated the climate forcing by CO2 (in W m-2) and the Sun for the last 400 million years (using doi: 10.1002/2013GL058456; see Figure 2).
What is revealed is that despite a dramatic change in solar output, the combined climate forcing by CO2 and the Sun has remained relatively constant (Figure 2). This has been commented on before (here) and is likely due to the operation of a strong negative feedback process changing CO2 levels on geological timescales as a function of global temperature (silicate weathering – more here). However we see that with the latest treatment of the proxy data forcing has remained even more tightly constrained (within ± 5 W m-2) over the last 400 million years (Figure 2). Given this longer term view of climate forcing, the scenarios for future fossil fuel use stand out as being even more extreme, and the business as usual scenario (RCP8.5) would amount to a climate forcing by CO2 that is largely unprecedented in the geological record (as far as we can tell).
Members of the Descent into the Icehouse project are working to improve our estimates of CO2 during the EECO. It is important to note that winding the clock back to EECO CO2 levels in the coming century will not result in a simple return to the Eocene climate. Understanding what drove the evolution of the Eocene climate however will aid our wider understanding of the Earth’s climate system and how it behaves in warm climate states.
See here for more information on the Descent into the Icehouse Project
Posted by Guest Author on Thursday, 1 May, 2014
 |
The Skeptical Science website by Skeptical Science is licensed under a Creative Commons Attribution 3.0 Unported License. |