Last November we published a paper in Quarterly Journal of the Royal Meteorological Society on the subject of coverage bias in the Met Office HadCRUT4 temperature record. The paper was made available to all through the generous donations of Skeptical Science readers. We found that when the HadCRUT4 data are extended to cover the whole globe, some of the apparent slowdown in global warming over the past 16 years disappears. This video provides a brief recap of that work:
The original motivation for the project came from the fact that different versions of the temperature record were showing substantially different short term trends. We assumed that in addressing the coverage bias in HadCRUT4 we would bring it into agreement with the GISTEMP record from NASA. Having done that, the project would be finished.
But what we actually found was a surprise - our infilled record showed rather faster warming than GISTEMP.
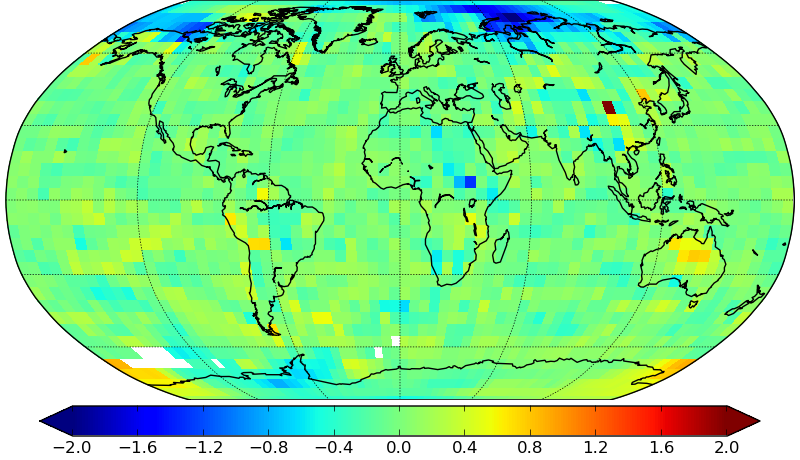
We first thought that the disagreement must be down to the sea surface temperature (SST) data, because the Met Office had recently corrected a bias in their ocean warming estimates of about the right size. However this guess turned out to be wrong. When we looked at a map of differences between the GISTEMP trends and ours (Figure 1) the main differences were not in the oceans at all: they were in the Arctic. And the differences in this one small region were big enough to explain about two thirds of the difference in trend between our results and GISTEMP.
Figure 1: Difference in temperature trends between GISTEMP and the Cowtan and Way infilled temperature data on the period 1997-2012 (i.e. GISTEMP minus C&W). Units are °C/decade.
Other data sources were investigated, including the new Berkeley land-ocean temperature data, the MERRA weather model reanalysis, and satellite radiometer datasets from AIRS and AVHRR. All of them showed faster warming in the Arctic than GISTEMP, particularly in the Barents and Kara seas off the Russian coast, and in the Beaufort sea off of the Canadian coast (Figure 2).
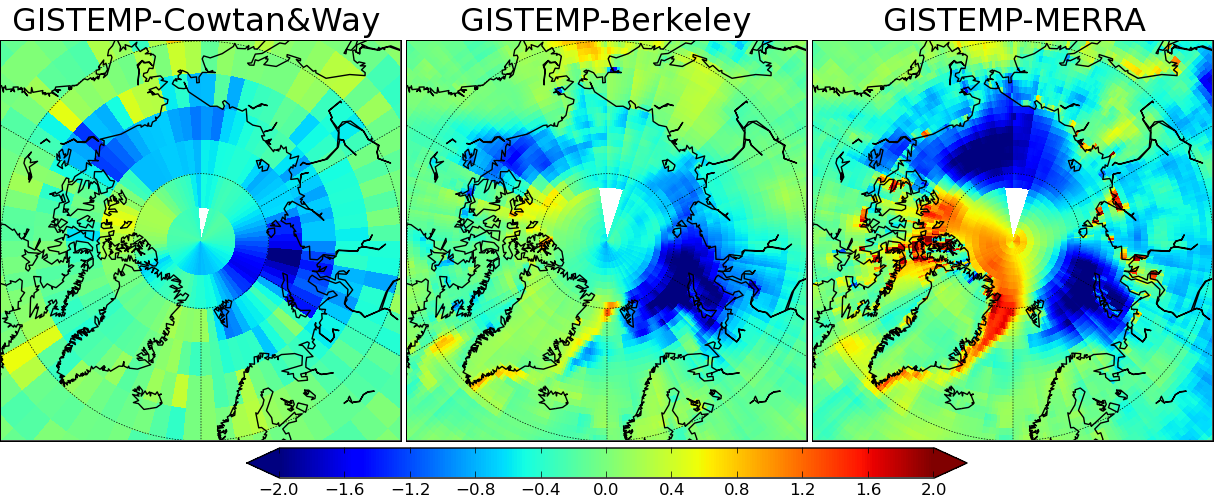
Figure 2: Difference in Arctic temperature trends between GISTEMP and 3 other reconstructions on the period 1997-2012. Units are °C/decade.
What was causing the differences? A number of possibilities were considered, such as differences in the infilling method and treatments of sea ice, without a clear answer emerging. Eventually we were forced to re-implement parts of the GISTEMP calculation for ourselves. This produced another surprise. The difference between our series and GISTEMP had a much simpler explanation: it came from the input weather station data.
The weather station data for NASA's GISTEMP come from the Global Historical Climate Network (GHCN-monthly version 3). The station data in our reconstruction comes from the Climatic Research Unit (CRU) data used in the Met Office record. If our version of the GISTEMP algorithm is applied to the GHCN station data, the resulting Arctic temperatures are a good match for GISTEMP. But if the CRU data are fed into the same calculation we see faster warming - and the pattern of warming is very similar to our own reconstruction.
How do the station records differ? If the station trends are plotted on a map (Figure 3), two things stand out. Firstly, the CRU data include a lot more stations - about 4 times as many observations as GHCN. Secondly, the Arctic island stations which are present in GHCN show much less warming that their more numerous counterparts in the CRU data.
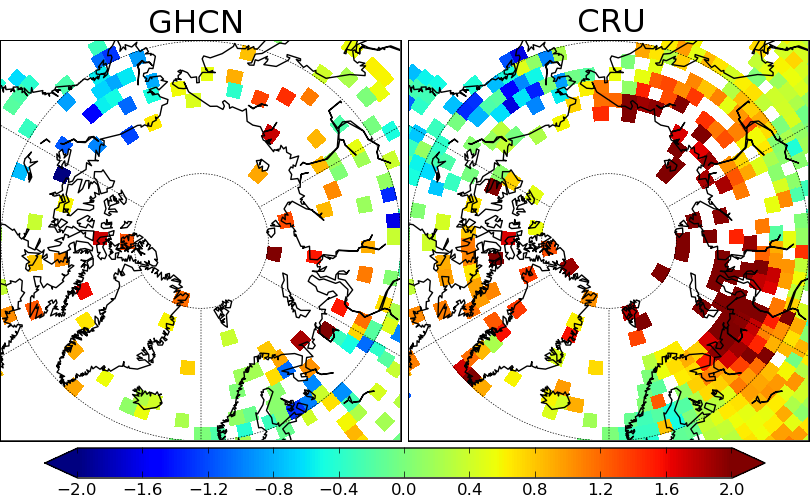
Figure 3: Station coverage and trends for the GHCN adjusted and CRU data on the period 1997-2012. Units are °C/decade.
The trends in the Arctic adjustments are shown in Figure 4, and show a basin-wide pattern of downward adjustments. (The map shows GHCN-adjusted minus GHCN-unadjusted temperatures, and thus cool colours represent downward adjustments.)
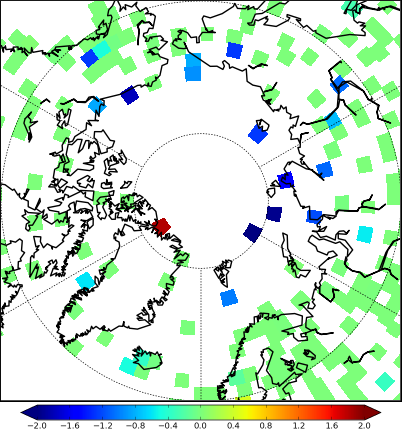
Figure 4: Difference in temperature trends between the GHCN adjusted and raw station data on the period 1997-2012. Units are °C/decade.
We are not the first to suggest that the GHCN corrections might be introducing errors into some station records - others have suggested that these corrections might contribute to the global warming signal in the temperature record [1],[2]. However when we use the GHCN data in a global temperature reconstruction, we find that the adjustments have been suppressing the warming signal over the past decade. The GHCN adjustment algorithm makes the conservative assumption that neighbouring stations should show similar trends. As a result it performs well when presented with discontinuities in individual station records in well sampled regions, however we might expect it to have problems when faced with the sparsely sampled and rapidly warming Arctic.
It looks likely that the rapid warming of the Arctic has broken the thermometer temperature record in two different ways - firstly by violating the assumption that unobserved regions of the planet warm at a broadly similar rate to observed regions, and secondly by violating the assumption that neighbouring regions of the planet's surface warm at a similar rate. While the errors are small in absolute terms and do not affect the big picture, they are enough to distort the noisy short term trends which have dominated the public discourse on climate change.
If this analysis is correct then all of the land-ocean records used in the IPCC AR5 report have been overstating the slowdown in warming over the past 16 years, although for different reasons. The existence of two distinct cool biases in different versions of the temperature record may of course have contributed to the fact that the problems went undetected. Of the professionally maintained datasets, only the new Berkeley Earth land-ocean record is unaffected.
We anticipate that there will be continuing developments from the main temperature record providers both to address the problem of coverage and to establish consistent and carefully validated records for the most important high latitude stations. The new International Surface Temperature Initiative will provide a basis for the next version of the GHCN data, and will feature many more Arctic stations. Weather model reanalyses, satellite data and manual reconstructions of critical stations may also prove important. Hopefully much of the disagreement between different versions of the temperature record can be resolved. If this is the case then one source of uncertainty in our understanding of recent temperature trends will have been addressed.
We would like to thank Matthew Menne and Claude Williams for helpful discussions during the investigation of this problem.
Further information
Our report on this issue is available here. Data and methods are available here.
Posted by Kevin C on Friday, 25 April, 2014
 |
The Skeptical Science website by Skeptical Science is licensed under a Creative Commons Attribution 3.0 Unported License. |