The surface thermometer record forms a key part of our knowledge of the climate system. However it is easy to overlook the complexities involved in creating an accurate global temperature record from historical thermometer readings. If the limitations of the thermometer record are not understood, we can easily draw the wrong conclusions. I reevaluated a well known climate sensitivity calculation and found some new sources of uncertainty, one of which surprised me.
This highlights two important issues. Firstly the thermometer record (while much simpler than the satellite record) requires significant expertise in its use - although further work from the record providers may help to some extent. Secondly, the policy discussion, which has been centered on the so called 'warming hiatus', has been largely dictated by the misinformation context, rather than by the science.
At the AGU fall meeting I gave a talk on some of our work on biases in the instrumental temperature record, with a case study on the implications from a policy context. The first part of the talk was a review of our previous work on biases in the HadCRUT4 and GISTEMP temperature records, which I won't repeat here. I briefly discussed the issues of model-data comparison in the context of the CMIP-5 simulations, and then looked at a simple case study on the application of our results.
The aim of doing a case study using our data was to ascertain whether our work had any implications beyond the problem of obtaining unbiased global temperature estimates. In fact repeating an existing climate sensitivity study revealed a number of surprising issues:
The results highlight the fact that significant expertise is currently required to draw valid conclusions from the thermometer record. This represents a challenge to both providers and users of temperature data.
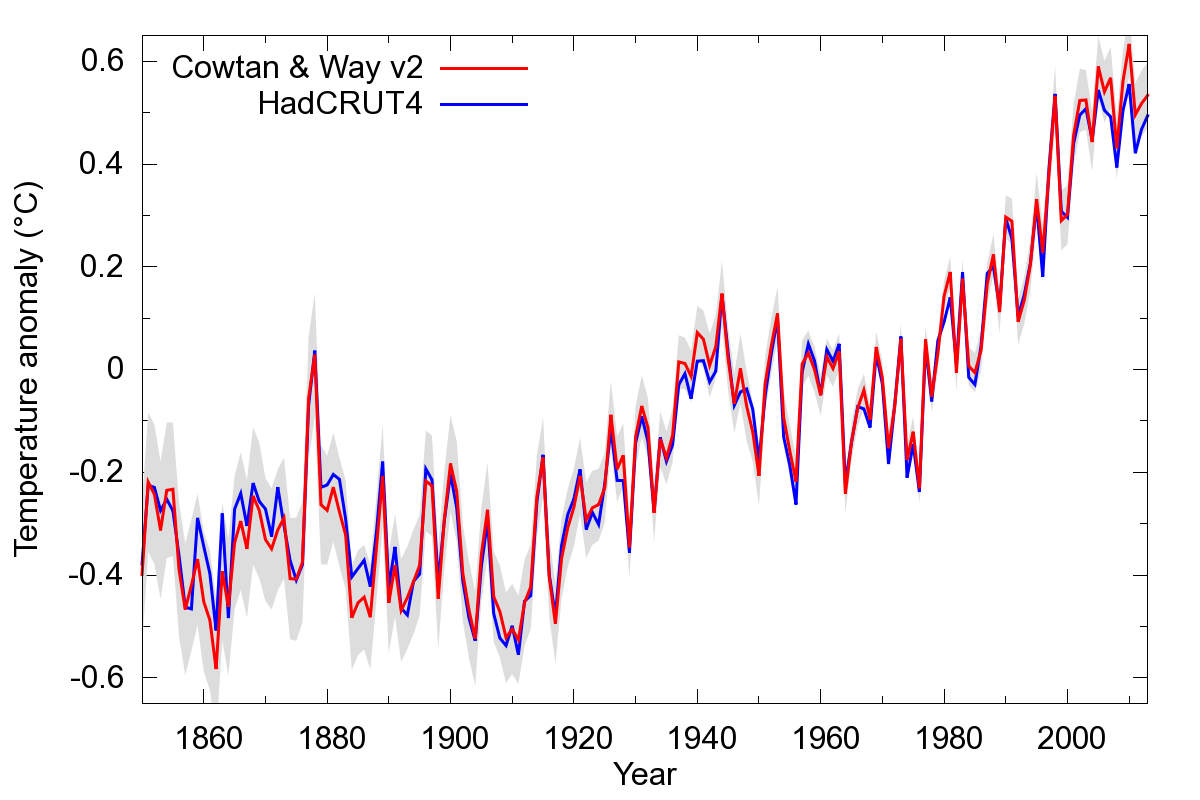
Let's start by looking at the current version of our temperature reconstruction, created by separate infilling of the Hadley/CRU land and ocean data. The notable differences are that our reconstruction is warmer in the 2000's (due to rapid arctic coverage), and around 1940, and cooler in the 19th century due to poor coverage in HadCRUT4 (figure 1).
Figure 1: Comparison of the Cowtan and Way version 2 long reconstruction against HadCRUT4, showing the uncertainty interval from CWv2.
What impact do these differences have on our understanding of climate? The most important factor in determining the rate of climate change over our lifetimes is climate sensitivity, and in particular the Transient Climate Response (TCR). TCR measures how much global temperatures will change over a few decades due to a change in forcing, for example due to a change in greenhouse gas concentrations. It is therefore important from a policy perspective. We can look at the effect of our work on TCR estimates.
One widely reported estimate of TCR comes from a 2013 paper on climate sensitivity by Otto et al., from which figure 2(a) below is derived. The origin represents a reference period in the 19th century (specifically 1860-1879), while the data points represent the change in temperature (y-axis), against the forcing or driver or climate change (x-axis) for the 1970s, 1980s, 1990s and 2000s.
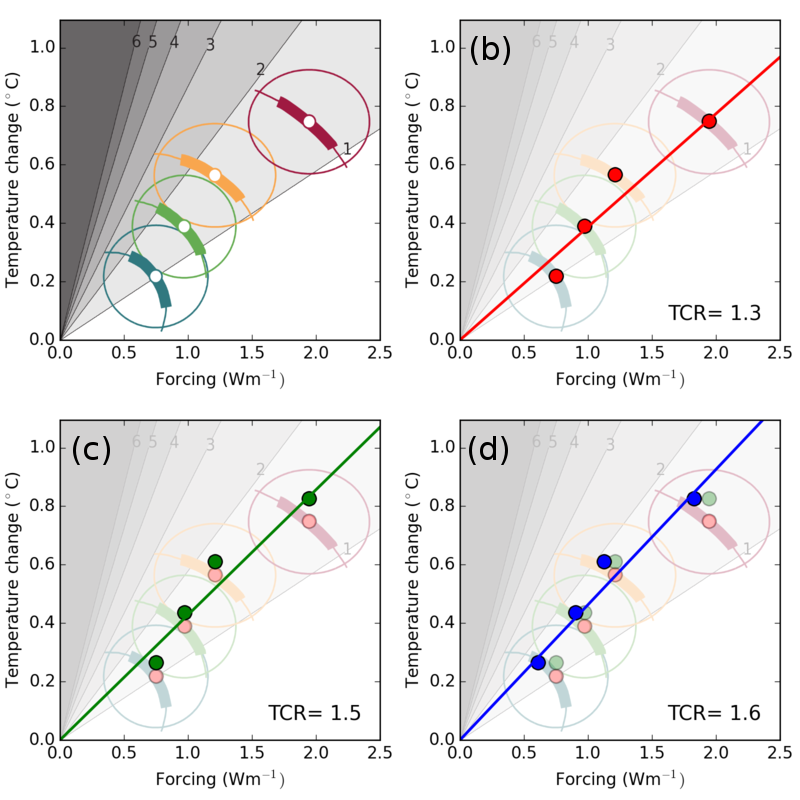
Figure 2: Estimates of Transient Climate Response (TCR) based on the method of Otto et al. (2013), reproducing the original calculation (b), with the introduction of the CWv2 temperature data (c) and with a thermal inertial term (d).
The slope of a line through these points gives an estimate how much temperature will change due to future changes in forcing. This is expressed in terms of the transient climate sensitivity (TCR), shown in figure 2(b). The Otto paper attracted some comment due to the TCR estimate being a little lower than is typically reported for climate models.
Note in particular the last datapoint, which lies almost on the line. The surface warming slowdown of the 2000s, commonly known as the 'hiatus', does not affect the estimate of climate sensitivity in the Otto et al. calculation.
How does our temperature reconstruction (Cowtan & Way 2014) affect this study? The answer is shown by the green points in figure 2(c). All the data points move upwards – this is actually due to the reference period in the 19th century being cooler in our data. The last data point moves further, reflecting the warmer temperatures in the 2000s. The transient climate sensitivity (TCR) increases accordingly.
One other feature of the Otto et al. calculation is that it ignores the thermal inertia of the system. In reality it takes a while for surface temperature to respond to a change in atmospheric composition: temperature change lags forcing. We can approximate this response by delaying the forcing a little (specifically by convolution with an exponential lag function with an e-folding time of 4 years, normalised to unit TCR). This gives the blue points in figure 2(d). The fit is a little better, and the TCR is now not far off from the models.
Does this solve the discrepancy between the models and the Otto et al. calculation? Unfortunately not. Shindell (2014) noted a more important issue – the impact of cooling particulate pollution (aerosols) on the radiative forcing in the Otto calculation is probably underestimated, due to the geographical distribution of the pollution. Underestimation of this cooling effect leads to an overestimation of the forcing and an underestimation of climate sensitivity. This is more important than the effects we identified: You can get pretty much any answer you like out of the Otto et al. calculation if you can justify a value for the aerosol forcing.
If we order the factors affecting climate sensitivity by their importance, the list probably looks like this:
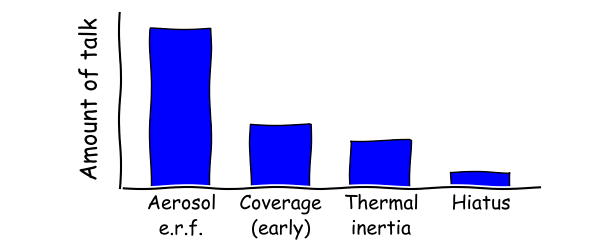
Put all of these together, and estimates of climate sensitivity from 20th century temperatures could exceed those from climate models. And given that transient sensitivity (TCR) is important for policy, we would expect political and public discourse to be dominated by those same factors:
Whereas in the real world, the public discourse looks more like this:
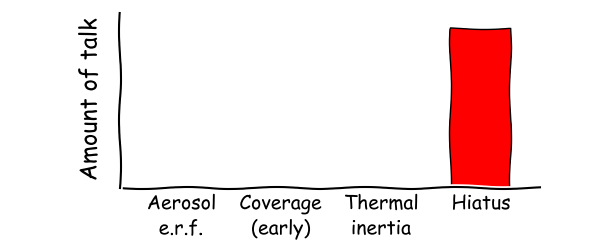
The public discourse does not reflect the science, rather it has been determined by the misinformation context. Some of this has crept back into the scientific discourse as well.
Unfortunately that is not the end of the problems. So far we've largely ignored the oceans, which are quite important. By chance I was looking at a new sea surface temperature dataset, ERSST version 4, to determine what effect it might have on future versions of GISTEMP. What happens if we swap out the Hadley sea surface temperature data, and swap in the new version of ERSST (version 4)?
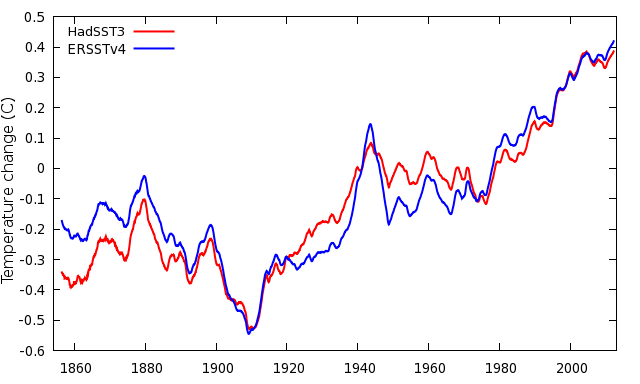
Figure 4: Comparison of HadSST3 and ERSSTv4 over map cells where both include values.
The two sea surface temperature series are shown in figure 4. When we use ERSSTv4 instead of HadSST3, two things happen:
Why are the ERSSTv4 sea surface temperatures higher in the 19th century? The differences arise from a correction applied to early sea surface temperature observations. Early readings were taken by lifting water to the deck of a ship in a bucket, and measuring its temperature. The water cools during the process, leading to a bias which varies according to a number of factors, including the height of the ship's deck. ERSSTv4 does not show the expected decline in bucket correction with the lower ship deck heights in the 19th century. The bucket correction is large, so this could be a big effect, and yet I have never seen a climate paper discussing the impact of 19th century ship design on estimates of climate sensitivity.
The Otto et al. calculation addressed uncertainty in the temperature data by using the ensemble of temperature reconstructions provided by the UK Met Office. The Met Office HadCRUT4 data provide the most sophisticated representation of uncertainties currently available, but only encompasses uncertainty within the Met Office data and does not include uncertainties across the different temperature providers. Unfortunately there is no convenient way for users of temperature data to do this at the moment, especially if it involves mixing and matching temperature data across providers. This represents a significant weakness in current temperature data provision.
Fortunately, addressing this problem does lie within the remit of the International Surface Temperature Initiative (ISTI), so hopefully the situation will improve in the long run. In the meantime, I'd suggest the following rule of thumb when thinking about the accuracy of the thermometer record:
The Otto et al. climate sensitivity calculation and others using 19th century temperatures as a baseline (for example Lewis and Curry 2014), are strongly dependent on the temperatures during the early and most problematic part of the record.
The instrumental temperature record is an important source of climate information, and when used with care can answer a great many questions. However the data are not without their problems, and their interpretation requires significant expertise in both the data and their limitations. Current provision does not make this as convenient for the user as it might be, however ongoing projects, and in particular the International Surface Temperature Initiative, will do much to address these issues.
The policy discussion however is oblivious to these questions, and revolves around issues like the slowdown in warming, which in practice has at most a minor impact on our climate sensitivity estimates and certainly less impact than uncertainty in the size of the aerosol cooling effect or the bucket corrections.
Posted by Kevin C on Thursday, 15 January, 2015
 |
The Skeptical Science website by Skeptical Science is licensed under a Creative Commons Attribution 3.0 Unported License. |