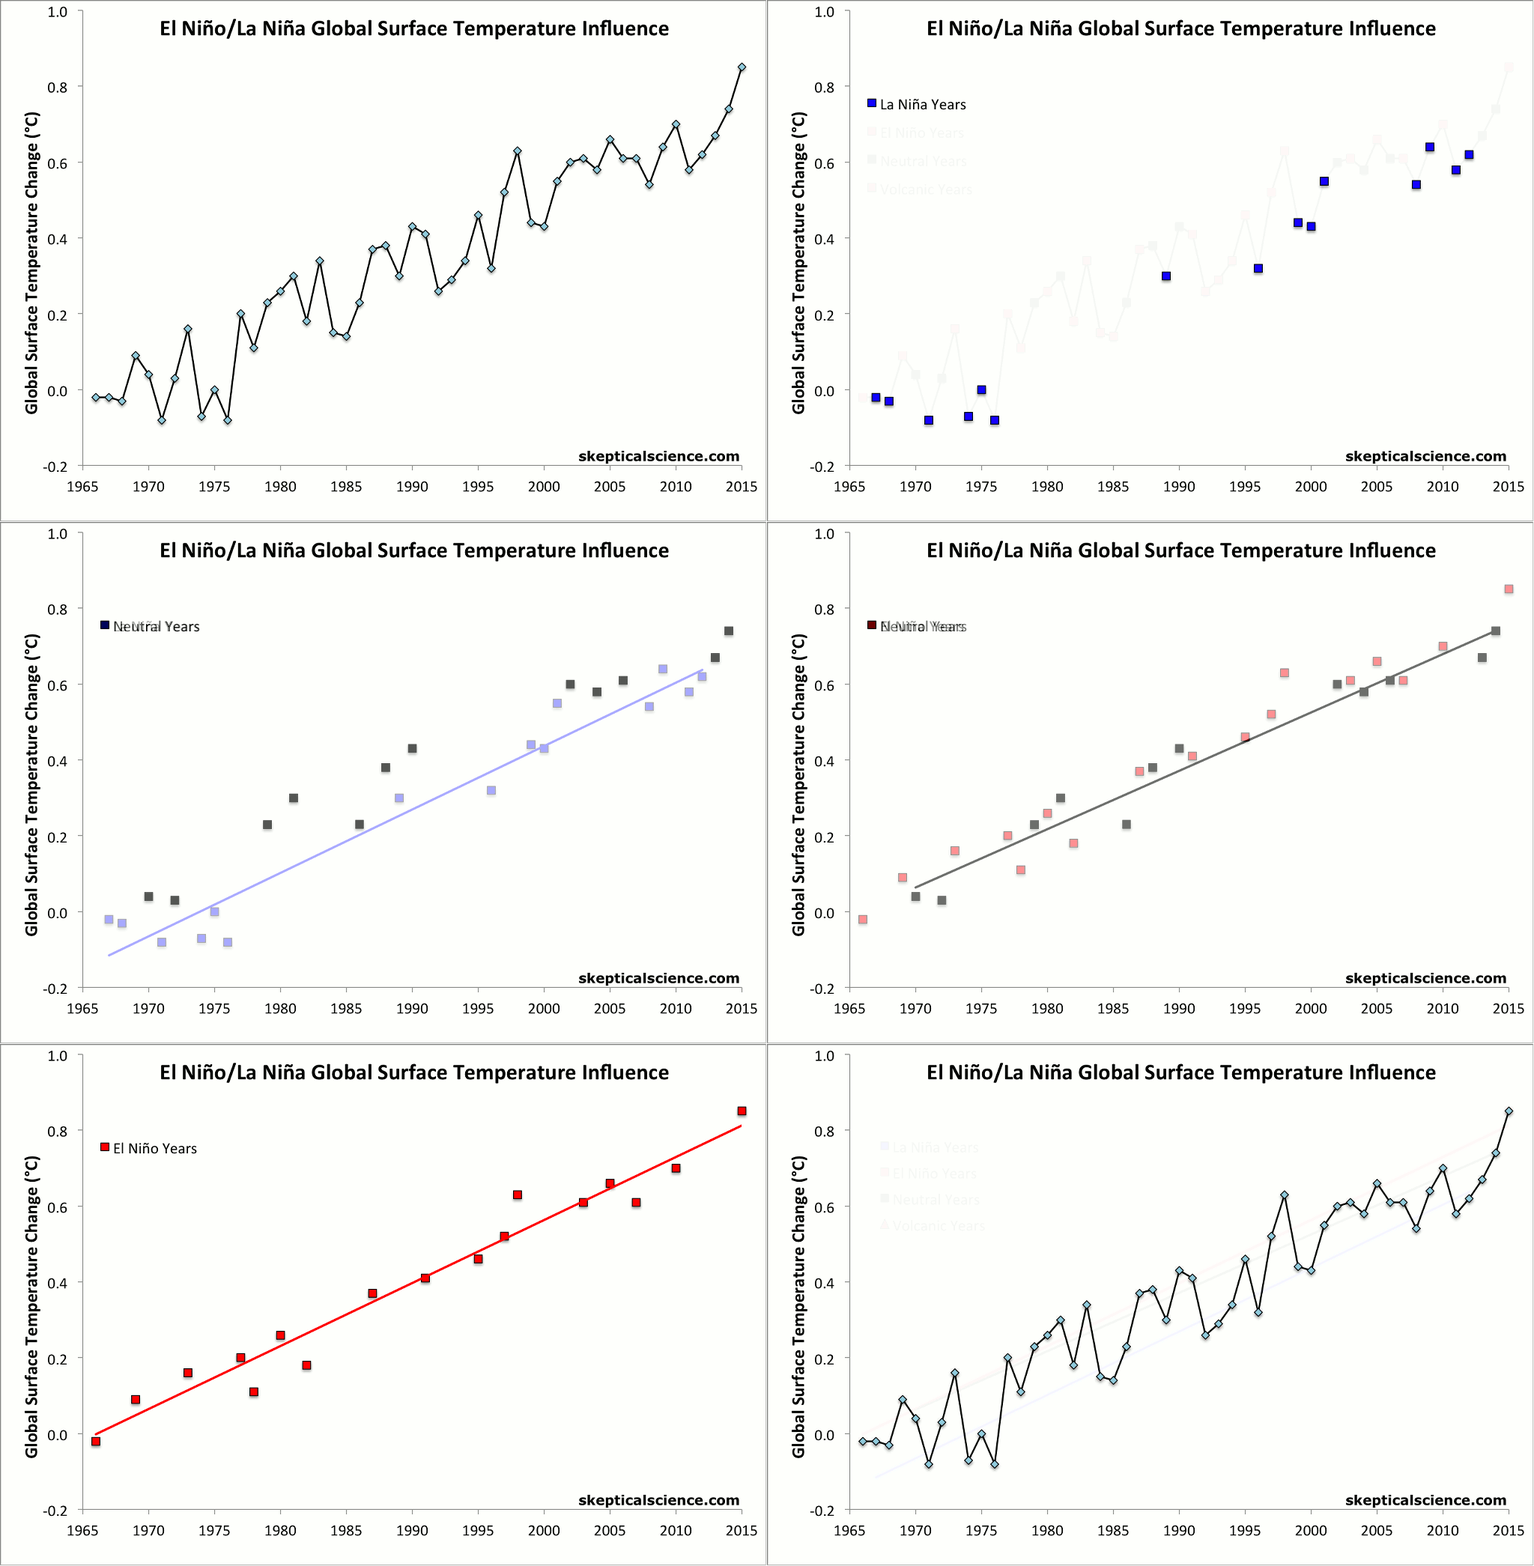
But what’s really remarkable is that 2014 set this record without the aid of an El Niño event. El Niño events create conditions in which sea surface and hence global surface temperatures are anomalously hot. We call this part of the Earth’s “internal variability” because these events just temporarily shift heat around between the ocean surface and its depths.
As this graphic shows (click here for an animated version), the last five record hot years of 2010, 2005, 1998, 1997, and 1995 were all assisted by El Niño events.

In contrast, 2014 had a slight cooling influence from La Niña-like conditions at the beginning of the year, a slight warming influence from El Niño-like conditions toward the end, and no net temperature influence from the El Niño Southern Oscillation (ENSO) for the year as a whole. 2014 was by far the hottest ENSO-neutral year on record, and the first year since 1990 to set a record without influence from El Niño.
1998, which saw the strongest El Niño on record, now falls to 5th-hottest year on record. The intense El Niño event made global surface temperatures in 1998 about 0.2°C hotter than they would have otherwise been. Due to human-caused global warming, ENSO-neutral years are now hotter than even the most intense El Niño years a decade or two ago. As NASA GISS director Gavin Schmidt said,
This is the latest in a series of warm years, in a series of warm decades. While the ranking of individual years can be affected by chaotic weather patterns, the long-term trends are attributable to drivers of climate change that right now are dominated by human emissions of greenhouse gases
As the above graphic shows, over the past 50 years, there has been the same 0.15–0.16°C per decade warming trend for La Niña years, for ENSO neutral years, and for El Niño years. So for example, an ENSO-neutral year today is about 0.25°C hotter than a similar year would have been in 1998. That’s why 2014 was hotter than 1998 despite the big difference in El Niño temperature influences between the two years.
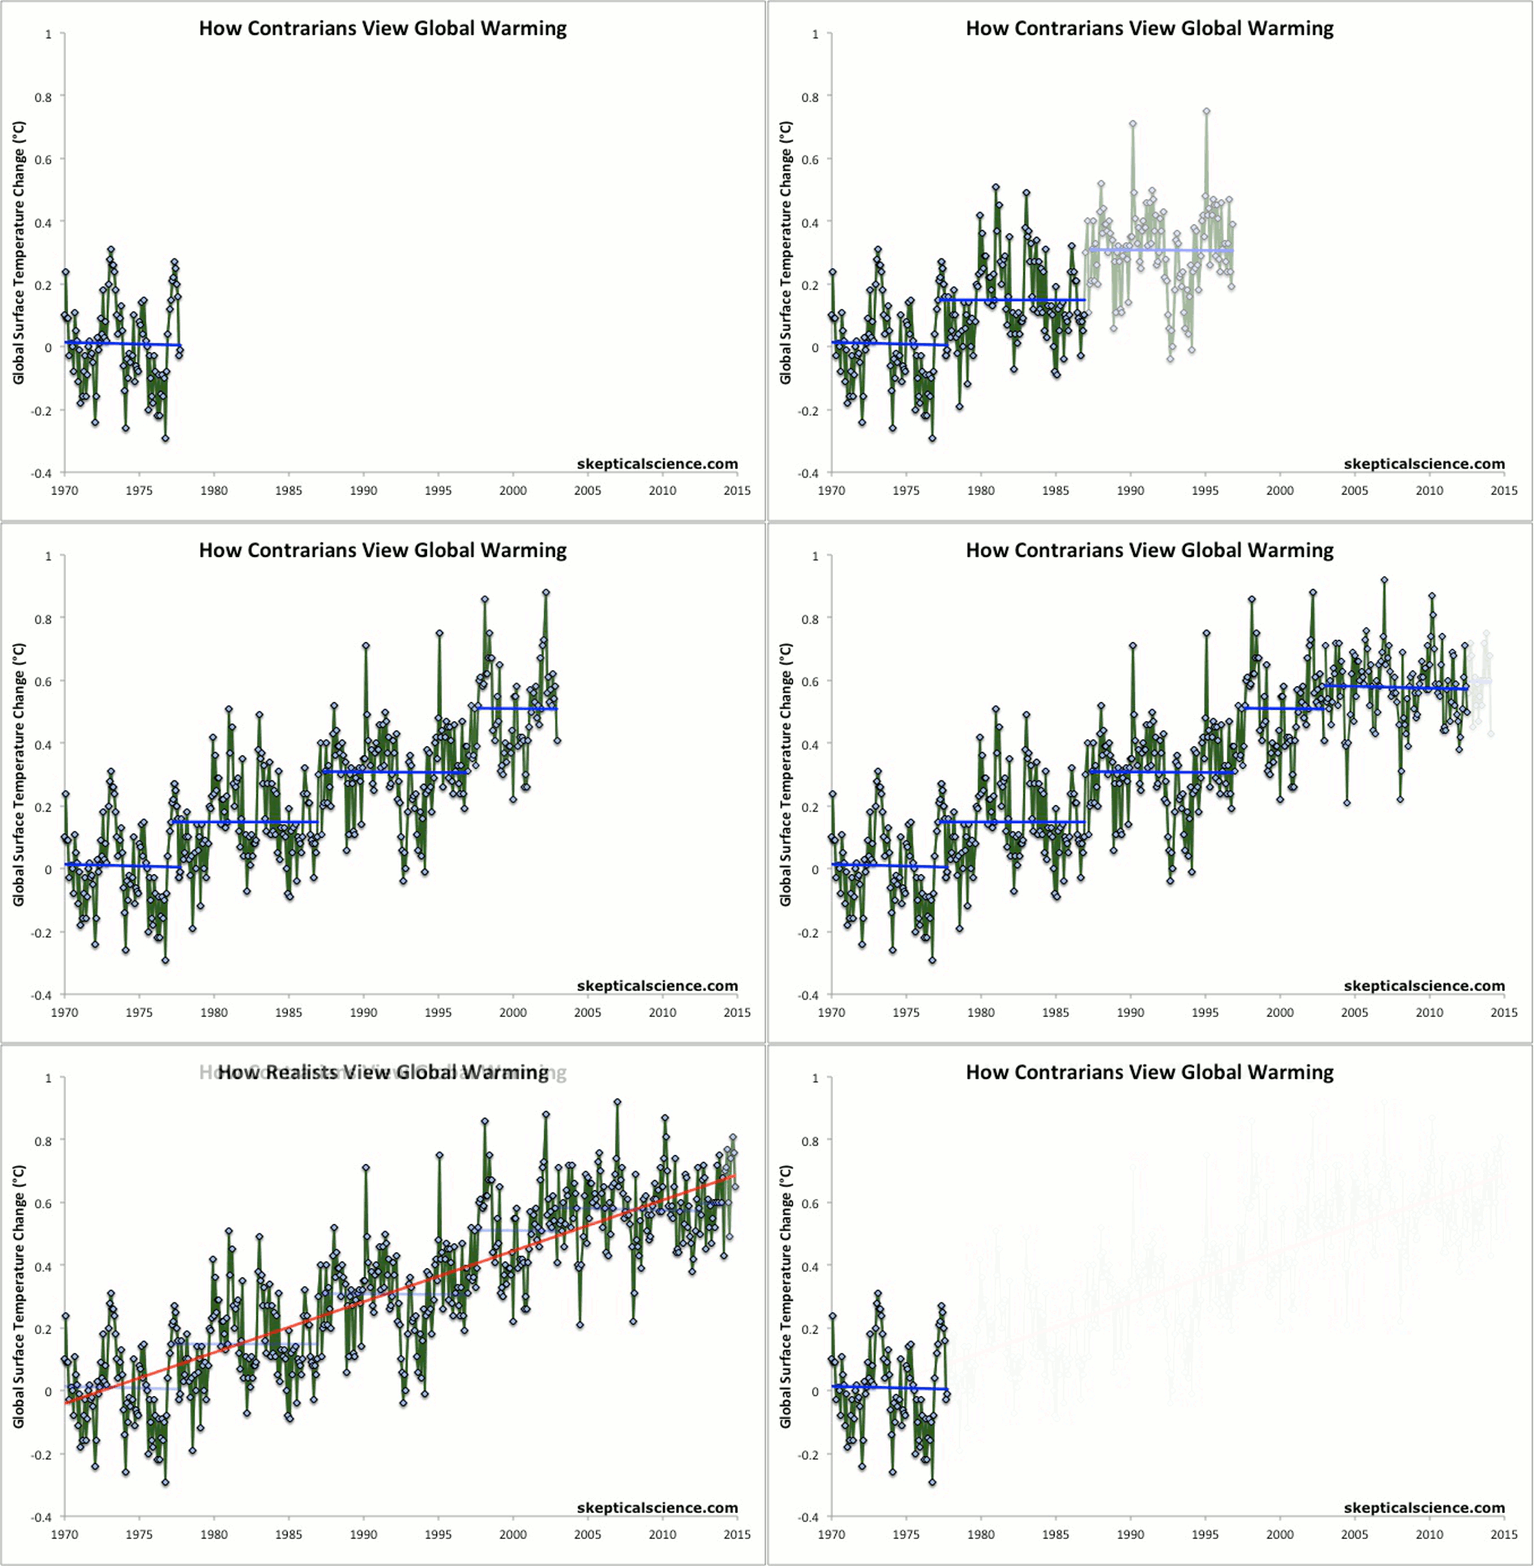
This is all happening during a time when we’re constantly being bombarded with inaccurate claims of a global warming “pause.” These mistaken claims stem from the fact that the rate of global surface warming has slowed a bit over the past 15 years, in large part because we’ve seen more La Niña events and fewer El Niño events during that time, and also due to heightened volcanic activity.
In fact, at any point over the past five decades we can find a period during which global surface warming “paused.” Yet each such period was hotter than the last. That’s because each is just a temporary effect caused by a period with a predominance of La Niña events and other short-term cooling temperature influences. As this figure shows (click here for an animated version), underneath the short-term noise, human-caused global warming continues unabated.

Following the global surface temperature records set in 2005 and 2010, a new record in 2014 is right on schedule. A 2011 paper by Stefan Rahmstorf and Dim Coumou found that as global warming continues, we should expect to set new records about once every four years.
Indeed, if we only use the data of the past 30 y, these show an almost linear trend of 0.017°C/y, yielding an expected 2.5 new record hot temperatures in the last decade [1 per 4 years].
Given that we may see an El Niño event in early 2015, there’s also a chance that this record could be short lived, and 2015 might break it once again.
On top of the record global surface temperatures, we also saw a record amount of heat accumulating on Earth, mainly in the oceans. According to NOAA, in 2014 the oceans accumulated an amount of heat equivalent to about 200 million atomic bomb detonations (13 zettajoules, or 13 billion trillion Joules). That’s about 6 to 7 atomic bomb detonations per second, on average, throughout 2014. That’s a lot of heat, likewise reaching record levels.
Climate Nexus summarizes some other notable climate facts from 2014 in this video,

